Revere, MA (Massachusetts) Houses and Residents
| Revere: | $533,658 |
| Massachusetts: | $534,700 |
Mean price in 2022:
Detached houses: $612,856
Here: $612,856 State: $651,570 Townhouses or other attached units: $672,501
Here: $672,501 State: $617,749 In 2-unit structures: $707,041
Here: $707,041 State: $594,808 In 3-to-4-unit structures: $593,586
Here: $593,586 State: $601,912 In 5-or-more-unit structures: $404,655
Here: $404,655 State: $555,768
Total population: 54,157 (Urban population: 47,283, Rural population: 0)
Houses: 23,772 (21,966 occupied: 11,352 owner occupied, 10,915 renter occupied)
| % of renters here: | 49% |
| State: | 38% |
Housing density: 4,019 houses/condos per square mile
Median price asked for vacant for-sale houses and condos in 2022: $484,437.
Median contract rent in 2022: $1,597 (lower quartile is $1,026, upper quartile is over $2,000)
Median rent asked for vacant for-rent units in 2022: $1,866
Median gross rent in Revere, MA in 2022: $1,779
Housing units in Revere with a mortgage: 7,252 (1,007 second mortgage, 10 home equity loan, 614 both second mortgage and home equity loan)
Houses without a mortgage: 265
Median household income for houses/condos with a mortgage: $122,739
Median household income for apartments without a mortgage: $82,584
Median monthly housing costs: $1,873
Compare current foreclosures in Revere, MA:
| Photo | Address | Area | Beds / Baths | Price | Details |
|---|---|---|---|---|---|

|
#1
Fenwick St
Revere, MA 02151
|
2,080 sq. feet
|
1 baths 3 beds |
show details | |

|
#2
Vinal St
Revere, MA 02151
|
2,715 sq. feet
|
2 baths 4 beds |
show details | |

|
#3
Oakwood Ave
Revere, MA 02151
|
1,380 sq. feet
|
2 baths 3 beds |
show details | |

|
#4
Ambrose St
Revere, MA 02151
|
2,417 sq. feet
|
3 baths 3 beds |
show details | |

|
#5
Revere St
Revere, MA 02151
|
3,160 sq. feet
|
3 baths 2 beds |
show details | |

|
#6
Butler St
Revere, MA 02151
|
1,932 sq. feet
|
2 baths 3 beds |
show details | |

|
#7
Essex St # 2
Revere, MA 02151
|
2,333 sq. feet
|
2 baths 4 beds |
show details | |

|
#8
Revere Beach Blvd Apt 204
Revere, MA 02151
|
806 sq. feet
|
1 baths 2 beds |
show details | |

|
#9
Rice Ave
Revere, MA 02151
|
1,727 sq. feet
|
2 baths 2 beds |
show details | |

|
#10
Howard St
Revere, MA 02151
|
1,284 sq. feet
|
1 baths 3 beds |
show details |
| Photo | Address | Area | Beds / Baths | Price | Details |
|---|---|---|---|---|---|

|
#11
Bradstreet Ave
Revere, MA 02151
|
2,415 sq. feet
|
1 baths 3 beds |
show details | |

|
#12
Mountain Ave
Revere, MA 02151
|
1,587 sq. feet
|
2 baths 4 beds |
show details | |

|
#13
Oxford St
Revere, MA 02151
|
1,456 sq. feet
|
2 baths 4 beds |
show details | |

|
#14
Revere Beach Blvd Apt 404
Revere, MA 02151
|
628 sq. feet
|
1 baths 1 beds |
show details | |

|
#15
Pierce St
Revere, MA 02151
|
1,070 sq. feet
|
1 baths 1 beds |
show details | |

|
#16
Kilburn St
Revere, MA 02151
|
2,007 sq. feet
|
1 baths 3 beds |
show details | |

|
#17
Winthrop Ave # 3
Revere, MA 02151
|
3,499 sq. feet
|
4 baths 4 beds |
show details | |

|
#18
Lowell St
Revere, MA 02151
|
1,994 sq. feet
|
2 baths 4 beds |
show details | |

|
#19
Suffolk Ave
Revere, MA 02151
|
2,741 sq. feet
|
2 baths 3 beds |
show details | |

|
#20
Atwood St # 7
Revere, MA 02151
|
1,288 sq. feet
|
2 baths 3 beds |
show details |
| Photo | Address | Area | Beds / Baths | Price | Details |
|---|---|---|---|---|---|

|
#21
Joseph Rd
Revere, MA 02151
|
1,761 sq. feet
|
2 baths 4 beds |
show details | |

|
#22
Ridge Rd
Revere, MA 02151
|
2,223 sq. feet
|
2 baths 4 beds |
show details | |

|
#23
Fiske St
Revere, MA 02151
|
3,335 sq. feet
|
3 baths 6 beds |
show details | |

|
#24
Rumney Rd
Revere, MA 02151
|
2,868 sq. feet
|
4 baths 4 beds |
show details | |

|
#25
Salem St Apt 405
Revere, MA 02151
|
1,296 sq. feet
|
1 baths 2 beds |
show details | |

|
#26
North Ave
Revere, MA 02151
|
- sq. feet
|
1 baths 2 beds |
show details | |

|
#27
Salem St
Revere, MA 02151
|
46,566 sq. feet
|
- baths - beds |
show details | |

|
#28
Revere Beach Blvd # 236
Revere, MA 02151
|
- sq. feet
|
- baths - beds |
show details | |

|
#29
Sagamore St Unit D
Revere, MA 02151
|
- sq. feet
|
- baths - beds |
show details | |

|
#30
Overlook Ridge Ter Unit 417
Revere, MA 02151
|
- sq. feet
|
- baths - beds |
show details |
| Photo | Address | Area | Beds / Baths | Price | Details |
|---|---|---|---|---|---|

|
#31
Hyde St
Revere, MA 02151
|
- sq. feet
|
- baths - beds |
show details | |

|
#32
Endicott Ave
Revere, MA 02151
|
- sq. feet
|
- baths - beds |
show details | |

|
#33
Fowler Ave
Revere, MA 02151
|
- sq. feet
|
- baths - beds |
show details | |

|
#34
Ocean Ave # 427
Revere, MA 02151
|
- sq. feet
|
- baths - beds |
show details | |

|
#35
Washington Ave
Revere, MA 02151
|
- sq. feet
|
- baths - beds |
show details | |

|
#36
Dunn Rd
Revere, MA 02151
|
- sq. feet
|
- baths - beds |
show details | |

|
#37
Revere Beach Blvd # 1f
Revere, MA 02151
|
- sq. feet
|
- baths - beds |
show details | |

|
Check over 1 million property listings on Foreclosure.com!
|
browse all offers | |||

Latest news about housing in Revere, MA collected exclusively by city-data.com from local newspapers, TV, and radio stations

 | How Much Massachusetts Households Make Per Year: Census Data (37 replies) |
| Violent night at Revere Beach: 2 shootings, several fights (82 replies) |
| 3 Bedroom Houses in Watertown for Under $500,000 (11 replies) |
| Crazy Rents (80 replies) |
| 2020 Real Estate Observations (623 replies) |
| Most affordable neighborhoods rent-wise (99 replies) |

Median year apartment built: 1977
Household type by relationship:
Households: 59,106- Male householders: 10,924 (2,610 living alone), Female householders: 10,092 (3,746 living alone)
8,544 spouses (8,382 opposite-sex spouses), 2,333 unmarried partners, (2,256 opposite-sex unmarried partners), 14,725 children (14,160 natural, 111 adopted, 453 stepchildren), 1,004 grandchildren, 1,429 brothers or sisters, 2,872 parents, 0 foster children, 3,481 other relatives, 3,398 non-relatives
- In group quarters: 299
Size of family households: 4,273 2-persons, 3,455 3-persons, 2,945 4-persons, 1,789 5-persons, 566 6-persons, 432 7-or-more-persons.
Size of nonfamily households: 6,882 1-person, 1,397 2-persons, 199 3-persons, 84 4-persons, 115 5-persons.
6,314 married couples with children.
3,526 single-parent households (1,064 men, 2,462 women).
43.3% of residents of Revere speak English at home.
37.4% of residents speak Spanish at home (40% speak English very well, 31% speak English well, 18% speak English not well, 11% don't speak English at all).
12.5% of residents speak other Indo-European language at home (55% speak English very well, 23% speak English well, 17% speak English not well, 5% don't speak English at all).
3.1% of residents speak Asian or Pacific Island language at home (29% speak English very well, 21% speak English well, 42% speak English not well, 9% don't speak English at all).
3.8% of residents speak other language at home (52% speak English very well, 31% speak English well, 14% speak English not well, 2% don't speak English at all).
Foreign born population: 25,661 (43.4%)
(45.6% of them are naturalized citizens)
| Here: | 5.9 |
| State: | 6.5 |
| Here: | 3.7 |
| State: | 4.0 |

- Bedrooms in owner-occupied houses and condos in Revere, Massachusetts
- 239no bedroom
- 6661 bedroom
- 2,8412 bedrooms
- 4,3973 bedrooms
- 2,2234 bedrooms
- 9875+ bedrooms

- Bedrooms in renter-occupied apartments in Revere, Massachusetts
- 1,102no bedroom
- 3,6861 bedroom
- 3,9932 bedrooms
- 1,7983 bedrooms
- 3154 bedrooms
- 235+ bedrooms

- Cars and other vehicles available in Revere in owner-occupied houses/condos
- 587no vehicle
- 4,3111 vehicle
- 4,2862 vehicles
- 1,5713 vehicles
- 3354 vehicles
- 2625+ vehicles

- Cars and other vehicles available in Revere in renter-occupied apartments
- 3,350no vehicle
- 5,3701 vehicle
- 1,7792 vehicles
- 4043 vehicles
- 74 vehicles
- 65+ vehicles

- Rooms in owner-occupied houses in Revere, Massachusetts
- 2131 room
- 1812 rooms
- 4913 rooms
- 1,4404 rooms
- 2,2575 rooms
- 2,6866 rooms
- 1,1667 rooms
- 1,4578 rooms
- 1,4629+ rooms

- Rooms in renter-occupied apartments in Revere, Massachusetts
- 1,0101 room
- 1,2602 rooms
- 2,6353 rooms
- 3,0684 rooms
- 1,7125 rooms
- 9216 rooms
- 1037 rooms
- 1788 rooms
- 289+ rooms


Revere, MA household income distribution

- 1,609Less than $10,000
- 1,894$10,000 to $19,999
- 1,455$20,000 to $29,999
- 1,465$30,000 to $39,999
- 1,302$40,000 to $49,999
- 1,123$50,000 to $59,999
- 2,027$60,000 to $74,999
- 2,802$75,000 to $99,999
- 2,109$100,000 to $124,999
- 1,971$125,000 to $149,999
- 2,366$150,000 to $199,999
- 2,164$200,000 or more

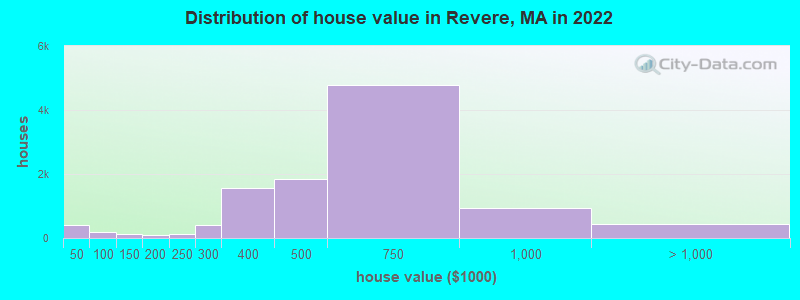
Home value of owner - occupied houses in 2022 in Revere, MA
-
- 384Less than $10,000
- 15$15,000 to $19,999
- 11$20,000 to $24,999
- 23$50,000 to $59,999
- 11$70,000 to $79,999
- 168$80,000 to $89,999
- 34$100,000 to $124,999
- 76$125,000 to $149,999
- 9$150,000 to $174,999
- 70$175,000 to $199,999
- 124$200,000 to $249,999
- 404$250,000 to $299,999
- 1,552$300,000 to $399,999
- 1,837$400,000 to $499,999
- 4,793$500,000 to $749,999
- 926$750,000 to $999,999
- 328$1,000,000 to $1,499,999
- 21$1,500,000 to $1,999,999
- 88$2,000,000 or more
Rent paid by renters in 2022 in Revere, MA
-
- 57Less than $100
- 19$100 to $149
- 29$150 to $199
- 381$200 to $249
- 172$250 to $299
- 228$300 to $349
- 227$350 to $399
- 91$400 to $449
- 13$450 to $499
- 216$500 to $549
- 58$550 to $599
- 395$600 to $649
- 50$650 to $699
- 66$700 to $749
- 136$750 to $799
- 96$800 to $899
- 373$900 to $999
- 989$1,000 to $1,249
- 1,200$1,250 to $1,499
- 2,399$1,500 to $1,999
- 1,996$2,000 to $2,499
- 740$2,500 to $2,999
- 316$3,000 to $3,499
- 76$3,500 or more
- 771No cash rent


Percentage of workers working in this county: 67.7%
Number of people working at home: 2,889 (9.2% of all workers)
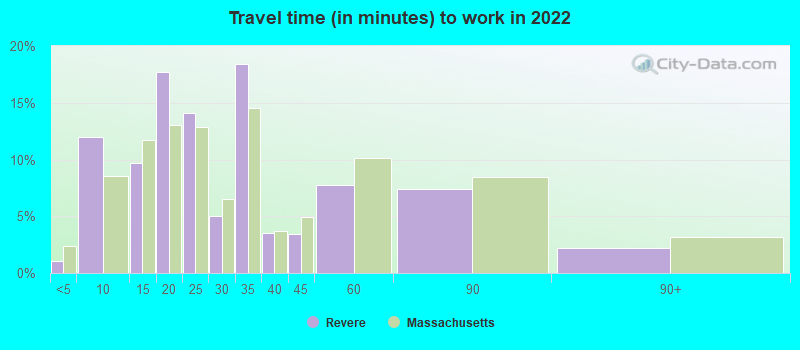
Travel time to work (commute)
- Less than 5 minutes: 206
- 5 to 9 minutes: 1,712
- 10 to 14 minutes: 2,064
- 15 to 19 minutes: 3,363
- 20 to 24 minutes: 2,844
- 25 to 29 minutes: 1,610
- 30 to 34 minutes: 4,736
- 35 to 39 minutes: 1,277
- 40 to 44 minutes: 1,821
- 45 to 59 minutes: 3,188
- 60 to 89 minutes: 3,617
- 90 or more minutes: 999
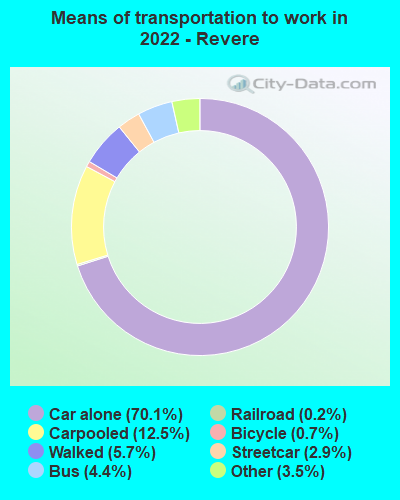
Means of transportation to work:
- Drove a car alone: 7,117 (58.6%)
- Carpooled: 1,397 (11.5%)
- Bus: 426 (3.5%)
- Subway or elevated rail: 242 (2.0%)
- Long-distance train or commuter rail: 5 (0.0%)
- Light rail, streetcar or trolley: 18 (0.1%)
- Ferryboat: 1 (0.0%)
- Taxi: 377 (3.1%)
- Bicycle: 74 (0.6%)
- Walked: 560 (4.6%)
- Worked at home: 2,889 (23.8%)

- Unemployment by race in 2022
- Unemployment rate for White non-Hispanic residents
- 3.3%Males
- 6.1%Females
- Unemployment rate for Black residents
- 1.6%Females
- Unemployment rate for American Indian and Alaska Native residents
- 27.1%Males
- Unemployment rate for Asian residents
- 12.2%Males
- 1.3%Females
- Unemployment rate for other race residents
- 0.7%Males
- 7.8%Females
- Unemployment rate for two or more race residents
- 4.5%Males
- 8.2%Females
- Unemployment rate for Hispanic or Latino residents
- 4.0%Males
- 7.2%Females

- Year of entry for the foreign-born population in Revere, Massachusetts
- 11,1822010 or later
- 6,3372000 to 2009
- 4,2761990 to 1999
- 2,7931980 to 1989
- 8561970 to 1979
- 1,751Before 1970

First ancestries reported:
- Italian: 5,552 (15.0%)
- Brazilian: 2,293 (6.2%)
- Moroccan: 2,198 (5.9%)
- Irish: 1,727 (4.7%)
- American: 877 (2.4%)
- Albanian: 731 (2.0%)
- Yugoslavian: 603 (1.6%)
- Haitian: 588 (1.6%)
- English: 430 (1.2%)
- Trinidadian and Tobagonian: 416 (1.1%)
- European: 345 (0.9%)
- Portuguese: 316 (0.9%)
- Polish: 218 (0.6%)
- French Canadian: 179 (0.5%)
- Russian: 163 (0.4%)
- Scottish: 112 (0.3%)
- German: 109 (0.3%)
- French: 108 (0.3%)
- Turkish: 82 (0.2%)
- Ethiopian: 79 (0.2%)
- Cape Verdean: 76 (0.2%)
- Serbian: 62 (0.2%)
- African: 62 (0.2%)
- Arab: 56 (0.2%)
- Armenian: 54 (0.1%)
- Greek: 53 (0.1%)
- Lebanese: 52 (0.1%)
- Ugandan: 51 (0.1%)
- Eastern European: 50 (0.1%)
- Egyptian: 46 (0.1%)
- Guyanese: 40 (0.1%)
- Croatian: 32 (0.09%)
- Sudanese: 31 (0.08%)
- Swedish: 29 (0.08%)
- Iranian: 26 (0.07%)
- Jamaican: 26 (0.07%)
- Romanian: 23 (0.06%)
- Lithuanian: 21 (0.06%)
- Danish: 21 (0.06%)
- Finnish: 16 (0.04%)
- Norwegian: 14 (0.04%)
- Kenyan: 14 (0.04%)
- Ukrainian: 14 (0.04%)
- British West Indian: 14 (0.04%)
- Scotch-Irish: 12 (0.03%)
- Canadian: 6 (0.02%)
- Northern European: 4 (0.01%)
- British: 3 (0.01%)
Most common places of birth for foreign-born residents (%):
| Revere: | 24.6% (6,705) |
| Massachusetts: | 2.3% (27,810) |
| Revere: | 20.2% (5,525) |
| Massachusetts: | 3.7% (45,667) |
| Revere: | 10.7% (2,914) |
| Massachusetts: | 7.6% (92,959) |
| Revere: | 9.1% (2,476) |
| Massachusetts: | 2.7% (32,733) |
| Revere: | 5.0% (1,365) |
| Massachusetts: | 0.7% (8,562) |
| Revere: | 4.2% (1,145) |
| Massachusetts: | 1.1% (13,563) |
| Revere: | 3.6% (970) |
| Massachusetts: | 1.4% (16,886) |
| Revere: | 2.6% (715) |
| Massachusetts: | 1.1% (13,076) |
| Revere: | 2.2% (611) |
| Massachusetts: | 8.4% (103,233) |
| Revere: | 2.1% (585) |
| Massachusetts: | 0.2% (1,916) |
| Revere: | 1.9% (522) |
| Massachusetts: | 3.0% (37,197) |
| Revere: | 1.7% (469) |
| Massachusetts: | 8.3% (101,767) |
Place of birth for U.S.-born residents:
- This state: 27,800
- Other state: 4,118
- Northeast: 1,634
- Midwest: 721
- South: 948
- West: 820
85.0% of Revere residents lived in the same house 1 years ago.
Out of people who lived in different houses, 35.0% lived in this county.
Out of people who lived in different counties, 66.4% lived in Massachusetts.
| Revere: | 85.0% |
| State average: | 87.7% |
Education attainment for males 25 years and older:
- No schooling: 1,168
- Nursery to 4th grade: 366
- 5th and 6th grade: 686
- 7th and 8th grade: 214
- 9th grade: 450
- 10th grade: 465
- 11th grade: 122
- 12th grade, no diploma: 301
- High school graduate (or equivalency): 8,262
- Less than 1 year of college: 1,463
- Some college more than 1 year, no degree: 1,926
- Associate degree: 1,095
- Bachelor's degree: 3,472
- Master's degree: 1,217
- Professional school degree: 311
- Doctorate degree: 187

Education attainment for females 25 years and older:
- No schooling: 844
- Nursery to 4th grade: 291
- 5th and 6th grade: 234
- 7th and 8th grade: 327
- 9th grade: 378
- 10th grade: 337
- 11th grade: 340
- 12th grade, no diploma: 566
- High school graduate (or equivalency): 8,037
- Less than 1 year of college: 1,310
- Some college more than 1 year, no degree: 1,717
- Associate degree: 1,657
- Bachelor's degree: 3,702
- Master's degree: 1,491
- Professional school degree: 226
- Doctorate degree: 171


Housing units in structures:
- One, detached: 7,330
- One, attached: 1,387
- Two: 5,334
- 3 or 4: 2,531
- 5 to 9: 813
- 10 to 19: 954
- 20 to 49: 797
- 50 or more: 4,444
- Mobile homes: 172
- Boats, RVs, vans, etc.: 6
Housing units lacking complete kitchen facilities in 2022: 1.5%
House/condo owner moved in on average 13 years ago
Renter moved in on average 2 years ago

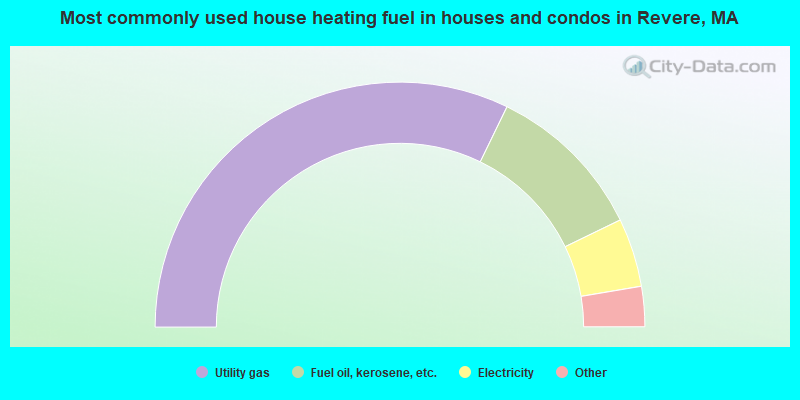
- 64.4%Utility gas
- 21.2%Fuel oil, kerosene, etc.
- 9.1%Electricity
- 3.8%Bottled, tank, or LP gas
- 0.8%Solar energy
- 0.6%No fuel used
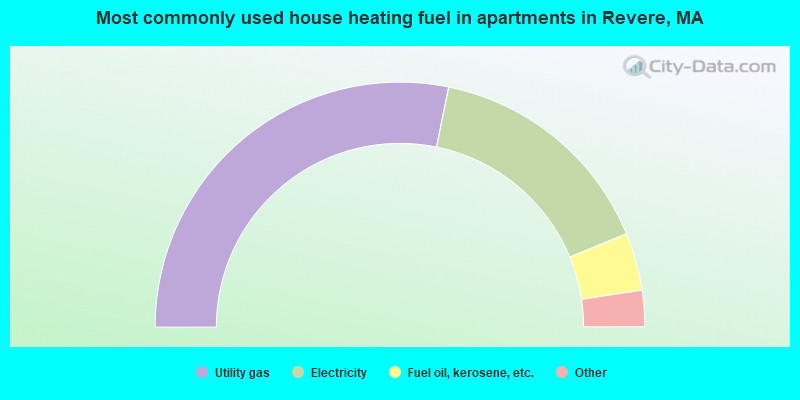
- 56.4%Utility gas
- 31.2%Electricity
- 7.6%Fuel oil, kerosene, etc.
- 3.1%Bottled, tank, or LP gas
- 1.1%No fuel used
- 0.6%Other fuel
Private vs. public school enrollment:
| Here: | 9.9% |
| Massachusetts: | 10.3% |
| Here: | 5.1% |
| Massachusetts: | 12.3% |
| Here: | 45.9% |
| Massachusetts: | 51.2% |


