Richmond, IN (Indiana) Houses and Residents
Estimated median house or condo value in 2022: $108,637 (it was $71,200 in 2000 )
Richmond:
$108,637Indiana:
$208,700
Lower value quartile - upper value quartile: $69,827 - $164,021Mean price in 2022: Detached houses: $153,208 Here:
$153,208State:
$257,916
Townhouses or other attached units: $129,475 Here:
$129,475State:
$224,114
In 2-unit structures: $178,968 Here:
$178,968State:
$175,375
In 3-to-4-unit structures: $46,351 Here:
$46,351State:
$151,116
In 5-or-more-unit structures: $195,082 Here:
$195,082State:
$200,844
Mobile homes: $20,238 Here:
$20,238State:
$67,116
Total population: 36,159 (All urban)
Houses: 17,324 (14,808 occupied: 8,457 owner occupied, 6,575 renter occupied )
% of renters here:
44%State:
29%
Housing density: 746 houses/condos per square mile
Median price asked for vacant for-sale houses and condos in 2022: $63,700.
Median contract rent in 2022: $549 (lower quartile is $427, upper quartile is $671)
Median rent asked for vacant for-rent units in 2022: $636
Median gross rent in Richmond, IN in 2022: $711
Housing units in Richmond with a mortgage: 5,198 (515 second mortgage, 10 home equity loan, 518 both second mortgage and home equity loan )Houses without a mortgage: 105
Median household income for houses/condos with a mortgage: $69,009
Median household income for apartments without a mortgage: $40,916
Median monthly housing costs: $727
Data:
Median house or condo value ($)
Median house or condo value ($ change since 2000)
Median house or condo value ($) - White
Median house or condo value ($) - Black or African American
Median house or condo value ($) - Asian
Median house or condo value ($) - Hispanic or Latino
Median house or condo value ($) - American Indian and Alaska Native
Median house or condo value ($) - Multirace
Median house or condo value ($) - Other Race
Median price asked for mobile homes ($)
Household density (households per square mile)
Mean house or condo value by units in structure - 1, detached ($)
Mean house or condo value by units in structure - 1, attached ($)
Mean house or condo value by units in structure - 2 ($)
Mean house or condo value by units in structure by units in structure - 3 or 4 ($)
Mean house or condo value by units in structure - 5 or more ($)
Mean house or condo value by units in structure - Boat, RV, van, etc. ($)
Mean house or condo value by units in structure - Mobile home ($)
Median contract rent ($)
Median contract rent - Lower quartile ($)
Median contract rent - Upper quartile ($)
Median gross rent ($)
Urban houses (%)
Rural houses (%)
Houses occupied (%)
Houses occupied (% change since 2000)
Houses owner occupied (%)
Houses owner occupied (% change since 2000)
Houses renter occupied (%)
Houses renter occupied (% change since 2000)
Vacant housing units - For rent (%)
Vacant housing units - For rent (% change since 2000)
Vacant housing units - For sale only (%)
Vacant housing units - For sale only (% change since 2000)
Vacant housing units - Rented or sold, not occupied (%)
Vacant housing units - Rented or sold, not occupied (% change since 2000)
Vacant housing units - For seasonal, recreational, or occasional use (%)
Vacant housing units - For seasonal, recreational, or occasional use (% change since 2000)
Vacant housing units - For migrant workers (%)
Vacant housing units - For migrant workers (% change since 2000)
Vacant housing units - Other vacant (%)
Vacant housing units - Other vacant (% change since 2000)
Median monthly housing costs ($)
Median household income for houses/condos with a mortgage ($)
Median household income for houses/condos without a mortgage ($)
Median household income ($)
Median household income ($) - White
Median household income ($) - Black or African American
Median household income ($) - Asian
Median household income ($) - Hispanic or Latino
Median household income ($) - American Indian and Alaska Native
Median household income ($) - Multirace
Median household income ($) - Other Race
Mortgage status - with mortgage (%)
Mortgage status - with second mortgage (%)
Mortgage status - with home equity loan (%)
Mortgage status - with both second mortgage and home equity loan (%)
Mortgage status - without a mortgage (%)
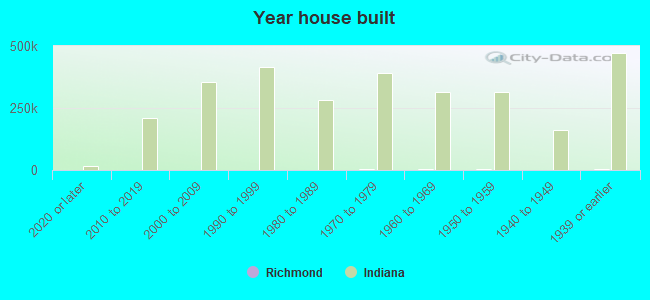
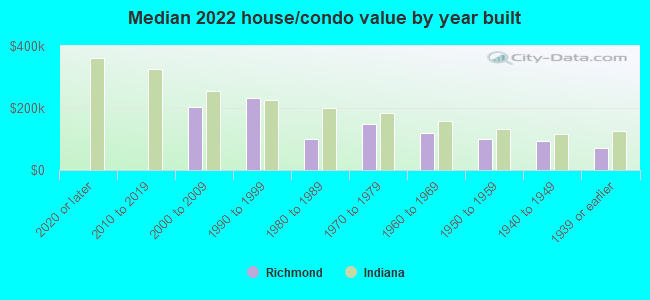
Median year house/condo built
Median year apartment built
Household type by relationship - Male householder living alone (%)
Household type by relationship - Male householder not living alone (%)
Household type by relationship - Female householder living alone (%)
Household type by relationship - Female householder not living alone (%)
Household type by relationship - Opposite-Sex spouse (%)
Household type by relationship - Same-Sex spouse (%)
Household type by relationship - Opposite-Sex unmarried partner (%)
Household type by relationship - Same-Sex unmarried partner (%)
Household type by relationship - In group quarters (%)
Size of family households - 2-person household (%)
Size of family households - 3-person household (%)
Size of family households - 4-person household (%)
Size of family households - 5-person household (%)
Size of family households - 6-person household (%)
Size of family households - 7-or-more-person household (%)
Size of nonfamily households - 1-person household (%)
Size of nonfamily households - 2-person household (%)
Size of nonfamily households - 3-person household (%)
Size of nonfamily households - 4-person household (%)
Size of nonfamily households - 5-person household (%)
Size of nonfamily households - 6-person household (%)
Size of nonfamily households - 7-or-moreperson household (%)
Year house built - Built 2010 or later (%)
Year house built - Built 2000 to 2009 (%)
Year house built - Built 1990 to 1999 (%)
Year house built - Built 1980 to 1989 (%)
Year house built - Built 1970 to 1979 (%)
Year house built - Built 1960 to 1969 (%)
Year house built - Built 1950 to 1959 (%)
Year house built - Built 1940 to 1949 (%)
Year house built - Built 1939 or earlier (%)
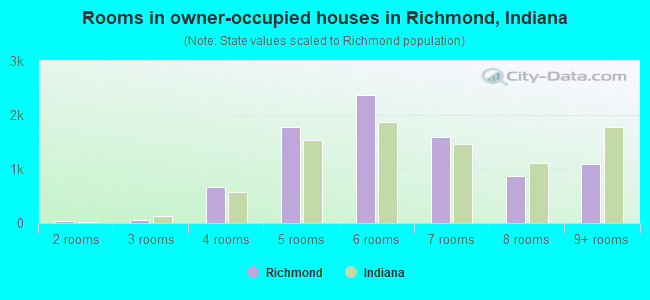
Median number of rooms in houses and condos
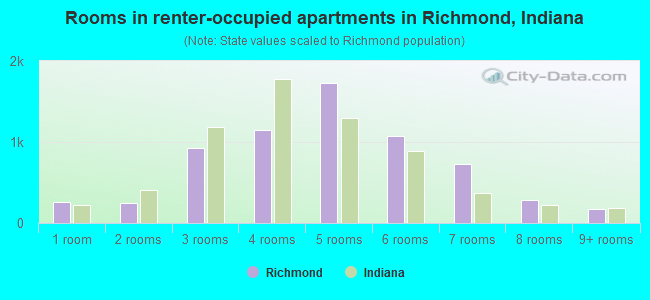
Median number of rooms in apartments
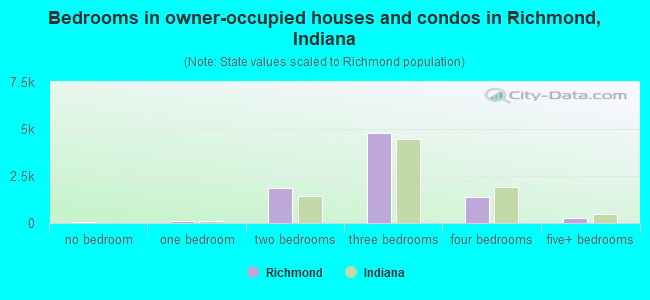
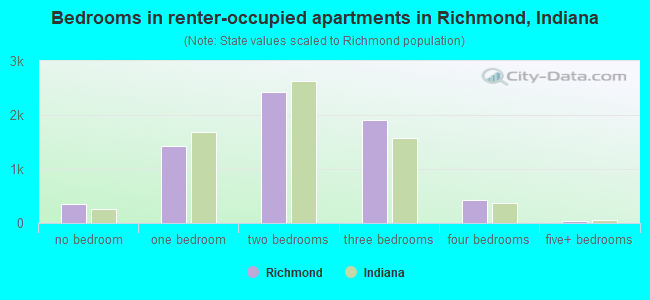
Median number of bedrooms in owner occupied houses
Mean number of bedrooms in owner occupied houses
Median number of bedrooms in renter occupied houses
Mean number of bedrooms in renter occupied houses
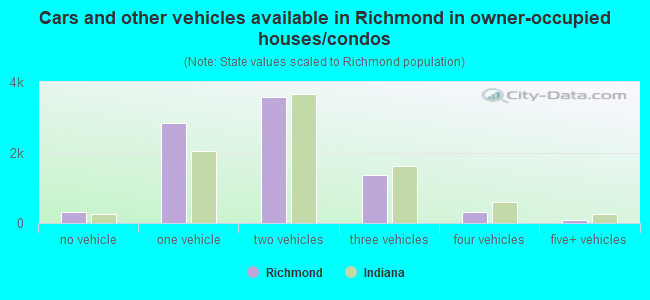
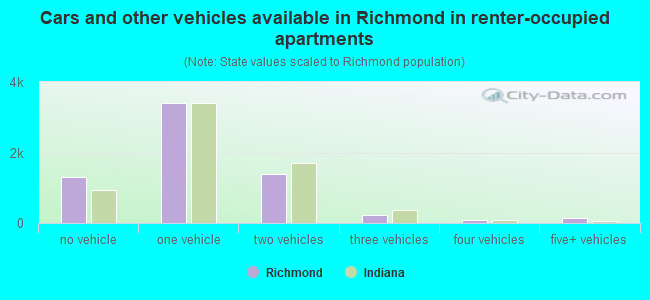
Median number of vehichles in owner occupied houses
Mean number of vehichles in owner occupied houses
Median number of vehichles in renter occupied houses
Mean number of vehichles in renter occupied houses
Rooms in owner-occupied houses - 1 room (%)
Rooms in owner-occupied houses - 2 rooms (%)
Rooms in owner-occupied houses - 3 rooms (%)
Rooms in owner-occupied houses - 4 rooms (%)
Rooms in owner-occupied houses - 5 rooms (%)
Rooms in owner-occupied houses - 6 rooms (%)
Rooms in owner-occupied houses - 7 rooms (%)
Rooms in owner-occupied houses - 8 rooms (%)
Rooms in owner-occupied houses - 9+ rooms (%)
Rooms in renter-occupied houses - 1 room (%)
Rooms in renter-occupied houses - 2 rooms (%)
Rooms in renter-occupied houses - 3 rooms (%)
Rooms in renter-occupied houses - 4 rooms (%)
Rooms in renter-occupied houses - 5 rooms (%)
Rooms in renter-occupied houses - 6 rooms (%)
Rooms in renter-occupied houses - 7 rooms (%)
Rooms in renter-occupied houses - 8 rooms (%)
Rooms in renter-occupied houses - 9+ rooms (%)
Bedrooms in owner-occupied houses - no bedrooms (%)
Bedrooms in owner-occupied houses - 1 bedroom (%)
Bedrooms in owner-occupied houses - 2 bedrooms (%)
Bedrooms in owner-occupied houses - 3 bedrooms (%)
Bedrooms in owner-occupied houses - 4 bedrooms (%)
Bedrooms in owner-occupied houses - 5+ bedrooms (%)
Bedrooms in renter-occupied houses - no bedrooms (%)
Bedrooms in renter-occupied houses - 1 bedroom (%)
Bedrooms in renter-occupied houses - 2 bedrooms (%)
Bedrooms in renter-occupied houses - 3 bedrooms (%)
Bedrooms in renter-occupied houses - 4 bedrooms (%)
Bedrooms in renter-occupied houses - 5+ bedrooms (%)
Vehicles available in owner-occupied houses - no vehicle available (%)
Vehicles available in owner-occupied houses - 1 vehicle available(%)
Vehicles available in owner-occupied houses - 2 Vehicles available (%)
Vehicles available in owner-occupied houses - 3 Vehicles available (%)
Vehicles available in owner-occupied houses - 4 Vehicles available (%)
Vehicles available in owner-occupied houses - 5+ Vehicles available (%)
Vehicles available in renter-occupied houses - no vehicle available (%)
Vehicles available in renter-occupied houses - 1 vehicle available (%)
Vehicles available in renter-occupied houses - 2 Vehicles available (%)
Vehicles available in renter-occupied houses - 3 Vehicles available (%)
Vehicles available in renter-occupied houses - 4 Vehicles available (%)
Vehicles available in renter-occupied houses - 5+ Vehicles available (%)
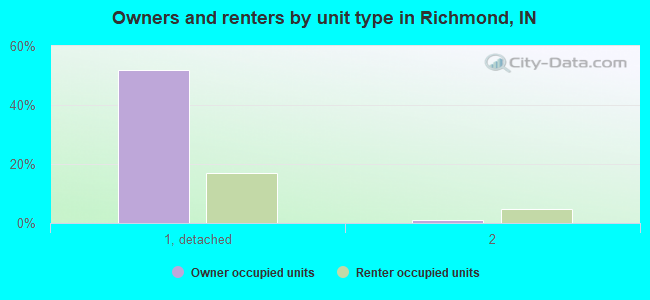
Housing units in structures - 1, detached (%)
Housing units in structures - 1, attached (%)
Housing units in structures - 2 (%)
Housing units in structures - 3 or 4 (%)
Housing units in structures - 5 to 9 (%)
Housing units in structures - 10 to 19 (%)
Housing units in structures - 20 to 49 (%)
Housing units in structures - 50 or more (%)
Housing units in structures - Mobile home (%)
Housing units in structures - Boat, RV, van, etc. (%)
Housing units in structures - Owners - 1, detached (%)
Housing units in structures - Owners - 1, attached (%)
Housing units in structures - Owners - 2 (%)
Housing units in structures - Owners - 3 or 4 (%)
Housing units in structures - Owners - 5 to 9 (%)
Housing units in structures - Owners - 10 to 19 (%)
Housing units in structures - Owners - 20 to 49 (%)
Housing units in structures - Owners - 50 or more (%)
Housing units in structures - Owners - Mobile home (%)
Housing units in structures - Owners - Boat, RV, van, etc. (%)
Housing units in structures - Renters - 1, detached (%)
Housing units in structures - Renters - 1, attached (%)
Housing units in structures - Renters - 2 (%)
Housing units in structures - Renters - 3 or 4 (%)
Housing units in structures - Renters - 5 to 9 (%)
Housing units in structures - Renters - 10 to 19 (%)
Housing units in structures - Renters - 20 to 49 (%)
Housing units in structures - Renters - 50 or more (%)
Housing units in structures - Renters - Mobile home (%)
Housing units in structures - Renters - Boat, RV, van, etc. (%)
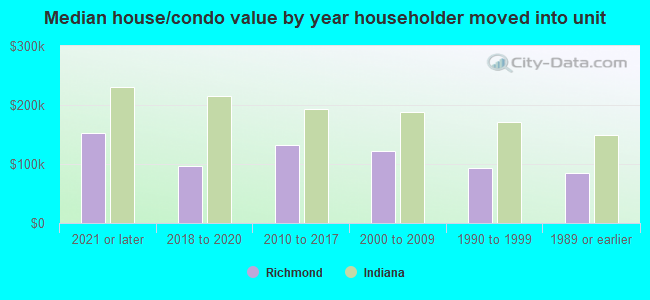
House/condo owner moved in on average (years ago)
Renter moved in on average (years ago)
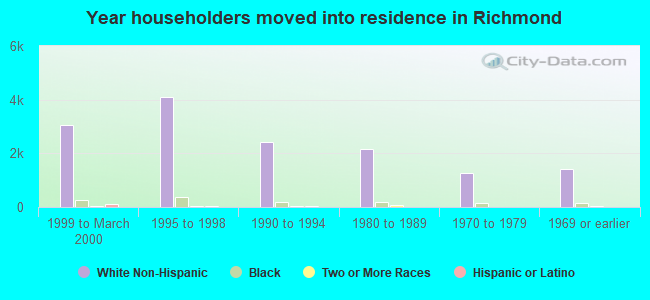
Year householder moved into unit - Moved in 1999 to March 2000 (%)
Year householder moved into unit - Moved in 1999 to March 2000 (%) - White
Year householder moved into unit - Moved in 1999 to March 2000 (%) - Black or African American
Year householder moved into unit - Moved in 1999 to March 2000 (%) - Asian
Year householder moved into unit - Moved in 1999 to March 2000 (%) - Hispanic or Latino
Year householder moved into unit - Moved in 1999 to March 2000 (%) - American Indian and Alaska Native
Year householder moved into unit - Moved in 1999 to March 2000 (%) - Multirace
Year householder moved into unit - Moved in 1999 to March 2000 (%) - Other Race
Year householder moved into unit - Moved in 1995 to 1998 (%)
Year householder moved into unit - Moved in 1995 to 1998 (%) - White
Year householder moved into unit - Moved in 1995 to 1998 (%) - Black or African American
Year householder moved into unit - Moved in 1995 to 1998 (%) - Asian
Year householder moved into unit - Moved in 1995 to 1998 (%) - Hispanic or Latino
Year householder moved into unit - Moved in 1995 to 1998 (%) - American Indian and Alaska Native
Year householder moved into unit - Moved in 1995 to 1998 (%) - Multirace
Year householder moved into unit - Moved in 1995 to 1998 (%) - Other Race
Year householder moved into unit - Moved in 1990 to 1994 (%)
Year householder moved into unit - Moved in 1990 to 1994 (%) - White
Year householder moved into unit - Moved in 1990 to 1994 (%) - Black or African American
Year householder moved into unit - Moved in 1990 to 1994 (%) - Asian
Year householder moved into unit - Moved in 1990 to 1994 (%) - Hispanic or Latino
Year householder moved into unit - Moved in 1990 to 1994 (%) - American Indian and Alaska Native
Year householder moved into unit - Moved in 1990 to 1994 (%) - Multirace
Year householder moved into unit - Moved in 1990 to 1994 (%) - Other Race
Year householder moved into unit - Moved in 1980 to 1989 (%)
Year householder moved into unit - Moved in 1980 to 1989 (%) - White
Year householder moved into unit - Moved in 1980 to 1989 (%) - Black or African American
Year householder moved into unit - Moved in 1980 to 1989 (%) - Asian
Year householder moved into unit - Moved in 1980 to 1989 (%) - Hispanic or Latino
Year householder moved into unit - Moved in 1980 to 1989 (%) - American Indian and Alaska Native
Year householder moved into unit - Moved in 1980 to 1989 (%) - Multirace
Year householder moved into unit - Moved in 1980 to 1989 (%) - Other Race
Year householder moved into unit - Moved in 1970 to 1979 (%)
Year householder moved into unit - Moved in 1970 to 1979 (%) - White
Year householder moved into unit - Moved in 1970 to 1979 (%) - Black or African American
Year householder moved into unit - Moved in 1970 to 1979 (%) - Asian
Year householder moved into unit - Moved in 1970 to 1979 (%) - Hispanic or Latino
Year householder moved into unit - Moved in 1970 to 1979 (%) - American Indian and Alaska Native
Year householder moved into unit - Moved in 1970 to 1979 (%) - Multirace
Year householder moved into unit - Moved in 1970 to 1979 (%) - Other Race
Year householder moved into unit - Moved in 1969 or earlier (%)
Year householder moved into unit - Moved in 1969 or earlier (%) - White
Year householder moved into unit - Moved in 1969 or earlier (%) - Black or African American
Year householder moved into unit - Moved in 1969 or earlier (%) - Asian
Year householder moved into unit - Moved in 1969 or earlier (%) - Hispanic or Latino
Year householder moved into unit - Moved in 1969 or earlier (%) - American Indian and Alaska Native
Year householder moved into unit - Moved in 1969 or earlier (%) - Multirace
Year householder moved into unit - Moved in 1969 or earlier (%) - Other Race
Housing units lacking complete plumbing facilities (%)
Housing units lacking complete kitchen facilities (%)
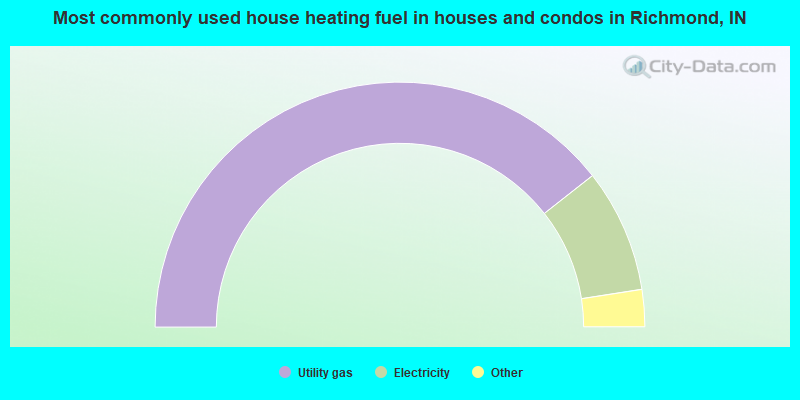
House heating fuel used in houses and condos - Utility gas (%)
House heating fuel used in houses and condos - Bottled, tank, or LP gas (%)
House heating fuel used in houses and condos - Electricity (%)
House heating fuel used in houses and condos - Fuel oil, kerosene, etc. (%)
House heating fuel used in houses and condos - Coal or coke (%)
House heating fuel used in houses and condos - Wood (%)
House heating fuel used in houses and condos - Solar energy (%)
House heating fuel used in houses and condos - Other fuel (%)
House heating fuel used in houses and condos - No fuel used (%)
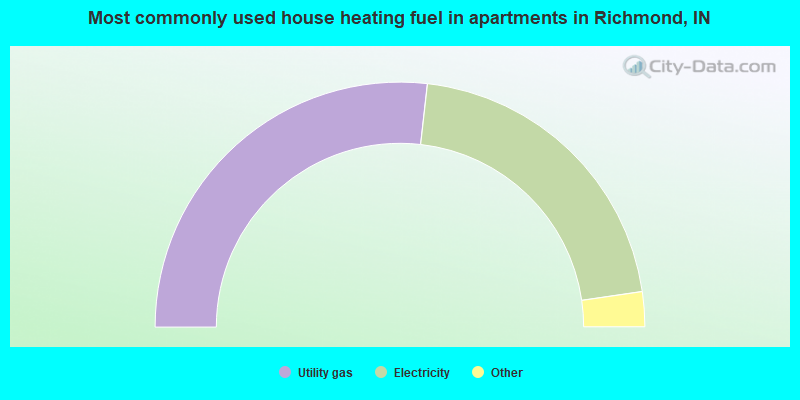
House heating fuel used in apartments - Utility gas (%)
House heating fuel used in apartments - Bottled, tank, or LP gas (%)
House heating fuel used in apartments - Electricity (%)
House heating fuel used in apartments - Fuel oil, kerosene, etc. (%)
House heating fuel used in apartments - Coal or coke (%)
House heating fuel used in apartments - Wood (%)
House heating fuel used in apartments - Solar energy (%)
House heating fuel used in apartments - Other fuel (%)
House heating fuel used in apartments - No fuel used (%)
Latest news about housing in Richmond, IN collected exclusively by city-data.com from local newspapers, TV, and radio stations
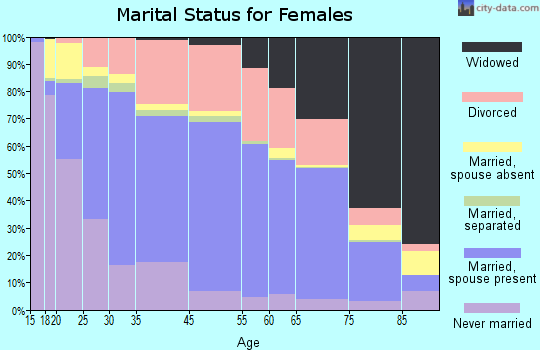
Median year house/condo built: 1959Median year apartment built: 1954Household type by relationship:
Households: 35,508
Male householders: 6,522 (2,080 living alone ), Female householders: 8,249 (2,992 living alone )5,182 spouses (5,146 opposite-sex spouses ), 1,590 unmarried partners , (1,536 opposite-sex unmarried partners ), 9,038 children (8,024 natural , 450 adopted , 562 stepchildren ), 858 grandchildren , 260 brothers or sisters , 260 parents , 0 foster children , 491 other relatives , 788 non-relatives In group quarters: 2,268
Size of family households: 4,102 2-persons , 2,205 3-persons , 1,581 4-persons , 480 5-persons , 244 6-persons , 78 7-or-more-persons .
Size of nonfamily households: 4,958 1-person , 1,153 2-persons , 154 3-persons , 60 4-persons .
3,472 married couples with children. single-parent households (522 men , 2,546 women ).
93.4% of residents of Richmond speak English at home. of residents speak Spanish at home (36% speak English very well , 26% speak English well , 28% speak English not well , 11% don't speak English at all ).of residents speak other Indo-European language at home (93% speak English very well , 7% speak English not well ).of residents speak Asian or Pacific Island language at home (56% speak English very well , 25% speak English well , 5% speak English not well , 14% don't speak English at all ).of residents speak other language at home (57% speak English very well , 43% speak English not well ).
Foreign born population: 1,392 (3.9%)of them are naturalized citizens )
Median number of rooms in houses and condos:
Median number of rooms in apartments
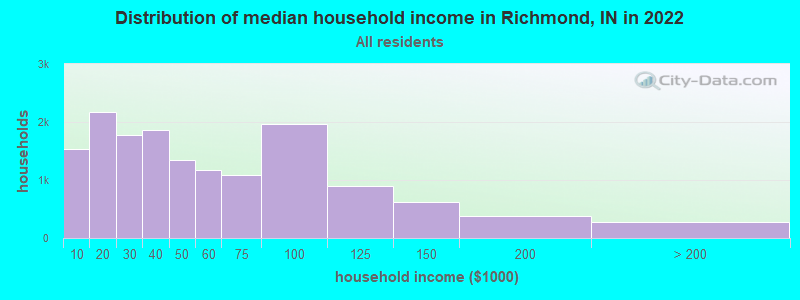
Richmond, IN household income distribution 1,537 Less than $10,0002,172 $10,000 to $19,9991,768 $20,000 to $29,9991,868 $30,000 to $39,9991,343 $40,000 to $49,9991,164 $50,000 to $59,9991,086 $60,000 to $74,9991,969 $75,000 to $99,999901 $100,000 to $124,999627 $125,000 to $149,999371 $150,000 to $199,999277 $200,000 or more
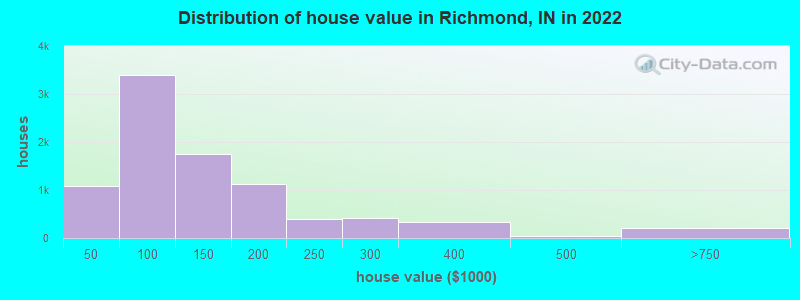
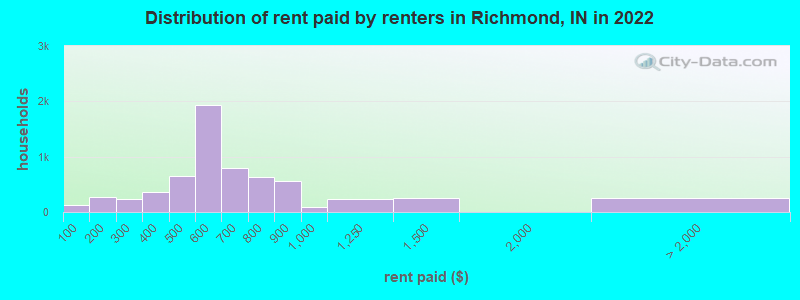
Home value of owner - occupied houses in 2022 in Richmond, IN 40 Less than $10,000151 $10,000 to $14,99973 $15,000 to $19,999174 $20,000 to $24,999146 $25,000 to $29,999278 $30,000 to $34,99945 $35,000 to $39,999178 $40,000 to $49,999495 $50,000 to $59,999822 $60,000 to $69,999845 $70,000 to $79,999555 $80,000 to $89,999507 $90,000 to $99,9991,005 $100,000 to $124,999751 $125,000 to $149,999543 $150,000 to $174,999584 $175,000 to $199,999405 $200,000 to $249,999426 $250,000 to $299,999323 $300,000 to $399,99949 $400,000 to $499,999184 $500,000 to $749,99926 $1,000,000 to $1,499,999Rent paid by renters in 2022 in Richmond, IN 126 Less than $100102 $100 to $149160 $150 to $19943 $200 to $249186 $250 to $299146 $300 to $349217 $350 to $399293 $400 to $449360 $450 to $4991,096 $500 to $549831 $550 to $599428 $600 to $649362 $650 to $699368 $700 to $749256 $750 to $799557 $800 to $89989 $900 to $999228 $1,000 to $1,249251 $1,250 to $1,49940 $2,000 to $2,499208 No cash rent
Percentage of workers working in this county: 93.3%Number of people working at home: 808 (5.2% of all workers )
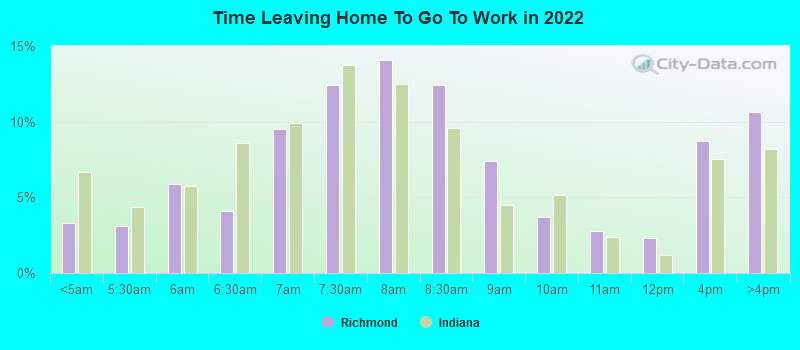
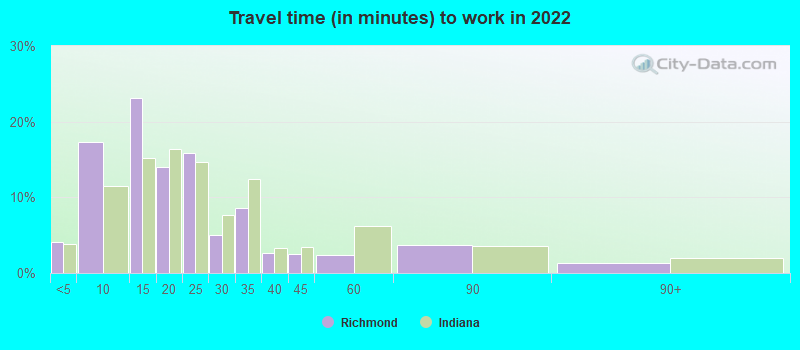
Travel time to work (commute)
Less than 5 minutes: 9345 to 9 minutes: 3,08210 to 14 minutes: 3,66115 to 19 minutes: 2,11120 to 24 minutes: 1,20125 to 29 minutes: 40630 to 34 minutes: 62935 to 39 minutes: 35840 to 44 minutes: 11045 to 59 minutes: 36560 to 89 minutes: 33590 or more minutes: 101
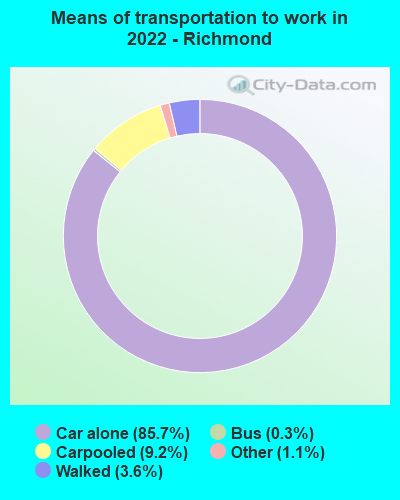
Means of transportation to work:
Drove a car alone: 19,651 (80.4%)Carpooled: 2,334 (9.5%)Bus : 63 (0.3%)Taxi: 310 (1.3%)Walked: 830 (3.4%)Worked at home: 808 (3.3%)
Unemployment by race in 2022
Unemployment rate for White non-Hispanic residents 3.8% Males8.1% FemalesUnemployment rate for Black residents 17.7% Males8.6% FemalesUnemployment rate for American Indian and Alaska Native residents 18.9% MalesUnemployment rate for Asian residents 3.4% Males12.7% FemalesUnemployment rate for two or more race residents 5.7% MalesUnemployment rate for Hispanic or Latino residents 4.5% Males
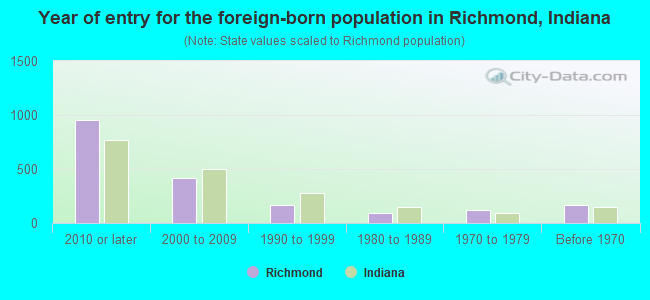
Year of entry for the foreign-born population in Richmond, Indiana
958 2010 or later 421 2000 to 2009 171 1990 to 1999 94 1980 to 1989 122 1970 to 1979 169 Before 1970
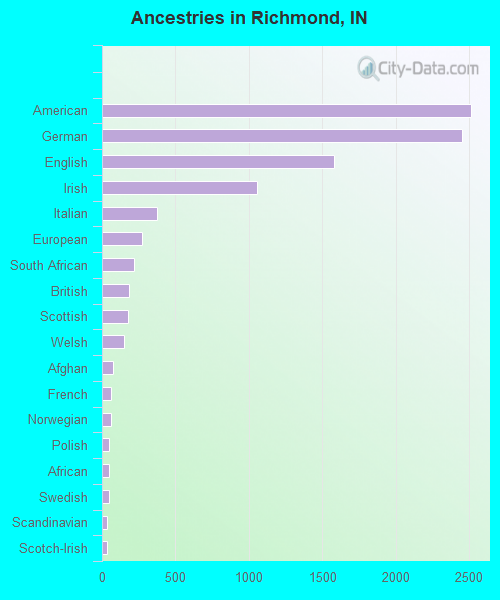
First ancestries reported:
American: 2,511 (17.2%)
German: 2,451 (16.7%)
English: 1,580 (10.8%)
Irish: 1,054 (7.2%)
Italian: 376 (2.6%)
European: 271 (1.9%)
South African: 217 (1.5%)
British: 186 (1.3%)
Scottish: 176 (1.2%)
Welsh: 153 (1.0%)
Afghan: 75 (0.5%)
French: 63 (0.4%)
Norwegian: 59 (0.4%)
Polish: 49 (0.3%)
African: 46 (0.3%)
Swedish: 45 (0.3%)
Scandinavian: 34 (0.2%)
Scotch-Irish: 32 (0.2%)
Russian: 15 (0.1%)
French Canadian: 14 (0.10%)
Pennsylvania German: 13 (0.09%)
Zimbabwean: 12 (0.08%)
Greek: 12 (0.08%)
Jamaican: 12 (0.08%)
Eastern European: 12 (0.08%)
Canadian: 11 (0.08%)
Dutch: 11 (0.08%)
Belgian: 10 (0.07%)
Northern European: 9 (0.06%)
Croatian: 8 (0.05%)
Czechoslovakian: 5 (0.03%)
Hungarian: 5 (0.03%)
Czech: 4 (0.03%) Most common places of birth for foreign-born residents (%): Mexico Richmond:
39.4% (659)Indiana:
27.0% (101,996)
Canada Richmond:
9.3% (155)Indiana:
2.1% (7,834)
China, excluding Hong Kong and Taiwan Richmond:
8.4% (140)Indiana:
5.3% (19,877)
Guatemala Richmond:
6.8% (114)Indiana:
2.3% (8,656)
Afghanistan Richmond:
2.9% (49)Indiana:
0.2% (589)
South Africa Richmond:
2.4% (40)Indiana:
0.4% (1,540)
Colombia Richmond:
2.2% (37)Indiana:
0.8% (3,114)
Singapore Richmond:
2.0% (33)Indiana:
0.1% (412)
Democratic Republic of Congo (Zaire) Richmond:
2.0% (33)Indiana:
0.3% (1,221)
Taiwan Richmond:
1.6% (27)Indiana:
0.6% (2,272)
Japan Richmond:
1.6% (27)Indiana:
1.2% (4,520)
Germany Richmond:
1.6% (26)Indiana:
1.7% (6,439)
Place of birth for U.S.-born residents:
This state: 24,264Other state: 9,384Northeast: 986Midwest: 4,400South: 2,560West: 1,379 83.9% of Richmond residents lived in the same house 1 years ago.
Out of people who lived in different houses, 41.9% lived in this county.
Out of people who lived in different counties, 34.5% lived in Indiana.
Richmond:
83.9%State average:
87.1%
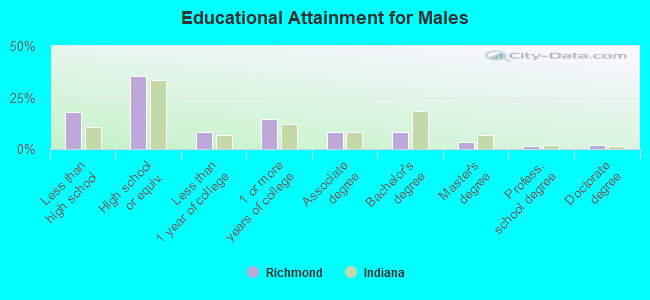
Education attainment for males 25 years and older:
No schooling: 176Nursery to 4th grade: 05th and 6th grade: 1567th and 8th grade: 3609th grade: 4810th grade: 61111th grade: 20412th grade, no diploma: 433High school graduate (or equivalency): 3,926Less than 1 year of college: 934Some college more than 1 year, no degree: 1,580Associate degree: 912Bachelor's degree: 919Master's degree: 388Professional school degree: 155Doctorate degree: 210
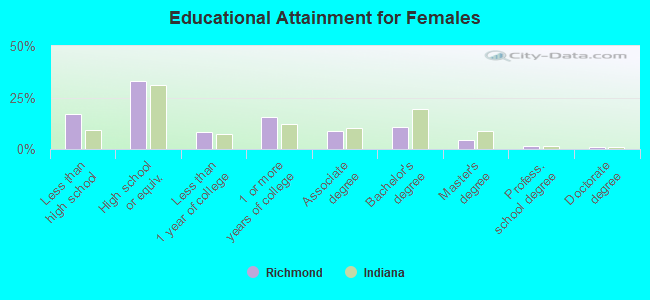
Education attainment for females 25 years and older:
No schooling: 220Nursery to 4th grade: 45th and 6th grade: 587th and 8th grade: 3139th grade: 30010th grade: 48011th grade: 32412th grade, no diploma: 471High school graduate (or equivalency): 4,227Less than 1 year of college: 1,051Some college more than 1 year, no degree: 1,988Associate degree: 1,093Bachelor's degree: 1,384Master's degree: 547Professional school degree: 176Doctorate degree: 104
Housing units in structures:
One, detached: 12,168One, attached: 552Two: 7963 or 4: 1,1995 to 9: 53010 to 19: 52420 to 49: 30250 or more: 860Mobile homes: 389Median worth of mobile homes: $24,085
Housing units lacking complete plumbing facilities in 2022: 3.5%Housing units lacking complete kitchen facilities in 2022: 8.2%House/condo owner moved in on average 10 years ago
Renter moved in on average 3 years ago
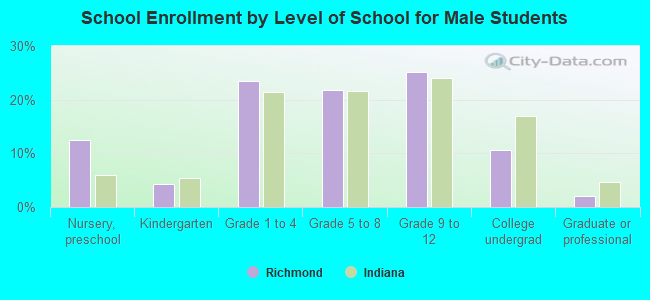
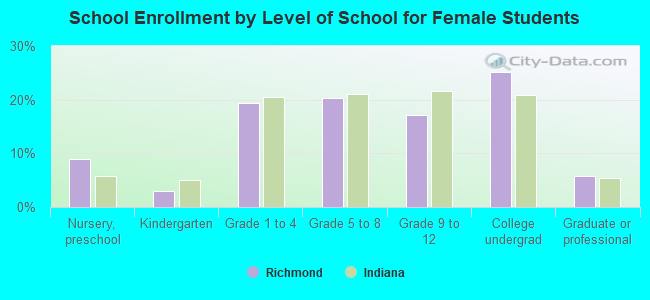
Private vs. public school enrollment:
Students in private schools in grades 1 to 8 (elementary and middle school): 467 Students in private schools in grades 9 to 12 (high school): 75 Students in private undergraduate colleges: 765