Roaring Spring, PA (Pennsylvania) Houses and Residents
| Roaring Spring: | $143,984 |
| Pennsylvania: | $245,500 |
Mean price in 2022:
Detached houses: $172,725
Here: $172,725 State: $317,202 Townhouses or other attached units: $150,477
Here: $150,477 State: $254,369 Mobile homes: $100,630
Here: $100,630 State: $92,414
Total population: 2,549 (Urban population: 2,418 (all inside urban clusters), Rural population: 0)
Houses: 1,127 (1,012 occupied: 805 owner occupied, 238 renter occupied)
| % of renters here: | 23% |
| State: | 31% |
Housing density: 1,408 houses/condos per square mile
Median price asked for vacant for-sale houses and condos in 2022 in this county: $137,270.
Median contract rent in 2022: $644 (lower quartile is $290, upper quartile is $713)
Median rent asked for vacant for-rent units in 2022: $475
Median gross rent in Roaring Spring, PA in 2022: $743
Housing units in Roaring Spring with a mortgage: 476 (49 second mortgage, 0 home equity loan, 50 both second mortgage and home equity loan)
Houses without a mortgage: 20
Median household income for houses/condos with a mortgage: $84,455
Median household income for apartments without a mortgage: $60,199
Median monthly housing costs: $817
Compare current foreclosures near Roaring Spring, PA:
| Photo | Address | Area | Beds / Baths | Price | Details |
|---|---|---|---|---|---|

|
#1
Lafayette Rd
Roaring Spring, PA 16673
|
- sq. feet
|
- baths - beds |
show details | |

|
#2
E Main St
Roaring Spring, PA 16673
|
- sq. feet
|
- baths - beds |
show details | |

|
#3
Old Mill Run Rd
Altoona, PA 16601
|
1,408 sq. feet
|
1 baths 2 beds |
$151,900
|
show details |

|
#4
Avalon Rd
Altoona, PA 16601
|
1,962 sq. feet
|
2 baths 3 beds |
$42,500
|
show details |

|
#5
Vicars Ln
Altoona, PA 16601
|
3,019 sq. feet
|
2 baths 4 beds |
$549,900
|
show details |

|
#6
Poplar St
Roaring Spring, PA 16673
|
- sq. feet
|
- baths - beds |
show details | |

|
#7
Franklin St
Hollidaysburg, PA 16648
|
- sq. feet
|
1 baths 3 beds |
$63,900
|
show details |

|
#8
Enid Mountain Rd
Six Mile Run, PA 16679
|
- sq. feet
|
1 baths 3 beds |
$42,500
|
show details |

|
#9
S Imler Valley Rd
Imler, PA 16655
|
- sq. feet
|
1 baths 3 beds |
show details | |

|
#10
N 2nd St
Altoona, PA 16601
|
- sq. feet
|
2 baths 4 beds |
show details |
| Photo | Address | Area | Beds / Baths | Price | Details |
|---|---|---|---|---|---|

|
#11
Marson Ln
Duncansville, PA 16635
|
2,050 sq. feet
|
2 baths 2 beds |
show details | |

|
#12
11 16th Avenue
Altoona, PA 16601
|
- sq. feet
|
- baths - beds |
$39,900
|
show details |

|
#13
Lower Reese Rd
Hollidaysburg, PA 16648
|
1,608 sq. feet
|
1 baths 3 beds |
show details | |

|
#14
11th St
Altoona, PA 16601
|
1,995 sq. feet
|
2 baths 3 beds |
show details | |

|
#15
Foster St
Gallitzin, PA 16641
|
2 sq. feet
|
2 baths 4 beds |
show details | |

|
#16
Bell Ave
Altoona, PA 16602
|
1,816 sq. feet
|
1 baths 3 beds |
show details | |

|
#17
Cross Roads Ln
Martinsburg, PA 16662
|
1,728 sq. feet
|
2 baths 3 beds |
show details | |

|
#18
Pershing St
Gallitzin, PA 16641
|
1,306 sq. feet
|
1 baths 3 beds |
show details | |

|
#19
Walnut Ave
Altoona, PA 16601
|
- sq. feet
|
1 baths 3 beds |
show details | |

|
#20
3rd Ave
Altoona, PA 16602
|
- sq. feet
|
- baths - beds |
$14,900
|
show details |
| Photo | Address | Area | Beds / Baths | Price | Details |
|---|---|---|---|---|---|

|
#21
Broad Ave
Altoona, PA 16601
|
- sq. feet
|
2 baths 5 beds |
show details | |

|
#22
2nd Ave
Altoona, PA 16602
|
1,330 sq. feet
|
1 baths 4 beds |
show details | |

|
#23
Blue Bird Ln
Portage, PA 15946
|
- sq. feet
|
- baths - beds |
$19,900
|
show details |

|
#24
Broad St
Broad Top, PA 16621
|
- sq. feet
|
1 baths 3 beds |
show details | |

|
#25
Baynton Ave
Altoona, PA 16602
|
- sq. feet
|
2 baths 3 beds |
show details | |

|
#26
18th Ave
Altoona, PA 16601
|
- sq. feet
|
1 baths 3 beds |
show details | |

|
#27
4th Ave
Duncansville, PA 16635
|
2,264 sq. feet
|
1 baths 3 beds |
show details | |

|
#28
Pine St
Cassandra, PA 15925
|
- sq. feet
|
1 baths 4 beds |
show details | |

|
#29
N 6th Ave
Altoona, PA 16601
|
- sq. feet
|
1 baths 2 beds |
show details | |

|
#30
N 12th Ave
Altoona, PA 16601
|
- sq. feet
|
1 baths 4 beds |
show details |
| Photo | Address | Area | Beds / Baths | Price | Details |
|---|---|---|---|---|---|

|
#31
22nd Ave
Altoona, PA 16601
|
- sq. feet
|
2 baths 4 beds |
show details | |

|
#32
11th Ave
Altoona, PA 16601
|
- sq. feet
|
1 baths 3 beds |
show details | |

|
#33
Deer Path Dr
Huntingdon, PA 16652
|
- sq. feet
|
- baths - beds |
show details | |

|
#34
Chicory Ln
Duncansville, PA 16635
|
- sq. feet
|
- baths - beds |
show details | |

|
#35
Metzgar Ln # 2
Claysburg, PA 16625
|
- sq. feet
|
- baths - beds |
show details | |

|
#36
1st Street
Portage, PA 15946
|
- sq. feet
|
- baths - beds |
show details | |

|
#37
E Caroline Ave
Altoona, PA 16602
|
- sq. feet
|
- baths - beds |
show details | |

|
#38
Sugar St
Gallitzin, PA 16641
|
- sq. feet
|
- baths - beds |
show details | |

|
#39
Midland Ave
Cresson, PA 16630
|
- sq. feet
|
- baths - beds |
show details | |

|
#40
Grant St
Gallitzin, PA 16641
|
- sq. feet
|
- baths - beds |
show details |
| Photo | Address | Area | Beds / Baths | Price | Details |
|---|---|---|---|---|---|

|
#41
Country Manor Dr Apt 509
Duncansville, PA 16635
|
- sq. feet
|
- baths - beds |
show details | |

|
#42
Kaufman Hollow Rd
Bedford, PA 15522
|
- sq. feet
|
- baths - beds |
show details | |

|
#43
Main St
Woodbury, PA 16695
|
- sq. feet
|
- baths - beds |
show details | |

|
#44
Graybill Rd
Osterburg, PA 16667
|
1,120 sq. feet
|
- baths - beds |
show details | |

|
#45
Orchard Dr
Duncansville, PA 16635
|
- sq. feet
|
- baths - beds |
show details | |

|
#46
France St
Sproul, PA 16682
|
- sq. feet
|
- baths - beds |
show details | |

|
#47
Broadway
Altoona, PA 16601
|
- sq. feet
|
- baths - beds |
show details | |

|
#48
E Walton Ave Apt 304
Altoona, PA 16602
|
- sq. feet
|
- baths - beds |
show details | |

|
#49
E Caroline Ave Apt 14
Altoona, PA 16602
|
- sq. feet
|
- baths - beds |
show details | |

|
Check over 1 million property listings on Foreclosure.com!
|
browse all offers | |||


Median year apartment built: 1954
Household type by relationship:
Households: 2,479- Male householders: 381 (85 living alone), Female householders: 615 (158 living alone)
464 spouses (464 opposite-sex spouses), 42 unmarried partners, (42 opposite-sex unmarried partners), 842 children (786 natural, 37 adopted, 18 stepchildren), 8 grandchildren, 20 brothers or sisters, 44 parents, 0 foster children, 48 other relatives, 3 non-relatives
- In group quarters: 4
Size of family households: 388 2-persons, 155 3-persons, 102 4-persons, 81 5-persons, 13 6-persons, 3 7-or-more-persons.
Size of nonfamily households: 266 1-person, 31 2-persons.
326 married couples with children.
168 single-parent households (17 men, 151 women).
96.4% of residents of Roaring Spring speak English at home.
1.0% of residents speak Spanish at home (30% speak English well, 70% speak English not well).
1.3% of residents speak other Indo-European language at home (100% speak English very well).
0.5% of residents speak Asian or Pacific Island language at home (45% speak English very well, 9% speak English well, 45% speak English not well).
Foreign born population: 17 (0.7%)
(82.4% of them are naturalized citizens)
| Here: | 6.6 |
| State: | 6.8 |
| Here: | 5.0 |
| State: | 4.3 |

- Bedrooms in owner-occupied houses and condos in Roaring Spring, Pennsylvania
- 3no bedroom
- 151 bedroom
- 2082 bedrooms
- 3883 bedrooms
- 1604 bedrooms
- 315+ bedrooms

- Bedrooms in renter-occupied apartments in Roaring Spring, Pennsylvania
- 0no bedroom
- 411 bedroom
- 722 bedrooms
- 1163 bedrooms
- 54 bedrooms
- 45+ bedrooms

- Cars and other vehicles available in Roaring Spring in owner-occupied houses/condos
- 23no vehicle
- 2221 vehicle
- 3612 vehicles
- 1633 vehicles
- 244 vehicles
- 135+ vehicles

- Cars and other vehicles available in Roaring Spring in renter-occupied apartments
- 19no vehicle
- 1641 vehicle
- 562 vehicles
- 03 vehicles
- 04 vehicles
- 05+ vehicles

- Rooms in owner-occupied houses in Roaring Spring, Pennsylvania
- 31 room
- 92 rooms
- 03 rooms
- 54 rooms
- 795 rooms
- 2996 rooms
- 1607 rooms
- 1248 rooms
- 1279+ rooms

- Rooms in renter-occupied apartments in Roaring Spring, Pennsylvania
- 01 room
- 02 rooms
- 193 rooms
- 604 rooms
- 935 rooms
- 426 rooms
- 107 rooms
- 98 rooms
- 59+ rooms


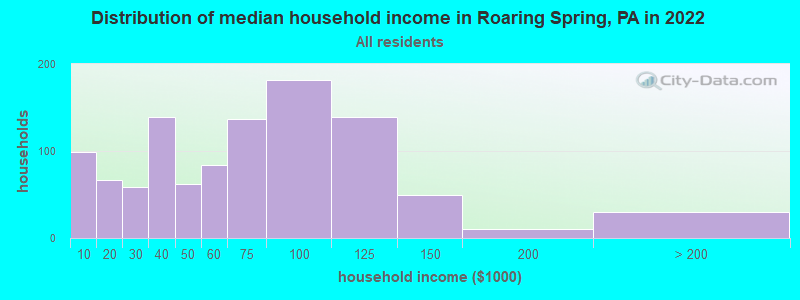
Roaring Spring, PA household income distribution

- 99Less than $10,000
- 67$10,000 to $19,999
- 59$20,000 to $29,999
- 139$30,000 to $39,999
- 62$40,000 to $49,999
- 84$50,000 to $59,999
- 137$60,000 to $74,999
- 182$75,000 to $99,999
- 139$100,000 to $124,999
- 50$125,000 to $149,999
- 10$150,000 to $199,999
- 30$200,000 or more
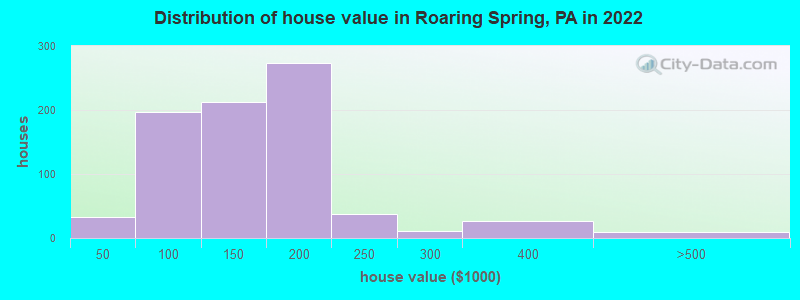
Home value of owner - occupied houses in 2022 in Roaring Spring, PA
-
- 2Less than $10,000
- 14$10,000 to $14,999
- 2$20,000 to $24,999
- 11$25,000 to $29,999
- 2$40,000 to $49,999
- 3$50,000 to $59,999
- 78$60,000 to $69,999
- 17$70,000 to $79,999
- 55$80,000 to $89,999
- 39$90,000 to $99,999
- 117$100,000 to $124,999
- 95$125,000 to $149,999
- 207$150,000 to $174,999
- 65$175,000 to $199,999
- 38$200,000 to $249,999
- 10$250,000 to $299,999
- 26$300,000 to $399,999
- 4$400,000 to $499,999
- 3$500,000 to $749,999
- 0$2,000,000 or more
Rent paid by renters in 2022 in Roaring Spring, PA
-
- 20Less than $100
- 23$150 to $199
- 11$200 to $249
- 3$250 to $299
- 4$300 to $349
- 13$400 to $449
- 34$450 to $499
- 8$500 to $549
- 5$600 to $649
- 44$650 to $699
- 33$700 to $749
- 51$750 to $799
- 9$1,000 to $1,249
- 13No cash rent


Percentage of workers working in this county: 75.3%
Number of people working at home: 87 (6.6% of all workers)
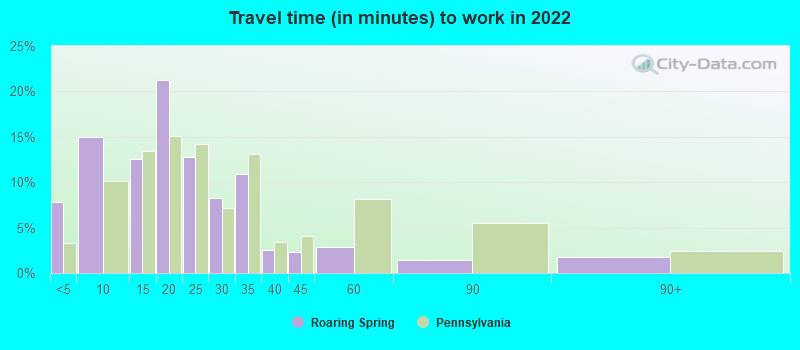
Travel time to work (commute)
- Less than 5 minutes: 57
- 5 to 9 minutes: 198
- 10 to 14 minutes: 95
- 15 to 19 minutes: 217
- 20 to 24 minutes: 134
- 25 to 29 minutes: 60
- 30 to 34 minutes: 143
- 35 to 39 minutes: 7
- 40 to 44 minutes: 17
- 45 to 59 minutes: 187
- 60 to 89 minutes: 9
- 90 or more minutes: 117
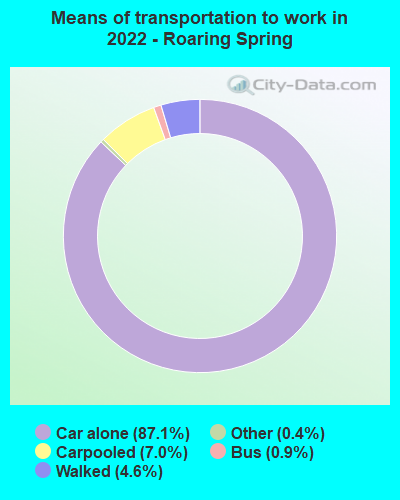
Means of transportation to work:
- Drove a car alone: 1,055 (79.9%)
- Carpooled: 85 (6.4%)
- Bus: 8 (0.6%)
- Taxi: 5 (0.4%)
- Walked: 56 (4.2%)
- Worked at home: 87 (6.6%)

- Unemployment by race in 2022
- Unemployment rate for White non-Hispanic residents
- 2.2%Males
- 4.5%Females
- Unemployment rate for two or more race residents
- 53.6%Males
- Unemployment rate for Hispanic or Latino residents
- 66.0%Males

- Year of entry for the foreign-born population in Roaring Spring, Pennsylvania
- 82010 or later
- 112000 to 2009
- 61990 to 1999
- 101980 to 1989
- 01970 to 1979
- 9Before 1970
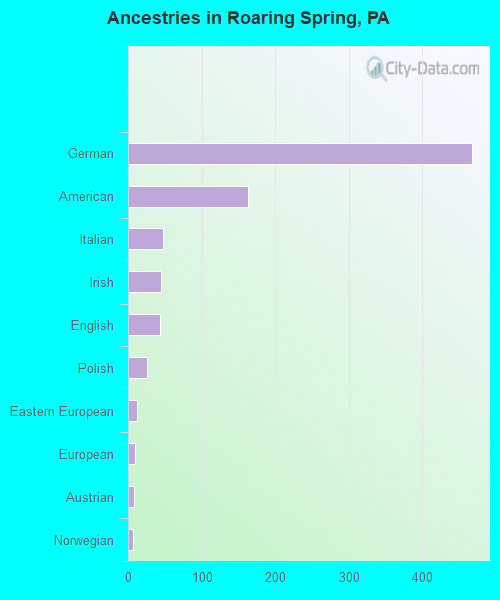
First ancestries reported:
- German: 467 (47.5%)
- American: 163 (16.6%)
- Italian: 48 (4.9%)
- Irish: 45 (4.6%)
- English: 43 (4.4%)
- Polish: 26 (2.6%)
- Eastern European: 12 (1.2%)
- European: 10 (1.0%)
- Austrian: 8 (0.8%)
- Norwegian: 7 (0.7%)
- Welsh: 4 (0.4%)
- Scotch-Irish: 3 (0.3%)
- British: 2 (0.2%)
- Pennsylvania German: 2 (0.2%)
Most common places of birth for foreign-born residents (%):
| Roaring Spring: | 87.5% (21) |
| Pennsylvania: | 1.1% (10,035) |
| Roaring Spring: | 29.2% (7) |
| Pennsylvania: | 0.1% (699) |
| Roaring Spring: | 25.0% (6) |
| Pennsylvania: | 2.2% (21,039) |
Place of birth for U.S.-born residents:
- This state: 2,320
- Other state: 148
- Northeast: 53
- Midwest: 0
- South: 119
- West: 0
94.5% of Roaring Spring residents lived in the same house 1 years ago.
Out of people who lived in different houses, 42.1% lived in this county.
Out of people who lived in different counties, 100.0% lived in Pennsylvania.
| Roaring Spring: | 94.5% |
| State average: | 89.3% |
Education attainment for males 25 years and older:
- No schooling: 4
- Nursery to 4th grade: 0
- 5th and 6th grade: 0
- 7th and 8th grade: 13
- 9th grade: 0
- 10th grade: 5
- 11th grade: 4
- 12th grade, no diploma: 0
- High school graduate (or equivalency): 331
- Less than 1 year of college: 272
- Some college more than 1 year, no degree: 66
- Associate degree: 62
- Bachelor's degree: 85
- Master's degree: 22
- Professional school degree: 8
- Doctorate degree: 0

Education attainment for females 25 years and older:
- No schooling: 2
- Nursery to 4th grade: 0
- 5th and 6th grade: 0
- 7th and 8th grade: 0
- 9th grade: 0
- 10th grade: 0
- 11th grade: 48
- 12th grade, no diploma: 4
- High school graduate (or equivalency): 324
- Less than 1 year of college: 150
- Some college more than 1 year, no degree: 80
- Associate degree: 140
- Bachelor's degree: 119
- Master's degree: 16
- Professional school degree: 63
- Doctorate degree: 0


Housing units in structures:
- One, detached: 873
- One, attached: 75
- Two: 59
- 3 or 4: 34
- 5 to 9: 25
- 10 to 19: 45
- Mobile homes: 15
Housing units lacking complete kitchen facilities in 2022: 4.4%
House/condo owner moved in on average 15 years ago
Renter moved in on average 2 years ago

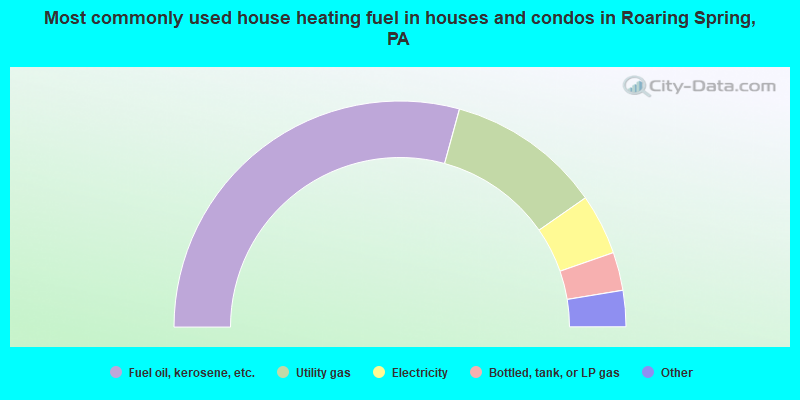
- 58.6%Fuel oil, kerosene, etc.
- 22.2%Utility gas
- 8.7%Electricity
- 5.5%Bottled, tank, or LP gas
- 3.1%Coal or coke
- 1.9%Wood
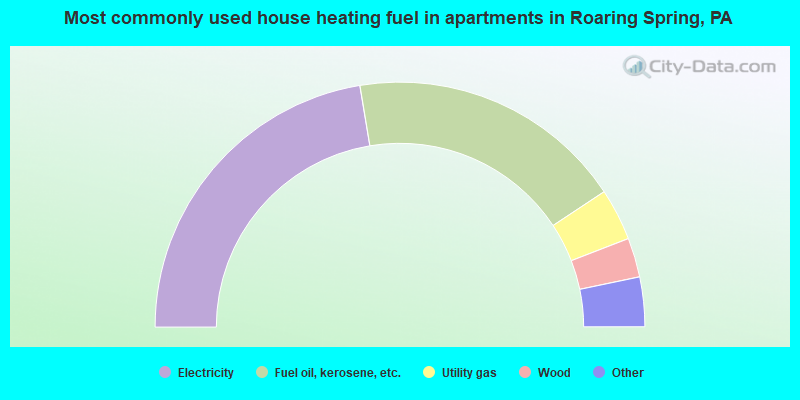
- 45.0%Electricity
- 36.8%Fuel oil, kerosene, etc.
- 6.9%Utility gas
- 5.2%Wood
- 2.6%Bottled, tank, or LP gas
- 2.2%Other fuel
- 1.3%No fuel used
Private vs. public school enrollment:
| Here: | 6.4% |
| Pennsylvania: | 15.7% |
| Here: | 9.3% |
| Pennsylvania: | 13.4% |
| Here: | 0.0% |
| Pennsylvania: | 39.8% |


