Rome, NY (New York) Houses and Residents
Estimated median house or condo value in 2022: $133,063 (it was $64,800 in 2000 )
Rome:
$133,063New York:
$400,400
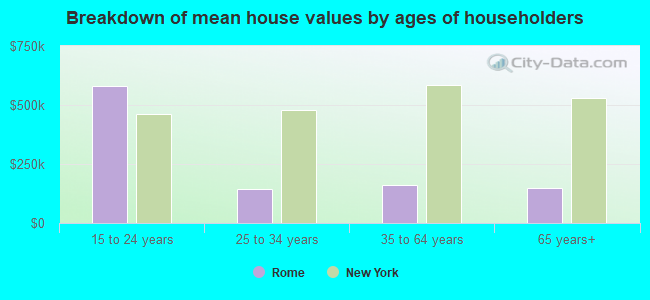
Lower value quartile - upper value quartile: $90,089 - $210,294Mean price in 2022: Detached houses: $166,036 Here:
$166,036State:
$476,719
Townhouses or other attached units: $170,271 Here:
$170,271State:
$699,270
In 2-unit structures: $95,869 Here:
$95,869State:
$713,077
In 3-to-4-unit structures: $202,544 Here:
$202,544State:
$764,568
In 5-or-more-unit structures: $593,349 Here:
$593,349State:
$912,009
Mobile homes: $30,598 Here:
$30,598State:
$88,925
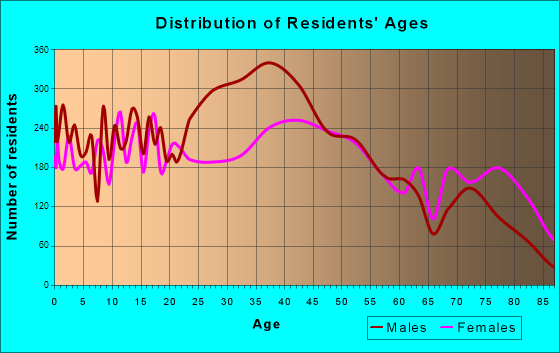
Total population: 32,645 (Urban population: 30,604 (all inside urban clusters), Rural population: 4,318 (17 farm, 4,301 nonfarm ))
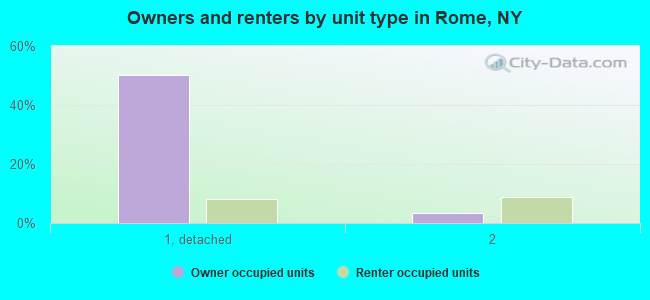
Houses: 15,451 (13,789 occupied: 8,212 owner occupied, 6,299 renter occupied )
% of renters here:
43%State:
46%
Housing density: 206 houses/condos per square mile
Median price asked for vacant for-sale houses and condos in 2022: $193,269.
Median contract rent in 2022: $734 (lower quartile is $548, upper quartile is $914)
Median rent asked for vacant for-rent units in 2022: $388
Median gross rent in Rome, NY in 2022: $876
Housing units in Rome with a mortgage: 4,024 (424 second mortgage, 0 home equity loan, 407 both second mortgage and home equity loan )Houses without a mortgage: 251
Median household income for houses/condos with a mortgage: $90,770
Median household income for apartments without a mortgage: $56,041
Median monthly housing costs: $879
Data:
Median house or condo value ($)
Median house or condo value ($ change since 2000)
Median house or condo value ($) - White
Median house or condo value ($) - Black or African American
Median house or condo value ($) - Asian
Median house or condo value ($) - Hispanic or Latino
Median house or condo value ($) - American Indian and Alaska Native
Median house or condo value ($) - Multirace
Median house or condo value ($) - Other Race
Median price asked for mobile homes ($)
Household density (households per square mile)
Mean house or condo value by units in structure - 1, detached ($)
Mean house or condo value by units in structure - 1, attached ($)
Mean house or condo value by units in structure - 2 ($)
Mean house or condo value by units in structure by units in structure - 3 or 4 ($)
Mean house or condo value by units in structure - 5 or more ($)
Mean house or condo value by units in structure - Boat, RV, van, etc. ($)
Mean house or condo value by units in structure - Mobile home ($)
Median contract rent ($)
Median contract rent - Lower quartile ($)
Median contract rent - Upper quartile ($)
Median gross rent ($)
Urban houses (%)
Rural houses (%)
Houses occupied (%)
Houses occupied (% change since 2000)
Houses owner occupied (%)
Houses owner occupied (% change since 2000)
Houses renter occupied (%)
Houses renter occupied (% change since 2000)
Vacant housing units - For rent (%)
Vacant housing units - For rent (% change since 2000)
Vacant housing units - For sale only (%)
Vacant housing units - For sale only (% change since 2000)
Vacant housing units - Rented or sold, not occupied (%)
Vacant housing units - Rented or sold, not occupied (% change since 2000)
Vacant housing units - For seasonal, recreational, or occasional use (%)
Vacant housing units - For seasonal, recreational, or occasional use (% change since 2000)
Vacant housing units - For migrant workers (%)
Vacant housing units - For migrant workers (% change since 2000)
Vacant housing units - Other vacant (%)
Vacant housing units - Other vacant (% change since 2000)
Median monthly housing costs ($)
Median household income for houses/condos with a mortgage ($)
Median household income for houses/condos without a mortgage ($)
Median household income ($)
Median household income ($) - White
Median household income ($) - Black or African American
Median household income ($) - Asian
Median household income ($) - Hispanic or Latino
Median household income ($) - American Indian and Alaska Native
Median household income ($) - Multirace
Median household income ($) - Other Race
Mortgage status - with mortgage (%)
Mortgage status - with second mortgage (%)
Mortgage status - with home equity loan (%)
Mortgage status - with both second mortgage and home equity loan (%)
Mortgage status - without a mortgage (%)
Median year house/condo built
Median year apartment built
Household type by relationship - Male householder living alone (%)
Household type by relationship - Male householder not living alone (%)
Household type by relationship - Female householder living alone (%)
Household type by relationship - Female householder not living alone (%)
Household type by relationship - Opposite-Sex spouse (%)
Household type by relationship - Same-Sex spouse (%)
Household type by relationship - Opposite-Sex unmarried partner (%)
Household type by relationship - Same-Sex unmarried partner (%)
Household type by relationship - In group quarters (%)
Size of family households - 2-person household (%)
Size of family households - 3-person household (%)
Size of family households - 4-person household (%)
Size of family households - 5-person household (%)
Size of family households - 6-person household (%)
Size of family households - 7-or-more-person household (%)
Size of nonfamily households - 1-person household (%)
Size of nonfamily households - 2-person household (%)
Size of nonfamily households - 3-person household (%)
Size of nonfamily households - 4-person household (%)
Size of nonfamily households - 5-person household (%)
Size of nonfamily households - 6-person household (%)
Size of nonfamily households - 7-or-moreperson household (%)
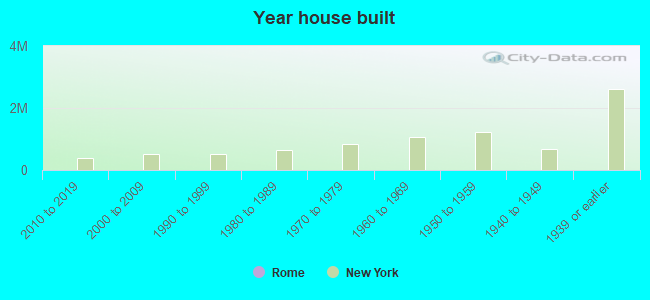
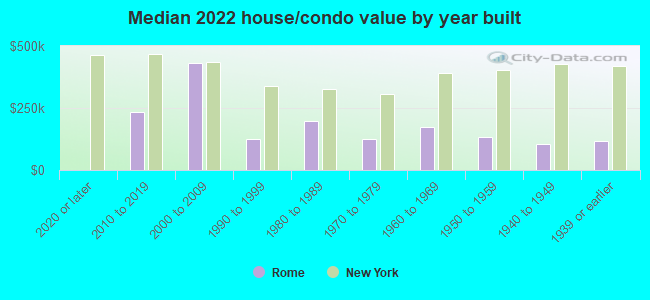
Year house built - Built 2010 or later (%)
Year house built - Built 2000 to 2009 (%)
Year house built - Built 1990 to 1999 (%)
Year house built - Built 1980 to 1989 (%)
Year house built - Built 1970 to 1979 (%)
Year house built - Built 1960 to 1969 (%)
Year house built - Built 1950 to 1959 (%)
Year house built - Built 1940 to 1949 (%)
Year house built - Built 1939 or earlier (%)
Median number of rooms in houses and condos
Median number of rooms in apartments
Median number of bedrooms in owner occupied houses
Mean number of bedrooms in owner occupied houses
Median number of bedrooms in renter occupied houses
Mean number of bedrooms in renter occupied houses
Median number of vehichles in owner occupied houses
Mean number of vehichles in owner occupied houses
Median number of vehichles in renter occupied houses
Mean number of vehichles in renter occupied houses
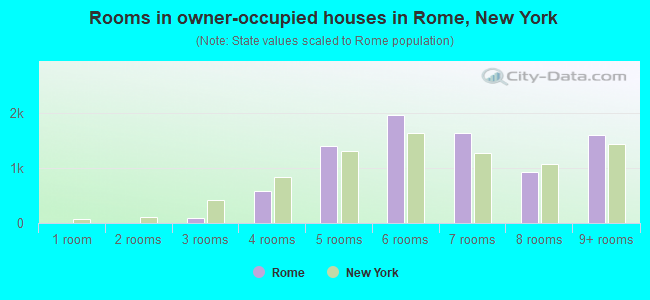
Rooms in owner-occupied houses - 1 room (%)
Rooms in owner-occupied houses - 2 rooms (%)
Rooms in owner-occupied houses - 3 rooms (%)
Rooms in owner-occupied houses - 4 rooms (%)
Rooms in owner-occupied houses - 5 rooms (%)
Rooms in owner-occupied houses - 6 rooms (%)
Rooms in owner-occupied houses - 7 rooms (%)
Rooms in owner-occupied houses - 8 rooms (%)
Rooms in owner-occupied houses - 9+ rooms (%)
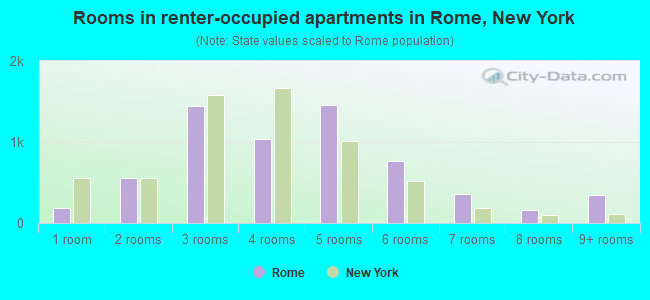
Rooms in renter-occupied houses - 1 room (%)
Rooms in renter-occupied houses - 2 rooms (%)
Rooms in renter-occupied houses - 3 rooms (%)
Rooms in renter-occupied houses - 4 rooms (%)
Rooms in renter-occupied houses - 5 rooms (%)
Rooms in renter-occupied houses - 6 rooms (%)
Rooms in renter-occupied houses - 7 rooms (%)
Rooms in renter-occupied houses - 8 rooms (%)
Rooms in renter-occupied houses - 9+ rooms (%)
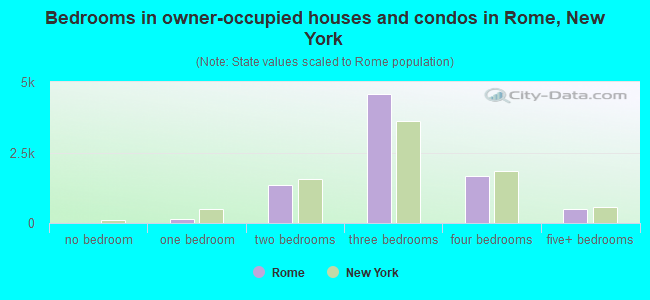
Bedrooms in owner-occupied houses - no bedrooms (%)
Bedrooms in owner-occupied houses - 1 bedroom (%)
Bedrooms in owner-occupied houses - 2 bedrooms (%)
Bedrooms in owner-occupied houses - 3 bedrooms (%)
Bedrooms in owner-occupied houses - 4 bedrooms (%)
Bedrooms in owner-occupied houses - 5+ bedrooms (%)
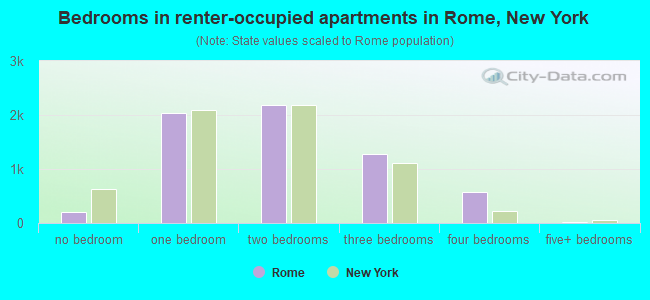
Bedrooms in renter-occupied houses - no bedrooms (%)
Bedrooms in renter-occupied houses - 1 bedroom (%)
Bedrooms in renter-occupied houses - 2 bedrooms (%)
Bedrooms in renter-occupied houses - 3 bedrooms (%)
Bedrooms in renter-occupied houses - 4 bedrooms (%)
Bedrooms in renter-occupied houses - 5+ bedrooms (%)
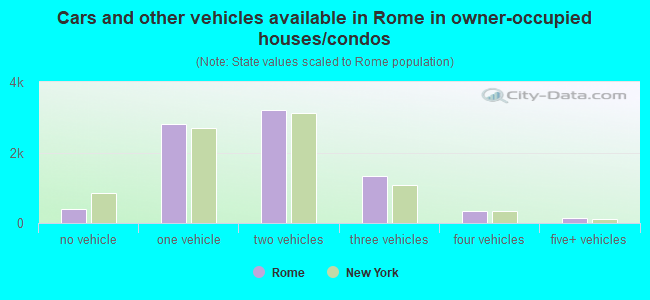
Vehicles available in owner-occupied houses - no vehicle available (%)
Vehicles available in owner-occupied houses - 1 vehicle available(%)
Vehicles available in owner-occupied houses - 2 Vehicles available (%)
Vehicles available in owner-occupied houses - 3 Vehicles available (%)
Vehicles available in owner-occupied houses - 4 Vehicles available (%)
Vehicles available in owner-occupied houses - 5+ Vehicles available (%)
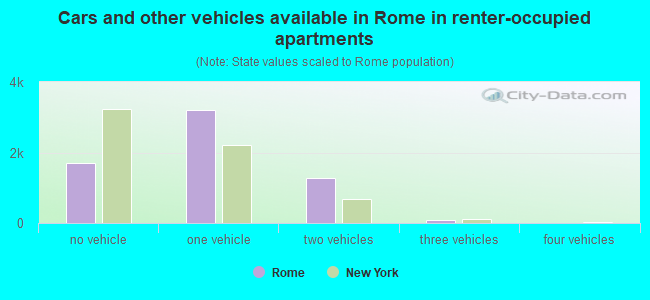
Vehicles available in renter-occupied houses - no vehicle available (%)
Vehicles available in renter-occupied houses - 1 vehicle available (%)
Vehicles available in renter-occupied houses - 2 Vehicles available (%)
Vehicles available in renter-occupied houses - 3 Vehicles available (%)
Vehicles available in renter-occupied houses - 4 Vehicles available (%)
Vehicles available in renter-occupied houses - 5+ Vehicles available (%)
Housing units in structures - 1, detached (%)
Housing units in structures - 1, attached (%)
Housing units in structures - 2 (%)
Housing units in structures - 3 or 4 (%)
Housing units in structures - 5 to 9 (%)
Housing units in structures - 10 to 19 (%)
Housing units in structures - 20 to 49 (%)
Housing units in structures - 50 or more (%)
Housing units in structures - Mobile home (%)
Housing units in structures - Boat, RV, van, etc. (%)
Housing units in structures - Owners - 1, detached (%)
Housing units in structures - Owners - 1, attached (%)
Housing units in structures - Owners - 2 (%)
Housing units in structures - Owners - 3 or 4 (%)
Housing units in structures - Owners - 5 to 9 (%)
Housing units in structures - Owners - 10 to 19 (%)
Housing units in structures - Owners - 20 to 49 (%)
Housing units in structures - Owners - 50 or more (%)
Housing units in structures - Owners - Mobile home (%)
Housing units in structures - Owners - Boat, RV, van, etc. (%)
Housing units in structures - Renters - 1, detached (%)
Housing units in structures - Renters - 1, attached (%)
Housing units in structures - Renters - 2 (%)
Housing units in structures - Renters - 3 or 4 (%)
Housing units in structures - Renters - 5 to 9 (%)
Housing units in structures - Renters - 10 to 19 (%)
Housing units in structures - Renters - 20 to 49 (%)
Housing units in structures - Renters - 50 or more (%)
Housing units in structures - Renters - Mobile home (%)
Housing units in structures - Renters - Boat, RV, van, etc. (%)
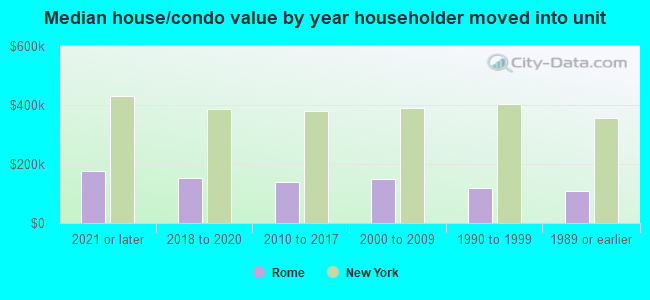
House/condo owner moved in on average (years ago)
Renter moved in on average (years ago)
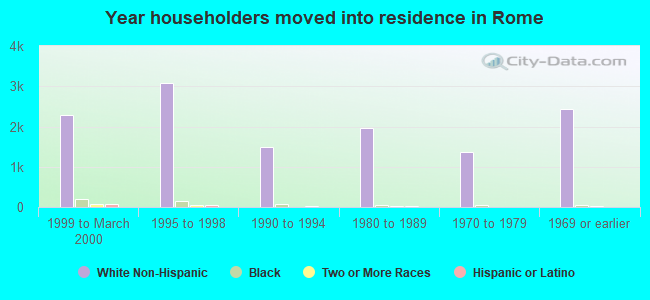
Year householder moved into unit - Moved in 1999 to March 2000 (%)
Year householder moved into unit - Moved in 1999 to March 2000 (%) - White
Year householder moved into unit - Moved in 1999 to March 2000 (%) - Black or African American
Year householder moved into unit - Moved in 1999 to March 2000 (%) - Asian
Year householder moved into unit - Moved in 1999 to March 2000 (%) - Hispanic or Latino
Year householder moved into unit - Moved in 1999 to March 2000 (%) - American Indian and Alaska Native
Year householder moved into unit - Moved in 1999 to March 2000 (%) - Multirace
Year householder moved into unit - Moved in 1999 to March 2000 (%) - Other Race
Year householder moved into unit - Moved in 1995 to 1998 (%)
Year householder moved into unit - Moved in 1995 to 1998 (%) - White
Year householder moved into unit - Moved in 1995 to 1998 (%) - Black or African American
Year householder moved into unit - Moved in 1995 to 1998 (%) - Asian
Year householder moved into unit - Moved in 1995 to 1998 (%) - Hispanic or Latino
Year householder moved into unit - Moved in 1995 to 1998 (%) - American Indian and Alaska Native
Year householder moved into unit - Moved in 1995 to 1998 (%) - Multirace
Year householder moved into unit - Moved in 1995 to 1998 (%) - Other Race
Year householder moved into unit - Moved in 1990 to 1994 (%)
Year householder moved into unit - Moved in 1990 to 1994 (%) - White
Year householder moved into unit - Moved in 1990 to 1994 (%) - Black or African American
Year householder moved into unit - Moved in 1990 to 1994 (%) - Asian
Year householder moved into unit - Moved in 1990 to 1994 (%) - Hispanic or Latino
Year householder moved into unit - Moved in 1990 to 1994 (%) - American Indian and Alaska Native
Year householder moved into unit - Moved in 1990 to 1994 (%) - Multirace
Year householder moved into unit - Moved in 1990 to 1994 (%) - Other Race
Year householder moved into unit - Moved in 1980 to 1989 (%)
Year householder moved into unit - Moved in 1980 to 1989 (%) - White
Year householder moved into unit - Moved in 1980 to 1989 (%) - Black or African American
Year householder moved into unit - Moved in 1980 to 1989 (%) - Asian
Year householder moved into unit - Moved in 1980 to 1989 (%) - Hispanic or Latino
Year householder moved into unit - Moved in 1980 to 1989 (%) - American Indian and Alaska Native
Year householder moved into unit - Moved in 1980 to 1989 (%) - Multirace
Year householder moved into unit - Moved in 1980 to 1989 (%) - Other Race
Year householder moved into unit - Moved in 1970 to 1979 (%)
Year householder moved into unit - Moved in 1970 to 1979 (%) - White
Year householder moved into unit - Moved in 1970 to 1979 (%) - Black or African American
Year householder moved into unit - Moved in 1970 to 1979 (%) - Asian
Year householder moved into unit - Moved in 1970 to 1979 (%) - Hispanic or Latino
Year householder moved into unit - Moved in 1970 to 1979 (%) - American Indian and Alaska Native
Year householder moved into unit - Moved in 1970 to 1979 (%) - Multirace
Year householder moved into unit - Moved in 1970 to 1979 (%) - Other Race
Year householder moved into unit - Moved in 1969 or earlier (%)
Year householder moved into unit - Moved in 1969 or earlier (%) - White
Year householder moved into unit - Moved in 1969 or earlier (%) - Black or African American
Year householder moved into unit - Moved in 1969 or earlier (%) - Asian
Year householder moved into unit - Moved in 1969 or earlier (%) - Hispanic or Latino
Year householder moved into unit - Moved in 1969 or earlier (%) - American Indian and Alaska Native
Year householder moved into unit - Moved in 1969 or earlier (%) - Multirace
Year householder moved into unit - Moved in 1969 or earlier (%) - Other Race
Housing units lacking complete plumbing facilities (%)
Housing units lacking complete kitchen facilities (%)
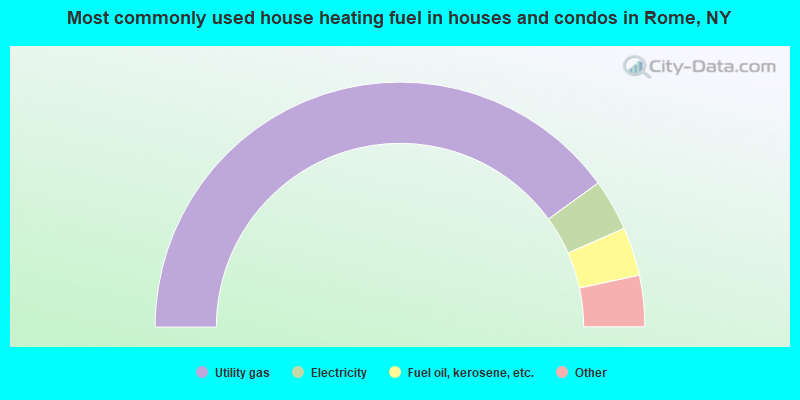
House heating fuel used in houses and condos - Utility gas (%)
House heating fuel used in houses and condos - Bottled, tank, or LP gas (%)
House heating fuel used in houses and condos - Electricity (%)
House heating fuel used in houses and condos - Fuel oil, kerosene, etc. (%)
House heating fuel used in houses and condos - Coal or coke (%)
House heating fuel used in houses and condos - Wood (%)
House heating fuel used in houses and condos - Solar energy (%)
House heating fuel used in houses and condos - Other fuel (%)
House heating fuel used in houses and condos - No fuel used (%)
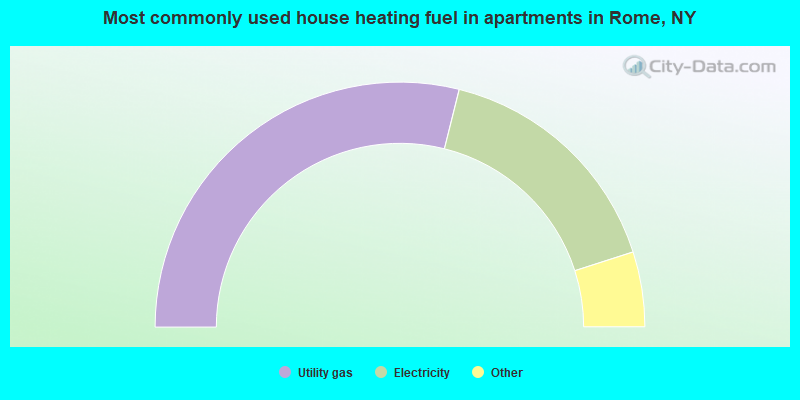
House heating fuel used in apartments - Utility gas (%)
House heating fuel used in apartments - Bottled, tank, or LP gas (%)
House heating fuel used in apartments - Electricity (%)
House heating fuel used in apartments - Fuel oil, kerosene, etc. (%)
House heating fuel used in apartments - Coal or coke (%)
House heating fuel used in apartments - Wood (%)
House heating fuel used in apartments - Solar energy (%)
House heating fuel used in apartments - Other fuel (%)
House heating fuel used in apartments - No fuel used (%)
Latest news about housing in Rome, NY collected exclusively by city-data.com from local newspapers, TV, and radio stations
Median year house/condo built: 1953Median year apartment built: 1963Household type by relationship:
Households: 31,724
Male householders: 6,528 (2,540 living alone ), Female householders: 7,065 (2,696 living alone )4,776 spouses (4,708 opposite-sex spouses ), 1,299 unmarried partners , (1,294 opposite-sex unmarried partners ), 8,063 children (7,470 natural , 235 adopted , 356 stepchildren ), 517 grandchildren , 221 brothers or sisters , 384 parents , 0 foster children , 421 other relatives , 417 non-relatives In group quarters: 2,027
Size of family households: 4,001 2-persons , 1,595 3-persons , 1,794 4-persons , 426 5-persons , 142 6-persons , 250 7-or-more-persons .
Size of nonfamily households: 5,579 1-person , 646 2-persons , 51 3-persons , 5 5-persons .
3,024 married couples with children. single-parent households (358 men , 2,514 women ).
92.2% of residents of Rome speak English at home. of residents speak Spanish at home (74% speak English very well , 16% speak English well , 4% speak English not well , 6% don't speak English at all ).of residents speak other Indo-European language at home (70% speak English very well , 25% speak English well , 3% speak English not well , 1% don't speak English at all ).of residents speak Asian or Pacific Island language at home (27% speak English very well , 56% speak English well , 12% speak English not well , 5% don't speak English at all ).of residents speak other language at home (39% speak English very well , 61% speak English well ).
Foreign born population: 1,090 (3.4%)of them are naturalized citizens )
Median number of rooms in houses and condos:
Median number of rooms in apartments
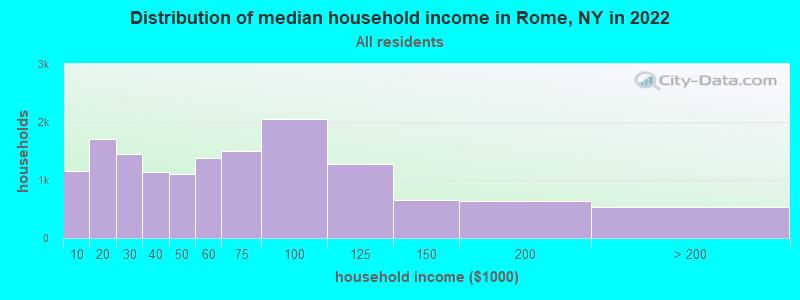
Rome, NY household income distribution 1,159 Less than $10,0001,704 $10,000 to $19,9991,442 $20,000 to $29,9991,134 $30,000 to $39,9991,110 $40,000 to $49,9991,376 $50,000 to $59,9991,492 $60,000 to $74,9992,053 $75,000 to $99,9991,275 $100,000 to $124,999652 $125,000 to $149,999644 $150,000 to $199,999526 $200,000 or more
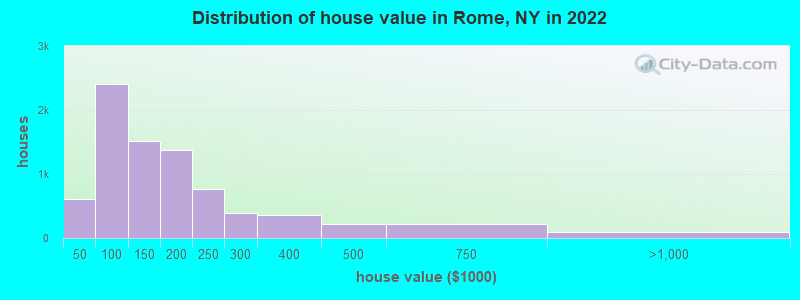
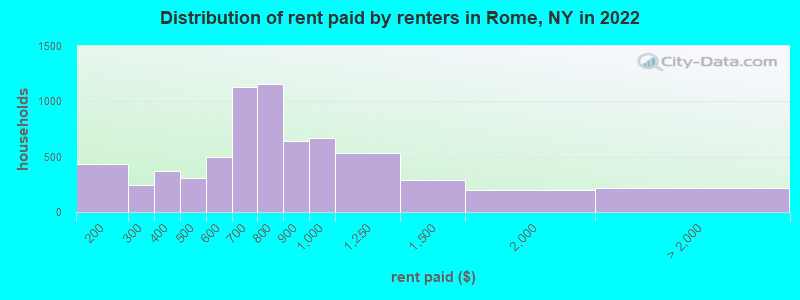
Home value of owner - occupied houses in 2022 in Rome, NY 178 Less than $10,000105 $10,000 to $14,999107 $15,000 to $19,99959 $20,000 to $24,99944 $25,000 to $29,99921 $30,000 to $34,9996 $35,000 to $39,99989 $40,000 to $49,999113 $50,000 to $59,999315 $60,000 to $69,999378 $70,000 to $79,999836 $80,000 to $89,999670 $90,000 to $99,999942 $100,000 to $124,999570 $125,000 to $149,999901 $150,000 to $174,999468 $175,000 to $199,999760 $200,000 to $249,999391 $250,000 to $299,999360 $300,000 to $399,999213 $400,000 to $499,999221 $500,000 to $749,99967 $750,000 to $999,99924 $1,000,000 to $1,499,9999 $2,000,000 or moreRent paid by renters in 2022 in Rome, NY 12 $100 to $149423 $150 to $199131 $200 to $249115 $250 to $299177 $300 to $349192 $350 to $399198 $400 to $449109 $450 to $499205 $500 to $549294 $550 to $599434 $600 to $649694 $650 to $699345 $700 to $749813 $750 to $799644 $800 to $899673 $900 to $999536 $1,000 to $1,249288 $1,250 to $1,499203 $1,500 to $1,99913 $2,000 to $2,499201 No cash rent
Percentage of workers working in this county: 91.7%Number of people working at home: 2,035 (16.3% of all workers )
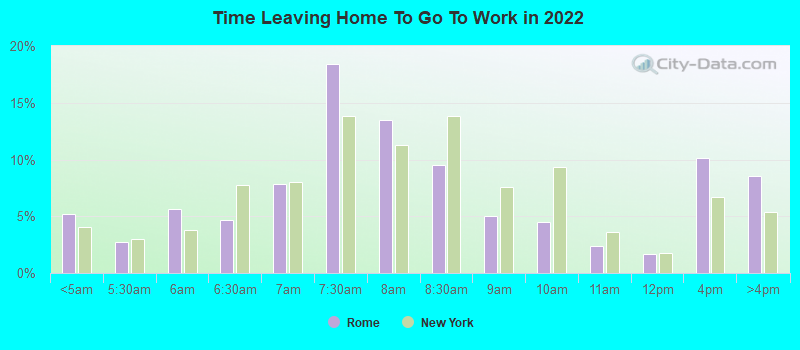
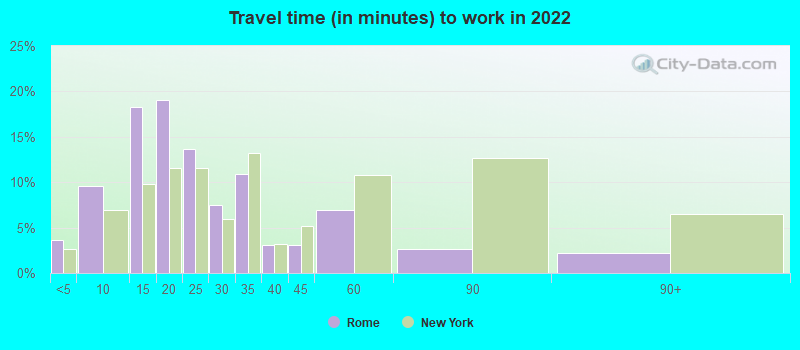
Travel time to work (commute)
Less than 5 minutes: 6755 to 9 minutes: 1,48610 to 14 minutes: 2,05015 to 19 minutes: 1,74720 to 24 minutes: 1,37625 to 29 minutes: 1,00930 to 34 minutes: 94535 to 39 minutes: 16540 to 44 minutes: 13045 to 59 minutes: 30060 to 89 minutes: 18590 or more minutes: 195
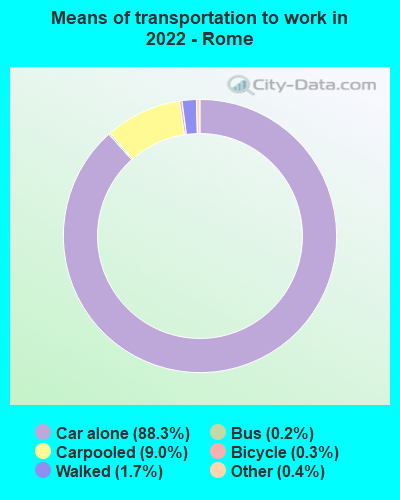
Means of transportation to work:
Drove a car alone: 14,669 (80.1%)Carpooled: 1,222 (6.7%)Bus : 38 (0.2%)Subway or elevated rail : 6 (0.0%)Light rail, streetcar or trolley : 9 (0.0%)Taxi: 61 (0.3%)Bicycle: 62 (0.3%)Walked: 237 (1.3%)Worked at home: 2,035 (11.1%)
Unemployment by race in 2022
Unemployment rate for White non-Hispanic residents 1.4% Males3.2% FemalesUnemployment rate for Black residents 22.3% MalesUnemployment rate for American Indian and Alaska Native residents 49.8% FemalesUnemployment rate for Asian residents 16.6% Males17.2% FemalesUnemployment rate for two or more race residents 3.0% Males8.0% FemalesUnemployment rate for Hispanic or Latino residents 19.2% Males9.8% Females
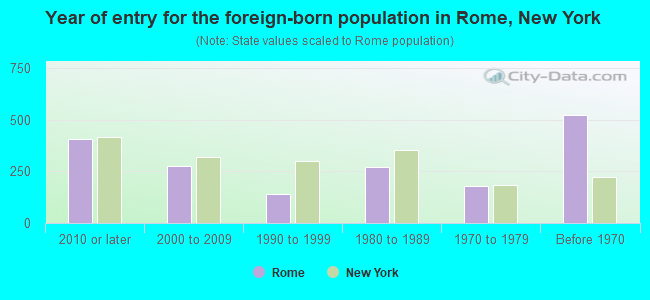
Year of entry for the foreign-born population in Rome, New York
404 2010 or later 277 2000 to 2009 142 1990 to 1999 271 1980 to 1989 177 1970 to 1979 522 Before 1970
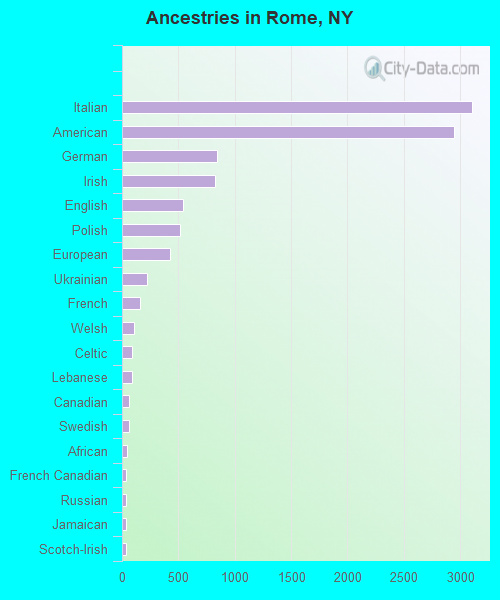
First ancestries reported:
Italian: 3,100 (23.5%)
American: 2,943 (22.3%)
German: 847 (6.4%)
Irish: 828 (6.3%)
English: 542 (4.1%)
Polish: 515 (3.9%)
European: 426 (3.2%)
Ukrainian: 223 (1.7%)
French: 157 (1.2%)
Welsh: 106 (0.8%)
Celtic: 93 (0.7%)
Lebanese: 89 (0.7%)
Canadian: 60 (0.5%)
Swedish: 59 (0.4%)
African: 40 (0.3%)
French Canadian: 39 (0.3%)
Russian: 38 (0.3%)
Jamaican: 36 (0.3%)
Scotch-Irish: 33 (0.3%)
Moroccan: 28 (0.2%)
Greek: 24 (0.2%)
Scottish: 23 (0.2%)
Slavic: 19 (0.1%)
Hungarian: 19 (0.1%)
Dutch: 17 (0.1%)
British: 16 (0.1%)
Danish: 14 (0.1%)
Trinidadian and Tobagonian: 12 (0.09%)
Nigerian: 11 (0.08%)
Slovene: 10 (0.08%)
Finnish: 8 (0.06%)
Czech: 7 (0.05%)
Eastern European: 7 (0.05%)
Turkish: 6 (0.05%)
Portuguese: 4 (0.03%)
Ghanaian: 3 (0.02%)
Somali: 3 (0.02%)
Swiss: 3 (0.02%)
Serbian: 2 (0.02%) Most common places of birth for foreign-born residents (%): China, excluding Hong Kong and Taiwan Rome:
10.8% (118)New York:
9.1% (410,910)
Germany Rome:
10.1% (110)New York:
0.9% (38,713)
Canada Rome:
8.1% (88)New York:
1.3% (59,107)
Guyana Rome:
6.5% (71)New York:
3.8% (172,129)
Dominican Republic Rome:
6.4% (70)New York:
11.1% (501,040)
Korea Rome:
5.8% (63)New York:
1.8% (82,786)
Hong Kong Rome:
5.0% (54)New York:
0.9% (42,220)
Ghana Rome:
4.0% (44)New York:
0.9% (39,058)
Poland Rome:
3.2% (35)New York:
1.4% (65,102)
Jamaica Rome:
3.1% (34)New York:
5.0% (227,557)
Guatemala Rome:
2.9% (32)New York:
1.4% (61,245)
Philippines Rome:
2.8% (31)New York:
2.0% (91,070)
Russia Rome:
2.7% (29)New York:
1.7% (75,802)
Morocco Rome:
2.6% (28)New York:
0.2% (10,005)
Ireland Rome:
2.5% (27)New York:
0.6% (26,772)
Place of birth for U.S.-born residents:
This state: 25,623Other state: 4,380Northeast: 1,112Midwest: 604South: 1,620West: 1,111 89.3% of Rome residents lived in the same house 1 years ago.
Out of people who lived in different houses, 42.7% lived in this county.
Out of people who lived in different counties, 62.7% lived in New York.
Rome:
89.3%State average:
89.6%
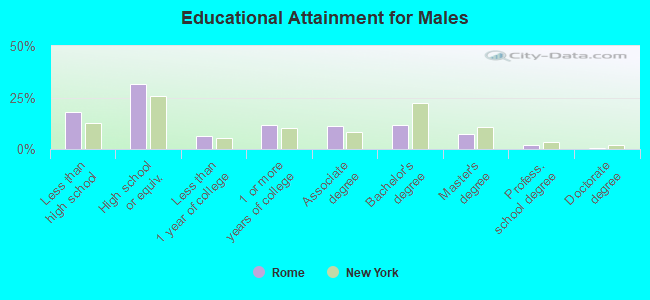
Education attainment for males 25 years and older:
No schooling: 371Nursery to 4th grade: 265th and 6th grade: 487th and 8th grade: 1729th grade: 12710th grade: 62211th grade: 29212th grade, no diploma: 332High school graduate (or equivalency): 3,536Less than 1 year of college: 691Some college more than 1 year, no degree: 1,292Associate degree: 1,261Bachelor's degree: 1,300Master's degree: 806Professional school degree: 204Doctorate degree: 75
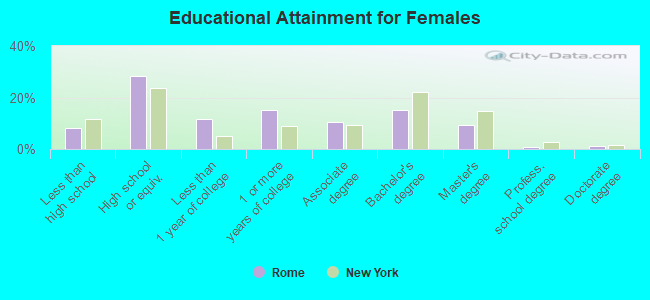
Education attainment for females 25 years and older:
No schooling: 296Nursery to 4th grade: 125th and 6th grade: 267th and 8th grade: 339th grade: 9810th grade: 17211th grade: 20512th grade, no diploma: 62High school graduate (or equivalency): 3,180Less than 1 year of college: 1,302Some college more than 1 year, no degree: 1,702Associate degree: 1,167Bachelor's degree: 1,715Master's degree: 1,028Professional school degree: 70Doctorate degree: 144
Housing units in structures:
One, detached: 9,194One, attached: 248Two: 1,8883 or 4: 1,0665 to 9: 55910 to 19: 65220 to 49: 35050 or more: 1,186Mobile homes: 304Median worth of mobile homes: $13,232
Housing units lacking complete plumbing facilities in 2022: 1.2%Housing units lacking complete kitchen facilities in 2022: 1.0%House/condo owner moved in on average 17 years ago
Renter moved in on average 3 years ago
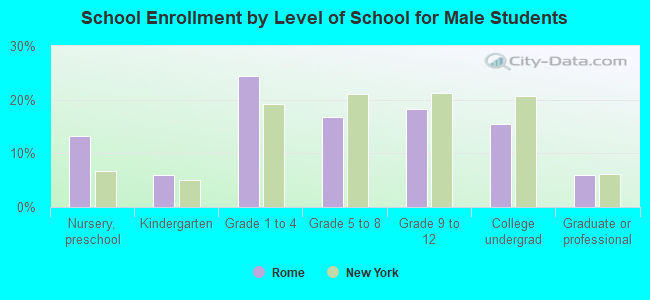
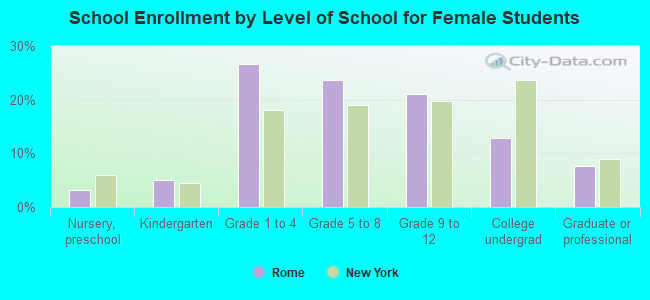
Private vs. public school enrollment:
Students in private schools in grades 1 to 8 (elementary and middle school): 86 Students in private schools in grades 9 to 12 (high school): 146 Students in private undergraduate colleges: 218