Ronkonkoma, NY (New York) Houses and Residents
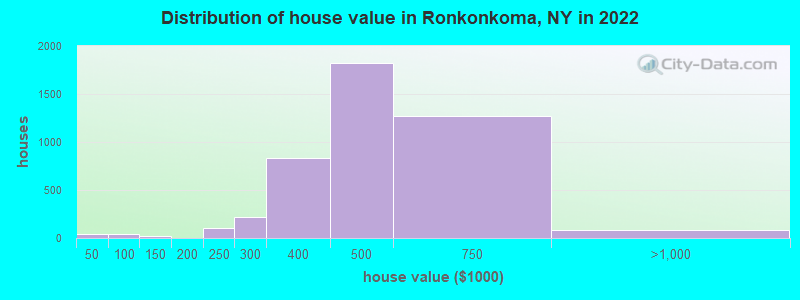
Estimated median house or condo value in 2022: $485,993 (it was $162,700 in 2000 )
Ronkonkoma:
$485,993New York:
$400,400
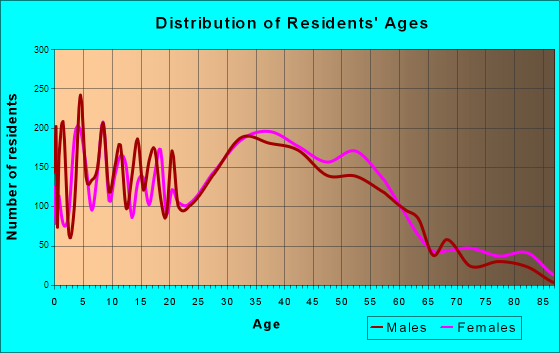
Lower value quartile - upper value quartile: $387,903 - $520,400Total population: 19,082 (All urban)
Houses: 6,571 (6,208 occupied: 4,889 owner occupied, 1,316 renter occupied )
% of renters here:
21%State:
46%
Housing density: 804 houses/condos per square mile
Median price asked for vacant for-sale houses and condos in 2022: $650,976.
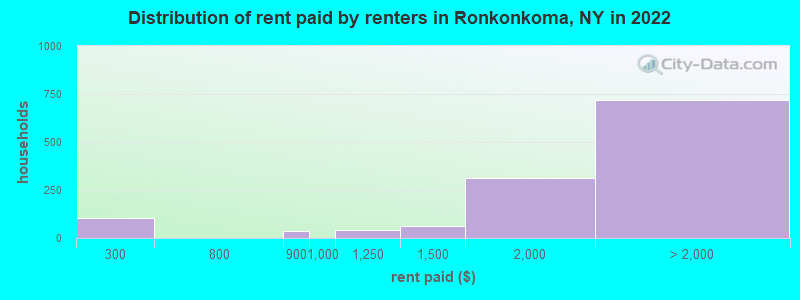
Median contract rent in 2022: over $2,000 (lower quartile is $1,493, upper quartile is over $2,000)
Median rent asked for vacant for-rent units in 2022: $3,327
Median gross rent in Ronkonkoma, NY in 2022: over $2,000
Housing units in Ronkonkoma with a mortgage: 3,202 (283 second mortgage, 5 home equity loan, 247 both second mortgage and home equity loan )Houses without a mortgage: 186
Median household income for houses/condos with a mortgage: $142,489
Median household income for apartments without a mortgage: $85,135
Median monthly housing costs: $2,236
Data:
Median house or condo value ($)
Median house or condo value ($ change since 2000)
Median house or condo value ($) - White
Median house or condo value ($) - Black or African American
Median house or condo value ($) - Asian
Median house or condo value ($) - Hispanic or Latino
Median house or condo value ($) - American Indian and Alaska Native
Median house or condo value ($) - Multirace
Median house or condo value ($) - Other Race
Median price asked for mobile homes ($)
Household density (households per square mile)
Mean house or condo value by units in structure - 1, detached ($)
Mean house or condo value by units in structure - 1, attached ($)
Mean house or condo value by units in structure - 2 ($)
Mean house or condo value by units in structure by units in structure - 3 or 4 ($)
Mean house or condo value by units in structure - 5 or more ($)
Mean house or condo value by units in structure - Boat, RV, van, etc. ($)
Mean house or condo value by units in structure - Mobile home ($)
Median contract rent ($)
Median contract rent - Lower quartile ($)
Median contract rent - Upper quartile ($)
Median gross rent ($)
Urban houses (%)
Rural houses (%)
Houses occupied (%)
Houses occupied (% change since 2000)
Houses owner occupied (%)
Houses owner occupied (% change since 2000)
Houses renter occupied (%)
Houses renter occupied (% change since 2000)
Vacant housing units - For rent (%)
Vacant housing units - For rent (% change since 2000)
Vacant housing units - For sale only (%)
Vacant housing units - For sale only (% change since 2000)
Vacant housing units - Rented or sold, not occupied (%)
Vacant housing units - Rented or sold, not occupied (% change since 2000)
Vacant housing units - For seasonal, recreational, or occasional use (%)
Vacant housing units - For seasonal, recreational, or occasional use (% change since 2000)
Vacant housing units - For migrant workers (%)
Vacant housing units - For migrant workers (% change since 2000)
Vacant housing units - Other vacant (%)
Vacant housing units - Other vacant (% change since 2000)
Median monthly housing costs ($)
Median household income for houses/condos with a mortgage ($)
Median household income for houses/condos without a mortgage ($)
Median household income ($)
Median household income ($) - White
Median household income ($) - Black or African American
Median household income ($) - Asian
Median household income ($) - Hispanic or Latino
Median household income ($) - American Indian and Alaska Native
Median household income ($) - Multirace
Median household income ($) - Other Race
Mortgage status - with mortgage (%)
Mortgage status - with second mortgage (%)
Mortgage status - with home equity loan (%)
Mortgage status - with both second mortgage and home equity loan (%)
Mortgage status - without a mortgage (%)
Median year house/condo built
Median year apartment built
Household type by relationship - Male householder living alone (%)
Household type by relationship - Male householder not living alone (%)
Household type by relationship - Female householder living alone (%)
Household type by relationship - Female householder not living alone (%)
Household type by relationship - Opposite-Sex spouse (%)
Household type by relationship - Same-Sex spouse (%)
Household type by relationship - Opposite-Sex unmarried partner (%)
Household type by relationship - Same-Sex unmarried partner (%)
Household type by relationship - In group quarters (%)
Size of family households - 2-person household (%)
Size of family households - 3-person household (%)
Size of family households - 4-person household (%)
Size of family households - 5-person household (%)
Size of family households - 6-person household (%)
Size of family households - 7-or-more-person household (%)
Size of nonfamily households - 1-person household (%)
Size of nonfamily households - 2-person household (%)
Size of nonfamily households - 3-person household (%)
Size of nonfamily households - 4-person household (%)
Size of nonfamily households - 5-person household (%)
Size of nonfamily households - 6-person household (%)
Size of nonfamily households - 7-or-moreperson household (%)
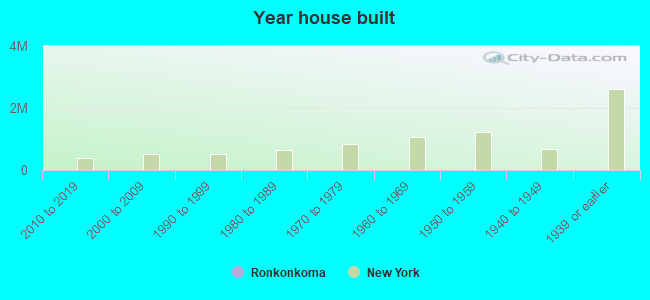
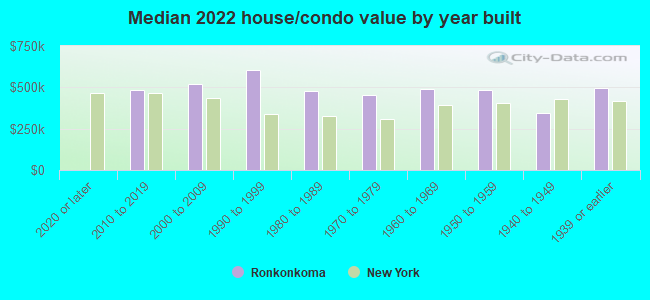
Year house built - Built 2010 or later (%)
Year house built - Built 2000 to 2009 (%)
Year house built - Built 1990 to 1999 (%)
Year house built - Built 1980 to 1989 (%)
Year house built - Built 1970 to 1979 (%)
Year house built - Built 1960 to 1969 (%)
Year house built - Built 1950 to 1959 (%)
Year house built - Built 1940 to 1949 (%)
Year house built - Built 1939 or earlier (%)
Median number of rooms in houses and condos
Median number of rooms in apartments
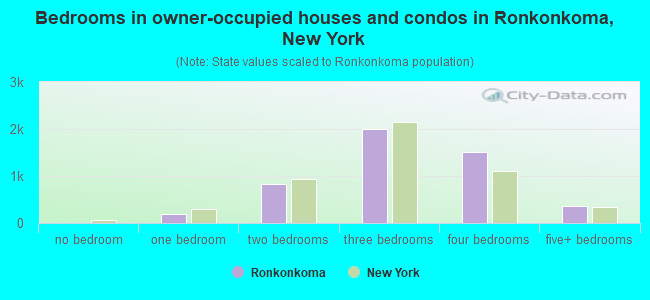
Median number of bedrooms in owner occupied houses
Mean number of bedrooms in owner occupied houses
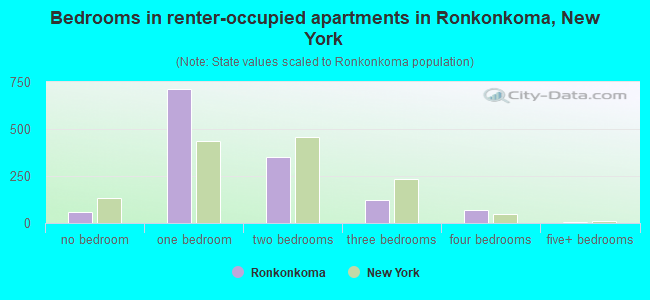
Median number of bedrooms in renter occupied houses
Mean number of bedrooms in renter occupied houses
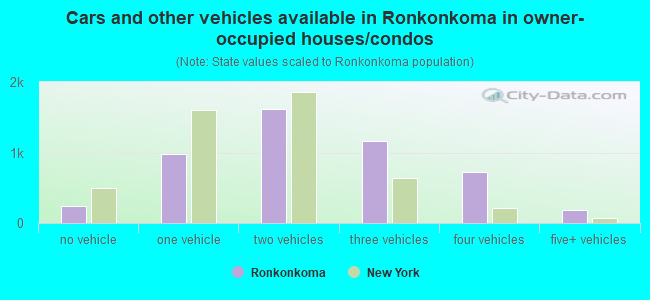
Median number of vehichles in owner occupied houses
Mean number of vehichles in owner occupied houses
Median number of vehichles in renter occupied houses
Mean number of vehichles in renter occupied houses
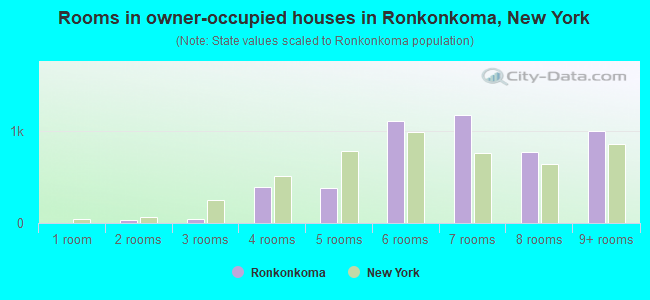
Rooms in owner-occupied houses - 1 room (%)
Rooms in owner-occupied houses - 2 rooms (%)
Rooms in owner-occupied houses - 3 rooms (%)
Rooms in owner-occupied houses - 4 rooms (%)
Rooms in owner-occupied houses - 5 rooms (%)
Rooms in owner-occupied houses - 6 rooms (%)
Rooms in owner-occupied houses - 7 rooms (%)
Rooms in owner-occupied houses - 8 rooms (%)
Rooms in owner-occupied houses - 9+ rooms (%)
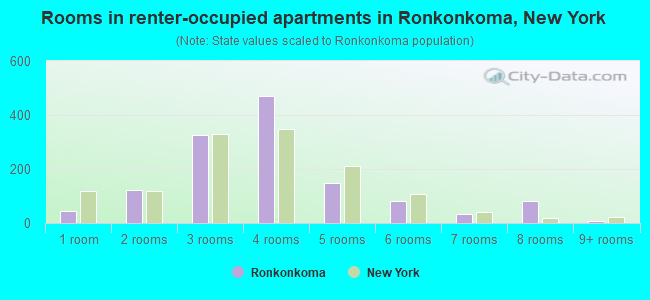
Rooms in renter-occupied houses - 1 room (%)
Rooms in renter-occupied houses - 2 rooms (%)
Rooms in renter-occupied houses - 3 rooms (%)
Rooms in renter-occupied houses - 4 rooms (%)
Rooms in renter-occupied houses - 5 rooms (%)
Rooms in renter-occupied houses - 6 rooms (%)
Rooms in renter-occupied houses - 7 rooms (%)
Rooms in renter-occupied houses - 8 rooms (%)
Rooms in renter-occupied houses - 9+ rooms (%)
Bedrooms in owner-occupied houses - no bedrooms (%)
Bedrooms in owner-occupied houses - 1 bedroom (%)
Bedrooms in owner-occupied houses - 2 bedrooms (%)
Bedrooms in owner-occupied houses - 3 bedrooms (%)
Bedrooms in owner-occupied houses - 4 bedrooms (%)
Bedrooms in owner-occupied houses - 5+ bedrooms (%)
Bedrooms in renter-occupied houses - no bedrooms (%)
Bedrooms in renter-occupied houses - 1 bedroom (%)
Bedrooms in renter-occupied houses - 2 bedrooms (%)
Bedrooms in renter-occupied houses - 3 bedrooms (%)
Bedrooms in renter-occupied houses - 4 bedrooms (%)
Bedrooms in renter-occupied houses - 5+ bedrooms (%)
Vehicles available in owner-occupied houses - no vehicle available (%)
Vehicles available in owner-occupied houses - 1 vehicle available(%)
Vehicles available in owner-occupied houses - 2 Vehicles available (%)
Vehicles available in owner-occupied houses - 3 Vehicles available (%)
Vehicles available in owner-occupied houses - 4 Vehicles available (%)
Vehicles available in owner-occupied houses - 5+ Vehicles available (%)
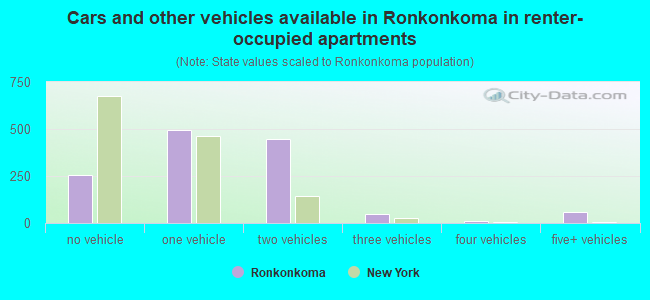
Vehicles available in renter-occupied houses - no vehicle available (%)
Vehicles available in renter-occupied houses - 1 vehicle available (%)
Vehicles available in renter-occupied houses - 2 Vehicles available (%)
Vehicles available in renter-occupied houses - 3 Vehicles available (%)
Vehicles available in renter-occupied houses - 4 Vehicles available (%)
Vehicles available in renter-occupied houses - 5+ Vehicles available (%)
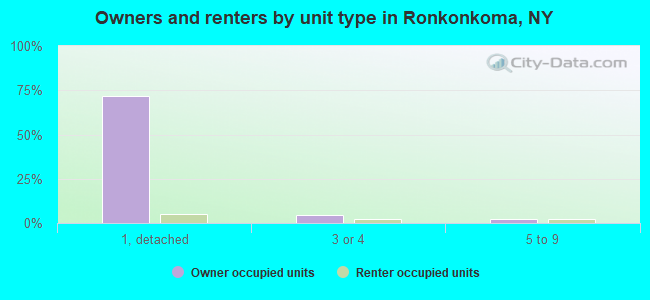
Housing units in structures - 1, detached (%)
Housing units in structures - 1, attached (%)
Housing units in structures - 2 (%)
Housing units in structures - 3 or 4 (%)
Housing units in structures - 5 to 9 (%)
Housing units in structures - 10 to 19 (%)
Housing units in structures - 20 to 49 (%)
Housing units in structures - 50 or more (%)
Housing units in structures - Mobile home (%)
Housing units in structures - Boat, RV, van, etc. (%)
Housing units in structures - Owners - 1, detached (%)
Housing units in structures - Owners - 1, attached (%)
Housing units in structures - Owners - 2 (%)
Housing units in structures - Owners - 3 or 4 (%)
Housing units in structures - Owners - 5 to 9 (%)
Housing units in structures - Owners - 10 to 19 (%)
Housing units in structures - Owners - 20 to 49 (%)
Housing units in structures - Owners - 50 or more (%)
Housing units in structures - Owners - Mobile home (%)
Housing units in structures - Owners - Boat, RV, van, etc. (%)
Housing units in structures - Renters - 1, detached (%)
Housing units in structures - Renters - 1, attached (%)
Housing units in structures - Renters - 2 (%)
Housing units in structures - Renters - 3 or 4 (%)
Housing units in structures - Renters - 5 to 9 (%)
Housing units in structures - Renters - 10 to 19 (%)
Housing units in structures - Renters - 20 to 49 (%)
Housing units in structures - Renters - 50 or more (%)
Housing units in structures - Renters - Mobile home (%)
Housing units in structures - Renters - Boat, RV, van, etc. (%)
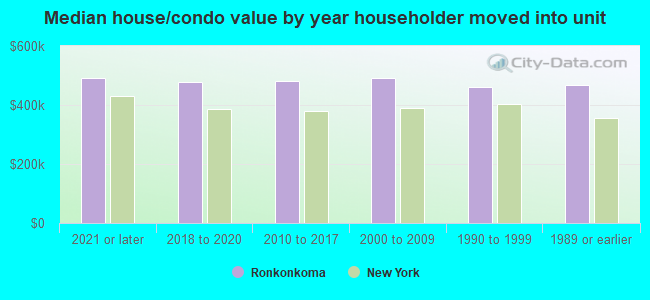
House/condo owner moved in on average (years ago)
Renter moved in on average (years ago)
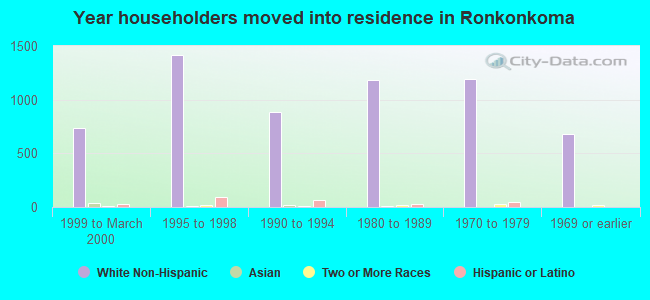
Year householder moved into unit - Moved in 1999 to March 2000 (%)
Year householder moved into unit - Moved in 1999 to March 2000 (%) - White
Year householder moved into unit - Moved in 1999 to March 2000 (%) - Black or African American
Year householder moved into unit - Moved in 1999 to March 2000 (%) - Asian
Year householder moved into unit - Moved in 1999 to March 2000 (%) - Hispanic or Latino
Year householder moved into unit - Moved in 1999 to March 2000 (%) - American Indian and Alaska Native
Year householder moved into unit - Moved in 1999 to March 2000 (%) - Multirace
Year householder moved into unit - Moved in 1999 to March 2000 (%) - Other Race
Year householder moved into unit - Moved in 1995 to 1998 (%)
Year householder moved into unit - Moved in 1995 to 1998 (%) - White
Year householder moved into unit - Moved in 1995 to 1998 (%) - Black or African American
Year householder moved into unit - Moved in 1995 to 1998 (%) - Asian
Year householder moved into unit - Moved in 1995 to 1998 (%) - Hispanic or Latino
Year householder moved into unit - Moved in 1995 to 1998 (%) - American Indian and Alaska Native
Year householder moved into unit - Moved in 1995 to 1998 (%) - Multirace
Year householder moved into unit - Moved in 1995 to 1998 (%) - Other Race
Year householder moved into unit - Moved in 1990 to 1994 (%)
Year householder moved into unit - Moved in 1990 to 1994 (%) - White
Year householder moved into unit - Moved in 1990 to 1994 (%) - Black or African American
Year householder moved into unit - Moved in 1990 to 1994 (%) - Asian
Year householder moved into unit - Moved in 1990 to 1994 (%) - Hispanic or Latino
Year householder moved into unit - Moved in 1990 to 1994 (%) - American Indian and Alaska Native
Year householder moved into unit - Moved in 1990 to 1994 (%) - Multirace
Year householder moved into unit - Moved in 1990 to 1994 (%) - Other Race
Year householder moved into unit - Moved in 1980 to 1989 (%)
Year householder moved into unit - Moved in 1980 to 1989 (%) - White
Year householder moved into unit - Moved in 1980 to 1989 (%) - Black or African American
Year householder moved into unit - Moved in 1980 to 1989 (%) - Asian
Year householder moved into unit - Moved in 1980 to 1989 (%) - Hispanic or Latino
Year householder moved into unit - Moved in 1980 to 1989 (%) - American Indian and Alaska Native
Year householder moved into unit - Moved in 1980 to 1989 (%) - Multirace
Year householder moved into unit - Moved in 1980 to 1989 (%) - Other Race
Year householder moved into unit - Moved in 1970 to 1979 (%)
Year householder moved into unit - Moved in 1970 to 1979 (%) - White
Year householder moved into unit - Moved in 1970 to 1979 (%) - Black or African American
Year householder moved into unit - Moved in 1970 to 1979 (%) - Asian
Year householder moved into unit - Moved in 1970 to 1979 (%) - Hispanic or Latino
Year householder moved into unit - Moved in 1970 to 1979 (%) - American Indian and Alaska Native
Year householder moved into unit - Moved in 1970 to 1979 (%) - Multirace
Year householder moved into unit - Moved in 1970 to 1979 (%) - Other Race
Year householder moved into unit - Moved in 1969 or earlier (%)
Year householder moved into unit - Moved in 1969 or earlier (%) - White
Year householder moved into unit - Moved in 1969 or earlier (%) - Black or African American
Year householder moved into unit - Moved in 1969 or earlier (%) - Asian
Year householder moved into unit - Moved in 1969 or earlier (%) - Hispanic or Latino
Year householder moved into unit - Moved in 1969 or earlier (%) - American Indian and Alaska Native
Year householder moved into unit - Moved in 1969 or earlier (%) - Multirace
Year householder moved into unit - Moved in 1969 or earlier (%) - Other Race
Housing units lacking complete plumbing facilities (%)
Housing units lacking complete kitchen facilities (%)
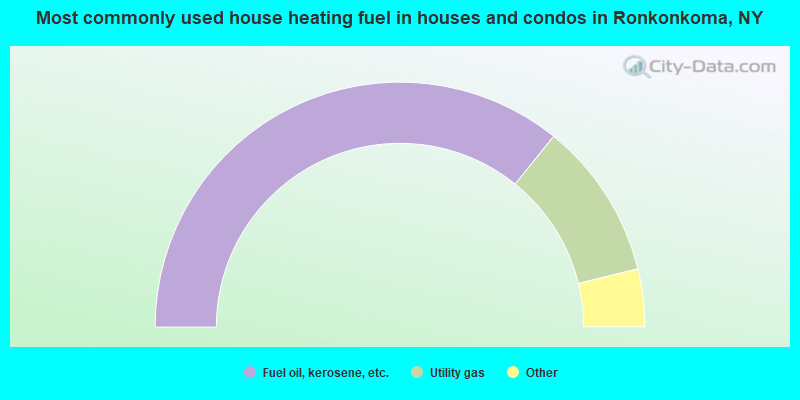
House heating fuel used in houses and condos - Utility gas (%)
House heating fuel used in houses and condos - Bottled, tank, or LP gas (%)
House heating fuel used in houses and condos - Electricity (%)
House heating fuel used in houses and condos - Fuel oil, kerosene, etc. (%)
House heating fuel used in houses and condos - Coal or coke (%)
House heating fuel used in houses and condos - Wood (%)
House heating fuel used in houses and condos - Solar energy (%)
House heating fuel used in houses and condos - Other fuel (%)
House heating fuel used in houses and condos - No fuel used (%)
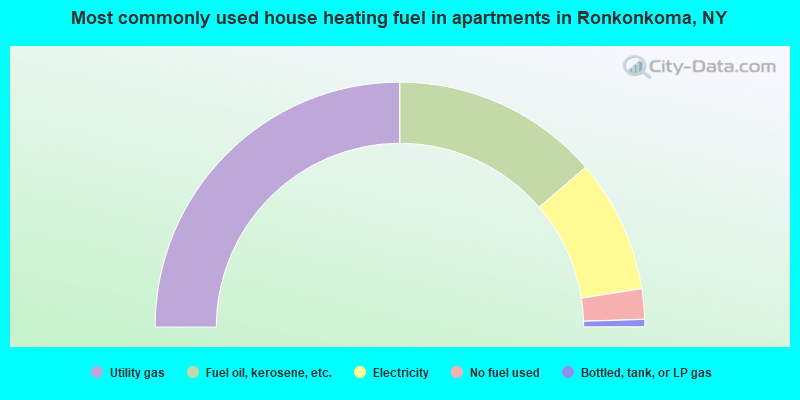
House heating fuel used in apartments - Utility gas (%)
House heating fuel used in apartments - Bottled, tank, or LP gas (%)
House heating fuel used in apartments - Electricity (%)
House heating fuel used in apartments - Fuel oil, kerosene, etc. (%)
House heating fuel used in apartments - Coal or coke (%)
House heating fuel used in apartments - Wood (%)
House heating fuel used in apartments - Solar energy (%)
House heating fuel used in apartments - Other fuel (%)
House heating fuel used in apartments - No fuel used (%)
Latest news about housing in Ronkonkoma, NY collected exclusively by city-data.com from local newspapers, TV, and radio stations
Median year house/condo built: 1969Median year apartment built: 1976Household type by relationship:
Households: 18,850
Male householders: 2,872 (449 living alone ), Female householders: 3,321 (696 living alone )3,488 spouses (3,473 opposite-sex spouses ), 487 unmarried partners , (480 opposite-sex unmarried partners ), 6,678 children (6,398 natural , 148 adopted , 132 stepchildren ), 351 grandchildren , 273 brothers or sisters , 335 parents , 0 foster children , 435 other relatives , 568 non-relatives In group quarters: 39
Size of family households: 1,503 2-persons , 1,173 3-persons , 1,160 4-persons , 409 5-persons , 223 6-persons , 99 7-or-more-persons .
Size of nonfamily households: 1,154 1-person , 430 2-persons , 9 3-persons , 25 4-persons .
2,604 married couples with children. single-parent households (155 men , 706 women ).
78.3% of residents of Ronkonkoma speak English at home. of residents speak Spanish at home (79% speak English very well , 12% speak English well , 8% speak English not well ).of residents speak other Indo-European language at home (76% speak English very well , 16% speak English well , 5% speak English not well , 3% don't speak English at all ).of residents speak Asian or Pacific Island language at home (41% speak English very well , 29% speak English well , 29% speak English not well , 1% don't speak English at all ).of residents speak other language at home (100% speak English very well ).
Foreign born population: 2,938 (15.6%)of them are naturalized citizens )
Median number of rooms in houses and condos:
Median number of rooms in apartments
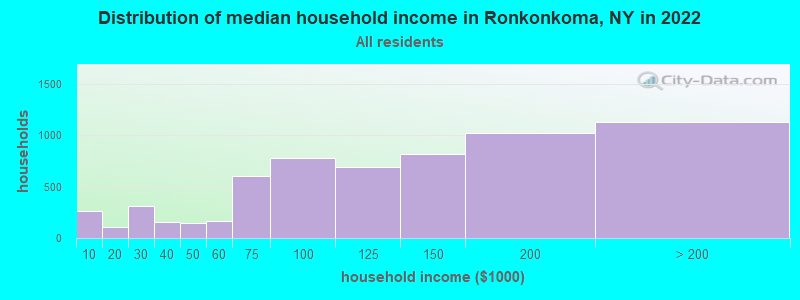
Ronkonkoma, NY household income distribution 265 Less than $10,000110 $10,000 to $19,999310 $20,000 to $29,999155 $30,000 to $39,999150 $40,000 to $49,999166 $50,000 to $59,999600 $60,000 to $74,999782 $75,000 to $99,999691 $100,000 to $124,999817 $125,000 to $149,9991,024 $150,000 to $199,9991,129 $200,000 or more
Home value of owner - occupied houses in 2022 in Ronkonkoma, NY 21 Less than $10,0006 $30,000 to $34,99913 $40,000 to $49,99913 $50,000 to $59,99913 $90,000 to $99,99922 $100,000 to $124,9990 $125,000 to $149,9994 $150,000 to $174,999102 $200,000 to $249,999218 $250,000 to $299,999832 $300,000 to $399,9991,820 $400,000 to $499,9991,265 $500,000 to $749,99966 $750,000 to $999,99920 $1,000,000 to $1,499,999Rent paid by renters in 2022 in Ronkonkoma, NY 18 $200 to $24986 $250 to $29938 $800 to $89942 $1,000 to $1,24960 $1,250 to $1,499314 $1,500 to $1,999475 $2,000 to $2,499116 $2,500 to $2,9996 $3,000 to $3,49933 $3,500 or more85 No cash rent
Percentage of workers working in this county: 80.6%Number of people working at home: 920 (8.9% of all workers )
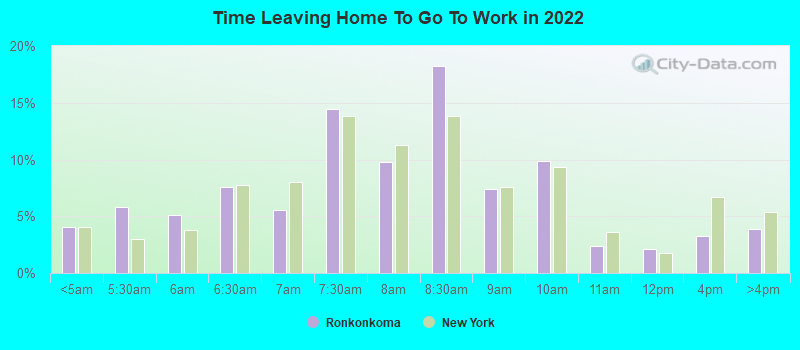
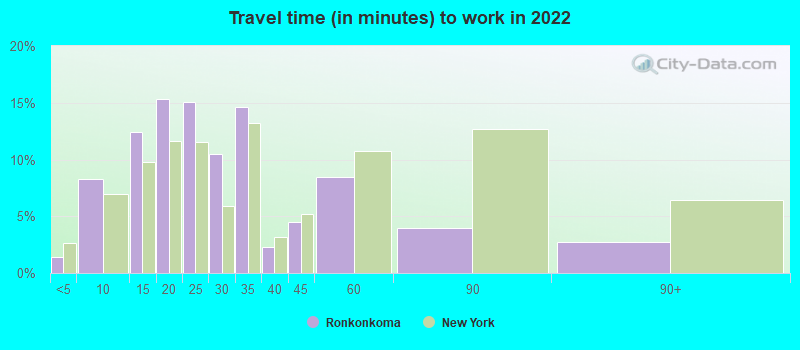
Travel time to work (commute)
Less than 5 minutes: 485 to 9 minutes: 61610 to 14 minutes: 1,19215 to 19 minutes: 1,49420 to 24 minutes: 1,22525 to 29 minutes: 70830 to 34 minutes: 1,41835 to 39 minutes: 13740 to 44 minutes: 31945 to 59 minutes: 34860 to 89 minutes: 1,13590 or more minutes: 605
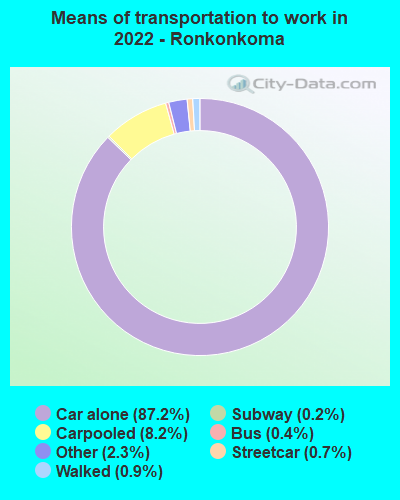
Means of transportation to work:
Drove a car alone: 13,370 (79.0%)Carpooled: 1,448 (8.6%)Bus : 60 (0.4%)Subway or elevated rail : 114 (0.7%)Long-distance train or commuter rail : 33 (0.2%)Taxi: 440 (2.6%)Bicycle: 2 (0.0%)Walked: 142 (0.8%)Worked at home: 920 (5.4%)
Unemployment by race in 2022
Unemployment rate for White non-Hispanic residents 6.5% Males6.9% FemalesUnemployment rate for Black residents 3.2% Males2.9% FemalesUnemployment rate for Asian residents 4.4% MalesUnemployment rate for two or more race residents 4.8% Males3.5% FemalesUnemployment rate for Hispanic or Latino residents 3.9% Males1.1% Females
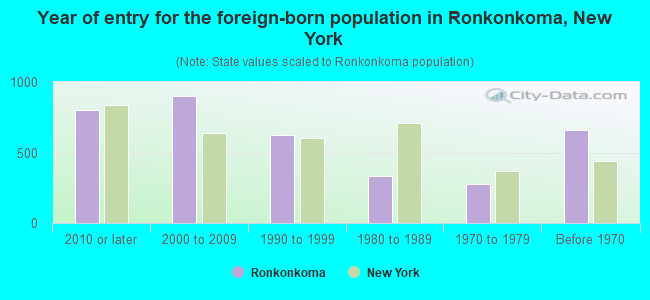
Year of entry for the foreign-born population in Ronkonkoma, New York
799 2010 or later 898 2000 to 2009 622 1990 to 1999 334 1980 to 1989 277 1970 to 1979 660 Before 1970
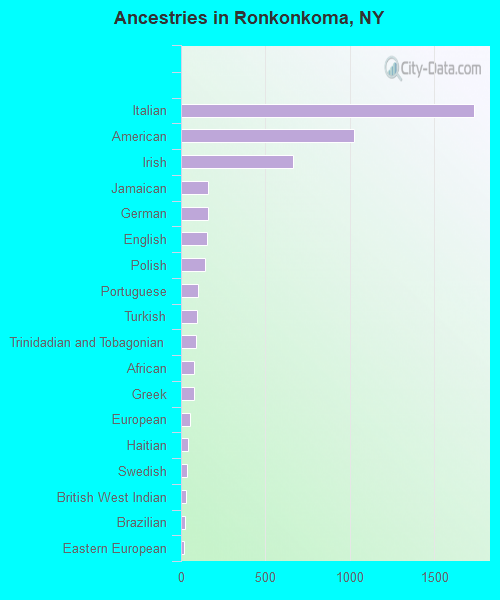
First ancestries reported:
Italian: 1,737 (21.1%)
American: 1,024 (12.5%)
Irish: 666 (8.1%)
Jamaican: 162 (2.0%)
German: 157 (1.9%)
English: 154 (1.9%)
Polish: 142 (1.7%)
Portuguese: 100 (1.2%)
Turkish: 92 (1.1%)
Trinidadian and Tobagonian: 89 (1.1%)
African: 79 (1.0%)
Greek: 76 (0.9%)
European: 56 (0.7%)
Haitian: 40 (0.5%)
Swedish: 33 (0.4%)
British West Indian: 27 (0.3%)
Brazilian: 23 (0.3%)
Eastern European: 20 (0.2%)
Ghanaian: 14 (0.2%)
Romanian: 10 (0.1%)
Hungarian: 8 (0.10%)
Scottish: 7 (0.09%)
Czech: 6 (0.07%)
Czechoslovakian: 5 (0.06%)
French: 5 (0.06%)
French Canadian: 5 (0.06%)
Iranian: 5 (0.06%)
Norwegian: 5 (0.06%)
Danish: 4 (0.05%)
Russian: 4 (0.05%) Most common places of birth for foreign-born residents (%): Pakistan Ronkonkoma:
18.3% (496)New York:
1.4% (62,442)
Bangladesh Ronkonkoma:
11.5% (313)New York:
2.6% (117,288)
India Ronkonkoma:
9.2% (250)New York:
3.5% (158,432)
Ecuador Ronkonkoma:
5.7% (155)New York:
3.9% (177,448)
Guatemala Ronkonkoma:
5.2% (142)New York:
1.4% (61,245)
Dominican Republic Ronkonkoma:
4.8% (130)New York:
11.1% (501,040)
Colombia Ronkonkoma:
4.8% (130)New York:
2.5% (111,920)
China, excluding Hong Kong and Taiwan Ronkonkoma:
4.5% (123)New York:
9.1% (410,910)
Cuba Ronkonkoma:
4.5% (122)New York:
0.5% (23,242)
El Salvador Ronkonkoma:
3.5% (95)New York:
2.4% (108,067)
Trinidad and Tobago Ronkonkoma:
3.4% (93)New York:
2.0% (91,428)
Turkey Ronkonkoma:
3.1% (85)New York:
0.5% (21,009)
Portugal Ronkonkoma:
2.8% (76)New York:
0.2% (10,519)
Argentina Ronkonkoma:
2.2% (59)New York:
0.5% (21,928)
Greece Ronkonkoma:
1.7% (45)New York:
0.6% (28,604)
Place of birth for U.S.-born residents:
This state: 14,162Other state: 1,470Northeast: 217Midwest: 137South: 360West: 858 89.8% of Ronkonkoma residents lived in the same house 1 years ago.
Out of people who lived in different houses, 43.3% lived in this county.
Out of people who lived in different counties, 84.3% lived in New York.
Ronkonkoma:
89.8%State average:
89.6%
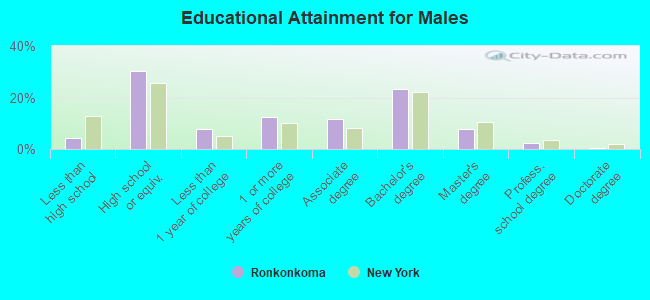
Education attainment for males 25 years and older:
No schooling: 61Nursery to 4th grade: 195th and 6th grade: 247th and 8th grade: 259th grade: 010th grade: 011th grade: 5412th grade, no diploma: 91High school graduate (or equivalency): 1,939Less than 1 year of college: 484Some college more than 1 year, no degree: 805Associate degree: 731Bachelor's degree: 1,489Master's degree: 501Professional school degree: 141Doctorate degree: 17
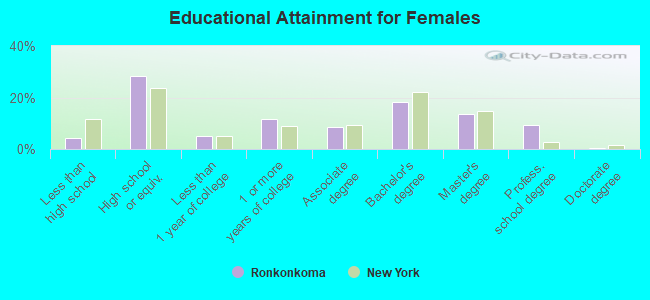
Education attainment for females 25 years and older:
No schooling: 50Nursery to 4th grade: 255th and 6th grade: 627th and 8th grade: 429th grade: 010th grade: 511th grade: 2912th grade, no diploma: 86High school graduate (or equivalency): 1,901Less than 1 year of college: 347Some college more than 1 year, no degree: 797Associate degree: 563Bachelor's degree: 1,238Master's degree: 922Professional school degree: 639Doctorate degree: 27
Housing units in structures:
One, detached: 5,111One, attached: 23Two: 2423 or 4: 3215 to 9: 22110 to 19: 43120 to 49: 11050 or more: 108Housing units lacking complete plumbing facilities in 2022: 0.7%Housing units lacking complete kitchen facilities in 2022: 0.9%House/condo owner moved in on average 18 years ago
Renter moved in on average 3 years ago
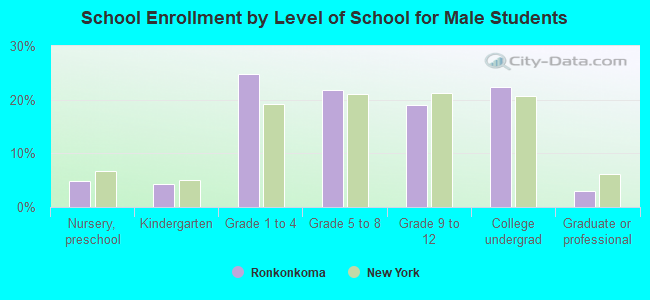
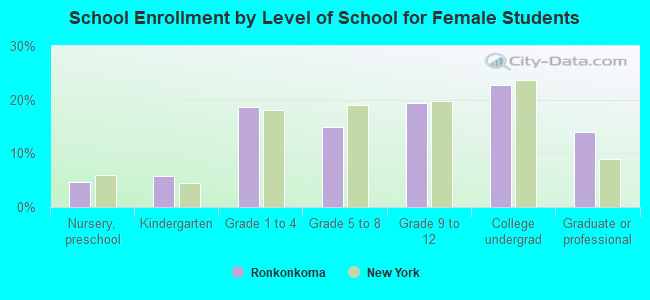
Private vs. public school enrollment:
Students in private schools in grades 1 to 8 (elementary and middle school): 44 Students in private schools in grades 9 to 12 (high school): 30 Students in private undergraduate colleges: 200