Rosenberg, TX (Texas) Houses and Residents
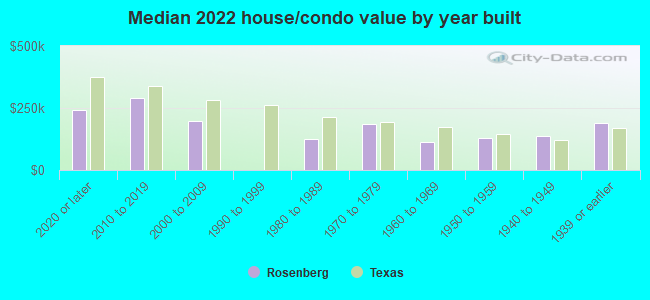
| Rosenberg: | $222,310 |
| Texas: | $275,400 |
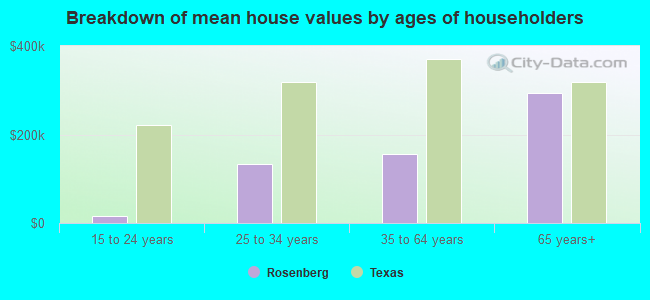
Mean price in 2022:
Detached houses: $210,513
Here: $210,513 State: $369,058 Townhouses or other attached units: $301,855
Here: $301,855 State: $327,631 Mobile homes: $85,557
Here: $85,557 State: $124,413
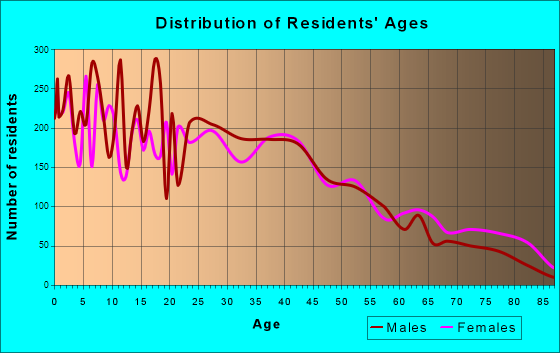
Total population: 34,468 (Urban population: 23,527, Rural population: 648 (4 farm, 644 nonfarm))
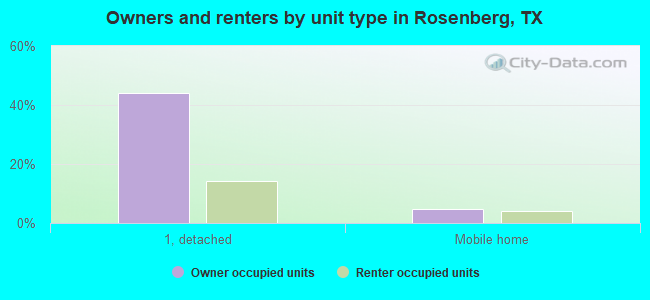
Houses: 16,597 (15,535 occupied: 8,417 owner occupied, 7,251 renter occupied)
| % of renters here: | 46% |
| State: | 38% |
Housing density: 781 houses/condos per square mile
Median price asked for vacant for-sale houses and condos in 2022: $276,423.
Median contract rent in 2022: $1,124 (lower quartile is $773, upper quartile is $1,412)
Median rent asked for vacant for-rent units in 2022: $1,616
Median gross rent in Rosenberg, TX in 2022: $1,315
Housing units in Rosenberg with a mortgage: 5,122 (62 second mortgage, 0 home equity loan, 72 both second mortgage and home equity loan)
Houses without a mortgage: 26
Median household income for houses/condos with a mortgage: $79,897
Median household income for apartments without a mortgage: $72,436
Median monthly housing costs: $1,269
Compare current foreclosures near Rosenberg, TX:
| Photo | Address | Area | Beds / Baths | Price | Details |
|---|---|---|---|---|---|

|
#1
Taylan Ln
Rosenberg, TX 77471
|
1,816 sq. feet
|
2 baths 4 beds |
show details | |

|
#2
7th St
Rosenberg, TX 77471
|
1,606 sq. feet
|
- baths 3 beds |
show details | |

|
#3
Franklin Cir
Rosenberg, TX 77471
|
1,973 sq. feet
|
- baths 4 beds |
show details | |

|
#4
Dogwood Knoll Trl
Rosenberg, TX 77471
|
2,242 sq. feet
|
- baths 4 beds |
show details | |

|
#5
Oxford Lake Dr
Rosenberg, TX 77471
|
2,636 sq. feet
|
- baths 4 beds |
show details | |

|
#6
Avenue E
Rosenberg, TX 77471
|
1,468 sq. feet
|
- baths 3 beds |
show details | |

|
#7
Desert Palms Ln
Rosenberg, TX 77471
|
2,910 sq. feet
|
- baths 4 beds |
show details | |

|
#8
Desert Oasis Ln
Rosenberg, TX 77471
|
1,370 sq. feet
|
- baths 3 beds |
show details | |

|
#9
Greenwood Dr
Rosenberg, TX 77471
|
1,288 sq. feet
|
- baths 3 beds |
show details | |

|
#10
Dawn Light Dr
Rosenberg, TX 77471
|
- sq. feet
|
- baths - beds |
show details |
| Photo | Address | Area | Beds / Baths | Price | Details |
|---|---|---|---|---|---|

|
#11
Town Center Blvd, Apt 2138
Rosenberg, TX 77471
|
- sq. feet
|
- baths - beds |
show details | |

|
#12
Vista Dr Apt 6202
Rosenberg, TX 77471
|
- sq. feet
|
- baths - beds |
show details | |

|
#13
Avenue G Unit 61
Rosenberg, TX 77471
|
- sq. feet
|
- baths - beds |
show details | |

|
#14
Hartledge Rd
Rosenberg, TX 77471
|
- sq. feet
|
- baths - beds |
show details | |

|
#15
Orange Blossom Ln
Rosenberg, TX 77471
|
- sq. feet
|
- baths - beds |
show details | |

|
#16
Coachmaker Trl
Rosenberg, TX 77471
|
- sq. feet
|
- baths - beds |
show details | |

|
#17
Finwood Dr
Rosenberg, TX 77471
|
- sq. feet
|
- baths - beds |
show details | |

|
#18
Marick Rd
Rosenberg, TX 77471
|
- sq. feet
|
- baths - beds |
show details | |

|
#19
Kent Valley Ln
Rosenberg, TX 77471
|
- sq. feet
|
- baths - beds |
show details | |

|
#20
Premier Cir
Rosenberg, TX 77471
|
- sq. feet
|
- baths - beds |
show details |
| Photo | Address | Area | Beds / Baths | Price | Details |
|---|---|---|---|---|---|

|
#21
Sandstone Creek Ln
Rosenberg, TX 77471
|
- sq. feet
|
- baths - beds |
show details | |

|
#22
Carlisle St
Rosenberg, TX 77471
|
3,396 sq. feet
|
- baths - beds |
show details | |

|
#23
Brooks Ave Apt 412
Rosenberg, TX 77471
|
- sq. feet
|
- baths - beds |
show details | |

|
#24
Avenue H
Rosenberg, TX 77471
|
- sq. feet
|
- baths - beds |
show details | |

|
#25
Humble Way
Rosenberg, TX 77471
|
- sq. feet
|
- baths - beds |
show details | |

|
#26
Prince Place Dr
Rosenberg, TX 77471
|
- sq. feet
|
- baths - beds |
show details | |

|
#27
Meadowview Dr
Missouri City, TX 77459
|
1,845 sq. feet
|
2 baths 3 beds |
$284,900
|
show details |

|
#28
Seabourne Meadows Dr
Rosenberg, TX 77471
|
- sq. feet
|
- baths - beds |
show details | |

|
#29
Southwest Fwy # 59
Rosenberg, TX 77471
|
- sq. feet
|
- baths - beds |
show details | |

|
#30
Meadowhollow Dr
Stafford, TX 77477
|
1,884 sq. feet
|
2 baths 3 beds |
show details |
| Photo | Address | Area | Beds / Baths | Price | Details |
|---|---|---|---|---|---|

|
#31
Peninsulas Dr
Missouri City, TX 77459
|
3,863 sq. feet
|
3 baths 4 beds |
show details | |

|
#32
Crow Valley Dr # 706
Missouri City, TX 77459
|
2,052 sq. feet
|
2 baths 4 beds |
show details | |

|
#33
Dancing Daisy Lane
Richmond, TX 77406
|
1,908 sq. feet
|
2 baths 4 beds |
show details | |

|
#34
Park Knoll Ln
Katy, TX 77450
|
2,460 sq. feet
|
2 baths 4 beds |
show details | |

|
#35
Clarewood Dr
Houston, TX 77083
|
1,979 sq. feet
|
2 baths 4 beds |
show details | |

|
#36
Indian Ridge Ct
Katy, TX 77450
|
1,879 sq. feet
|
2 baths 4 beds |
show details | |

|
#37
Plumbrook Dr
Houston, TX 77099
|
1,572 sq. feet
|
2 baths 3 beds |
show details | |

|
#38
Windsor Ct
Missouri City, TX 77459
|
1,676 sq. feet
|
2 baths 3 beds |
show details | |

|
#39
Pool Hill Rd
Brookshire, TX 77423
|
2,435 sq. feet
|
2 baths 3 beds |
show details | |

|
#40
Monarch Falls Ln
Richmond, TX 77469
|
2,325 sq. feet
|
3 baths 4 beds |
show details |
| Photo | Address | Area | Beds / Baths | Price | Details |
|---|---|---|---|---|---|

|
#41
Wakefield Meadow Ct
Richmond, TX 77407
|
3,448 sq. feet
|
4 baths 5 beds |
show details | |

|
#42
Modesto Dr
Houston, TX 77083
|
2,546 sq. feet
|
2 baths 4 beds |
show details | |

|
#43
Hamilton Crest
Brookshire, TX 77423
|
- sq. feet
|
2 baths 4 beds |
show details | |

|
#44
Baileywood Dr
Richmond, TX 77407
|
3,438 sq. feet
|
2 baths 4 beds |
show details | |

|
#45
Elizabeth Brook Dr
Richmond, TX 77406
|
1,652 sq. feet
|
2 baths 3 beds |
show details | |

|
#46
Knightsbridge Blvd
Sugar Land, TX 77479
|
3,252 sq. feet
|
2 baths 4 beds |
show details | |

|
#47
Wild Jasmine Ln
Katy, TX 77450
|
2,571 sq. feet
|
2 baths 4 beds |
show details | |

|
#48
Camden Heights Lane
Richmond, TX 77407
|
1,516 sq. feet
|
2 baths 3 beds |
show details | |

|
#49
Colony Chase Court
Richmond, TX 77407
|
2,790 sq. feet
|
2 baths 3 beds |
show details | |

|
Check over 1 million property listings on Foreclosure.com!
|
browse all offers | |||

Latest news about housing in Rosenberg, TX collected exclusively by city-data.com from local newspapers, TV, and radio stations

 | why are Houston houses so cheap? (121 replies) |
| Rosenberg New construction Homes (6 replies) |
| Purchasing Home - Areas to Consider - Sugar Land Richmond Rosenberg (1 reply) |
| Flooding Concerns in South Rosenberg (2 replies) |
| Newer Neighborhoods in Rosenberg? Thoughts? (16 replies) |
| Apartments in Fulshear (12 replies) |
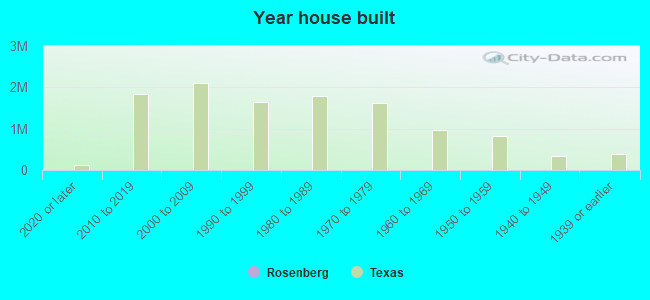
Median year apartment built: 1989
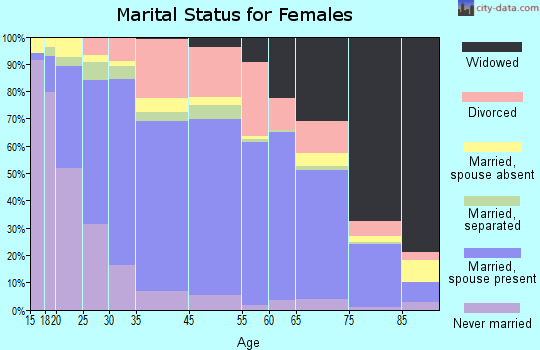
Household type by relationship:
Households: 41,351- Male householders: 7,875 (2,713 living alone), Female householders: 7,442 (1,810 living alone)
6,782 spouses (6,782 opposite-sex spouses), 950 unmarried partners, (850 opposite-sex unmarried partners), 12,382 children (11,462 natural, 149 adopted, 769 stepchildren), 1,721 grandchildren, 832 brothers or sisters, 1,196 parents, 0 foster children, 958 other relatives, 978 non-relatives
- In group quarters: 230
Size of family households: 3,396 2-persons, 2,881 3-persons, 1,748 4-persons, 1,587 5-persons, 351 6-persons, 399 7-or-more-persons.
Size of nonfamily households: 4,904 1-person, 444 2-persons, 324 3-persons.
4,485 married couples with children.
3,768 single-parent households (571 men, 3,197 women).
52.1% of residents of Rosenberg speak English at home.
39.6% of residents speak Spanish at home (63% speak English very well, 18% speak English well, 12% speak English not well, 7% don't speak English at all).
2.1% of residents speak other Indo-European language at home (71% speak English very well, 19% speak English well, 2% speak English not well, 8% don't speak English at all).
6.2% of residents speak Asian or Pacific Island language at home (54% speak English very well, 27% speak English well, 19% speak English not well).
0.5% of residents speak other language at home (85% speak English very well, 15% speak English well).
Foreign born population: 10,110 (24.4%)
(47.5% of them are naturalized citizens)
| Here: | 5.8 |
| State: | 6.3 |
| Here: | 4.3 |
| State: | 4.0 |
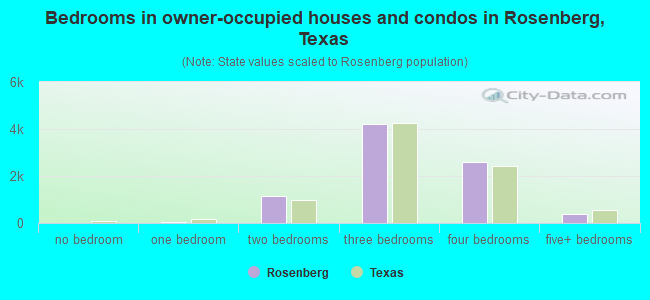
- Bedrooms in owner-occupied houses and condos in Rosenberg, Texas
- 0no bedroom
- 521 bedroom
- 1,1592 bedrooms
- 4,2113 bedrooms
- 2,6044 bedrooms
- 3915+ bedrooms
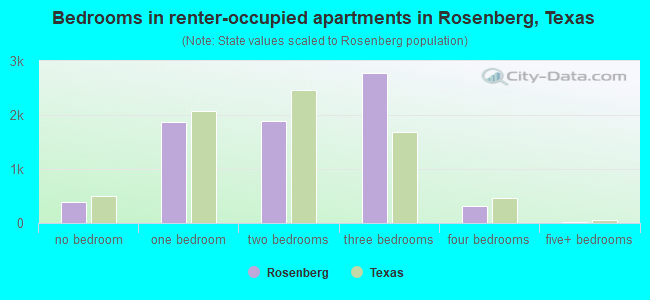
- Bedrooms in renter-occupied apartments in Rosenberg, Texas
- 392no bedroom
- 1,8721 bedroom
- 1,8852 bedrooms
- 2,7713 bedrooms
- 3164 bedrooms
- 145+ bedrooms
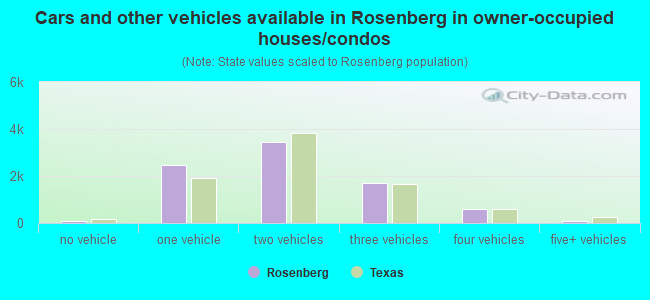
- Cars and other vehicles available in Rosenberg in owner-occupied houses/condos
- 85no vehicle
- 2,4831 vehicle
- 3,4682 vehicles
- 1,6823 vehicles
- 6104 vehicles
- 905+ vehicles
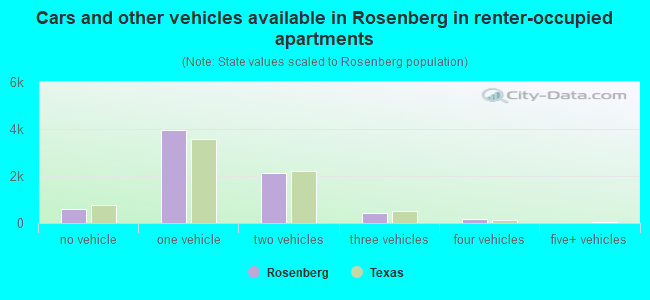
- Cars and other vehicles available in Rosenberg in renter-occupied apartments
- 591no vehicle
- 3,9631 vehicle
- 2,1222 vehicles
- 4243 vehicles
- 1514 vehicles
- 05+ vehicles
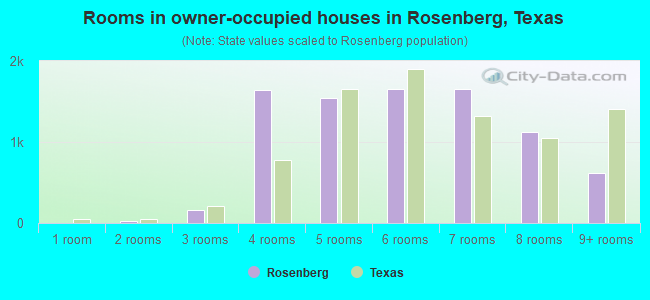
- Rooms in owner-occupied houses in Rosenberg, Texas
- 01 room
- 202 rooms
- 1593 rooms
- 1,6414 rooms
- 1,5495 rooms
- 1,6536 rooms
- 1,6547 rooms
- 1,1228 rooms
- 6209+ rooms
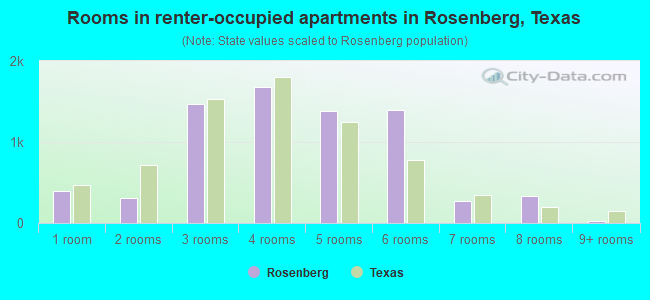
- Rooms in renter-occupied apartments in Rosenberg, Texas
- 3921 room
- 3052 rooms
- 1,4643 rooms
- 1,6814 rooms
- 1,3875 rooms
- 1,3906 rooms
- 2757 rooms
- 3368 rooms
- 219+ rooms
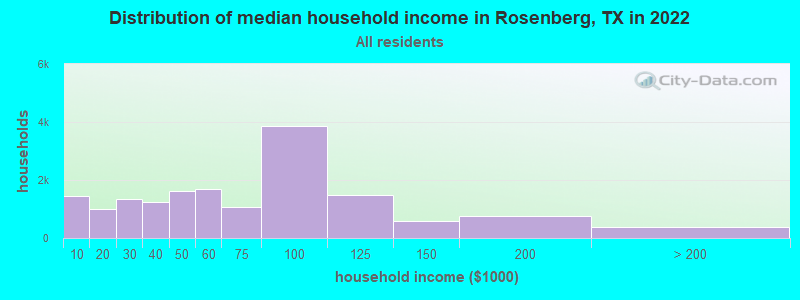
Rosenberg, TX household income distribution

- 1,450Less than $10,000
- 1,016$10,000 to $19,999
- 1,339$20,000 to $29,999
- 1,249$30,000 to $39,999
- 1,624$40,000 to $49,999
- 1,684$50,000 to $59,999
- 1,069$60,000 to $74,999
- 3,877$75,000 to $99,999
- 1,487$100,000 to $124,999
- 592$125,000 to $149,999
- 758$150,000 to $199,999
- 371$200,000 or more
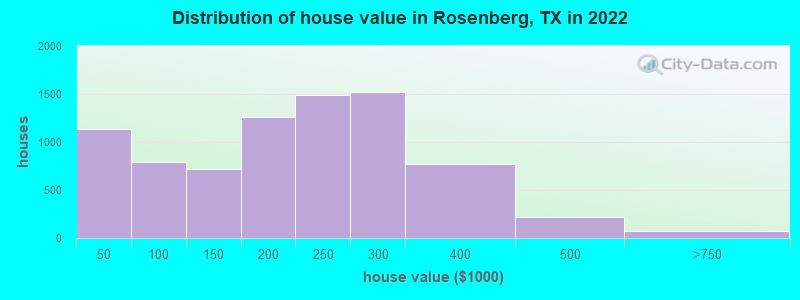
Home value of owner - occupied houses in 2022 in Rosenberg, TX
-
- 483Less than $10,000
- 75$10,000 to $14,999
- 19$15,000 to $19,999
- 79$20,000 to $24,999
- 241$25,000 to $29,999
- 29$30,000 to $34,999
- 48$35,000 to $39,999
- 161$40,000 to $49,999
- 24$50,000 to $59,999
- 119$60,000 to $69,999
- 183$70,000 to $79,999
- 252$80,000 to $89,999
- 55$90,000 to $99,999
- 526$100,000 to $124,999
- 193$125,000 to $149,999
- 792$150,000 to $174,999
- 468$175,000 to $199,999
- 1,488$200,000 to $249,999
- 1,522$250,000 to $299,999
- 773$300,000 to $399,999
- 221$400,000 to $499,999
- 68$500,000 to $749,999
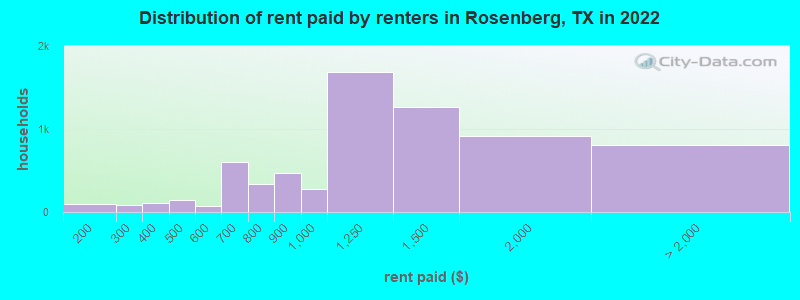
Rent paid by renters in 2022 in Rosenberg, TX
-
- 70$100 to $149
- 25$150 to $199
- 53$200 to $249
- 29$250 to $299
- 58$300 to $349
- 49$350 to $399
- 144$400 to $449
- 13$500 to $549
- 54$550 to $599
- 436$600 to $649
- 172$650 to $699
- 204$700 to $749
- 128$750 to $799
- 473$800 to $899
- 281$900 to $999
- 1,683$1,000 to $1,249
- 1,262$1,250 to $1,499
- 915$1,500 to $1,999
- 79$2,000 to $2,499
- 732No cash rent
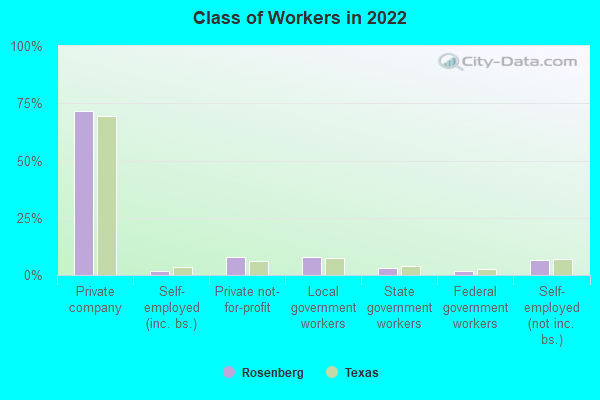
Percentage of workers working in this county: 70.9%
Number of people working at home: 1,661 (8.1% of all workers)
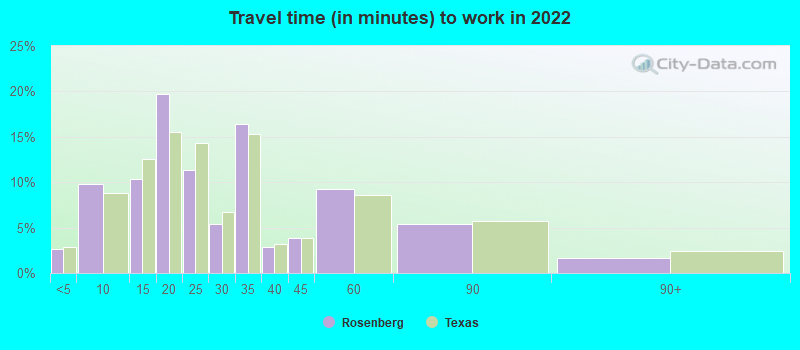
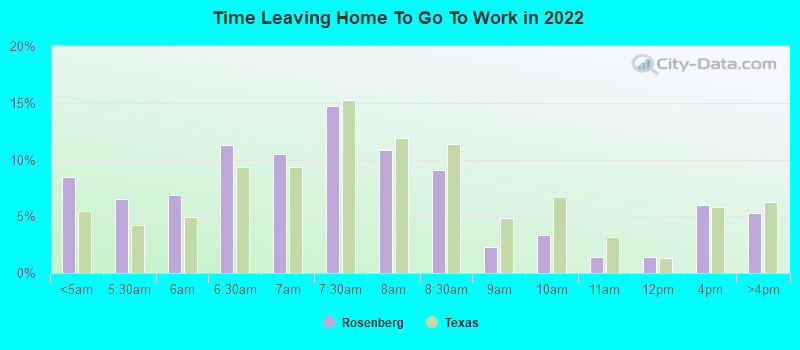
Travel time to work (commute)
- Less than 5 minutes: 531
- 5 to 9 minutes: 1,748
- 10 to 14 minutes: 1,755
- 15 to 19 minutes: 2,497
- 20 to 24 minutes: 1,520
- 25 to 29 minutes: 756
- 30 to 34 minutes: 3,115
- 35 to 39 minutes: 718
- 40 to 44 minutes: 1,342
- 45 to 59 minutes: 2,735
- 60 to 89 minutes: 1,236
- 90 or more minutes: 238
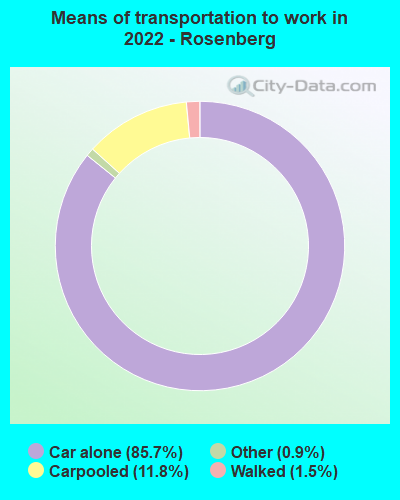
Means of transportation to work:
- Drove a car alone: 15,698 (75.1%)
- Carpooled: 2,542 (12.2%)
- Taxi: 208 (1.0%)
- Bicycle: 8 (0.0%)
- Walked: 373 (1.8%)
- Worked at home: 1,661 (7.9%)
- Unemployment by race in 2022
- Unemployment rate for White non-Hispanic residents
- 0.6%Males
- 2.3%Females
- Unemployment rate for Black residents
- 4.3%Females
- Unemployment rate for Asian residents
- 1.6%Females
- Unemployment rate for other race residents
- 0.5%Males
- 0.5%Females
- Unemployment rate for two or more race residents
- 2.7%Males
- 11.7%Females
- Unemployment rate for Hispanic or Latino residents
- 1.5%Males
- 9.0%Females
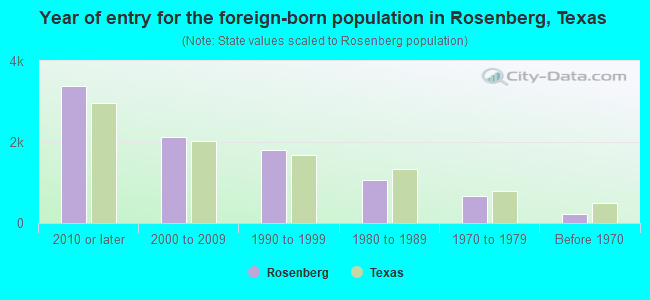
- Year of entry for the foreign-born population in Rosenberg, Texas
- 3,3752010 or later
- 2,1352000 to 2009
- 1,8121990 to 1999
- 1,0721980 to 1989
- 6561970 to 1979
- 223Before 1970
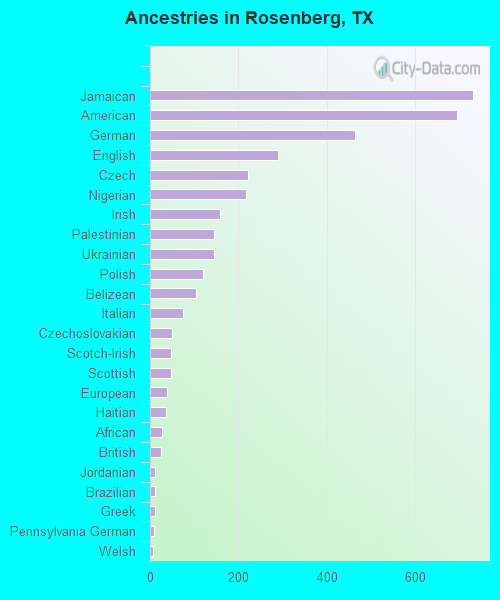
First ancestries reported:
- Jamaican: 731 (2.5%)
- American: 694 (2.4%)
- German: 465 (1.6%)
- English: 289 (1.0%)
- Czech: 222 (0.8%)
- Nigerian: 217 (0.8%)
- Irish: 158 (0.5%)
- Palestinian: 145 (0.5%)
- Ukrainian: 145 (0.5%)
- Polish: 121 (0.4%)
- Belizean: 104 (0.4%)
- Italian: 75 (0.3%)
- Czechoslovakian: 49 (0.2%)
- Scotch-Irish: 48 (0.2%)
- Scottish: 47 (0.2%)
- European: 38 (0.1%)
- Haitian: 36 (0.1%)
- African: 27 (0.09%)
- British: 24 (0.08%)
- Jordanian: 12 (0.04%)
- Brazilian: 12 (0.04%)
- Greek: 12 (0.04%)
- Pennsylvania German: 9 (0.03%)
- Welsh: 7 (0.02%)
- Norwegian: 5 (0.02%)
- Swedish: 5 (0.02%)
- French: 4 (0.01%)
- Northern European: 4 (0.01%)
Most common places of birth for foreign-born residents (%):
| Rosenberg: | 37.4% (3,639) |
| Texas: | 48.4% (2,411,723) |
| Rosenberg: | 16.3% (1,590) |
| Texas: | 2.1% (103,148) |
| Rosenberg: | 7.6% (736) |
| Texas: | 1.5% (72,413) |
| Rosenberg: | 5.7% (556) |
| Texas: | 4.5% (224,455) |
| Rosenberg: | 5.1% (494) |
| Texas: | 0.3% (13,763) |
| Rosenberg: | 3.9% (380) |
| Texas: | 0.4% (17,748) |
| Rosenberg: | 3.7% (363) |
| Texas: | 1.2% (62,159) |
| Rosenberg: | 3.7% (360) |
| Texas: | 3.7% (184,770) |
| Rosenberg: | 3.3% (319) |
| Texas: | 1.2% (61,555) |
| Rosenberg: | 2.2% (212) |
| Texas: | 3.0% (147,182) |
| Rosenberg: | 1.9% (184) |
| Texas: | 1.9% (96,110) |
| Rosenberg: | 1.6% (160) |
| Texas: | 0.2% (12,456) |
Place of birth for U.S.-born residents:
- This state: 24,775
- Other state: 5,694
- Northeast: 1,026
- Midwest: 1,590
- South: 1,773
- West: 1,309
87.0% of Rosenberg residents lived in the same house 1 years ago.
Out of people who lived in different houses, 35.9% lived in this county.
Out of people who lived in different counties, 58.9% lived in Texas.
| Rosenberg: | 87.0% |
| State average: | 85.7% |
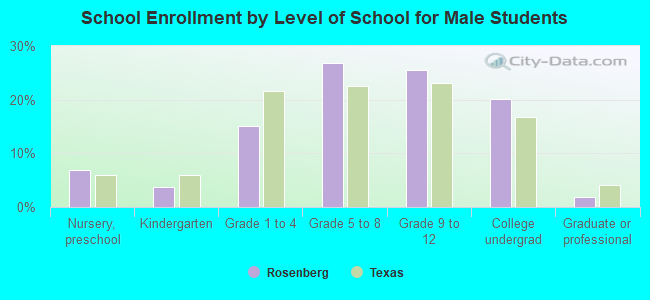
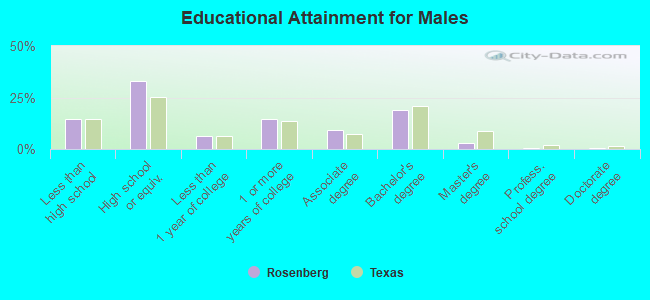
Education attainment for males 25 years and older:
- No schooling: 242
- Nursery to 4th grade: 68
- 5th and 6th grade: 378
- 7th and 8th grade: 96
- 9th grade: 185
- 10th grade: 236
- 11th grade: 244
- 12th grade, no diploma: 391
- High school graduate (or equivalency): 4,174
- Less than 1 year of college: 791
- Some college more than 1 year, no degree: 1,858
- Associate degree: 1,169
- Bachelor's degree: 2,367
- Master's degree: 351
- Professional school degree: 48
- Doctorate degree: 40
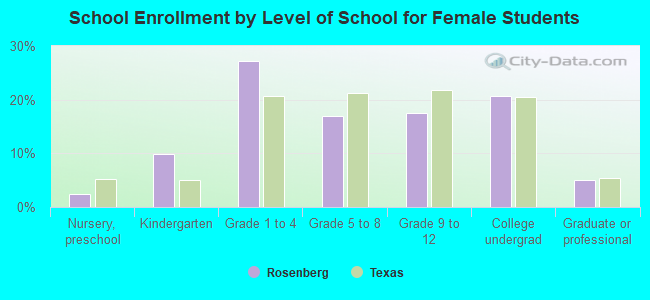
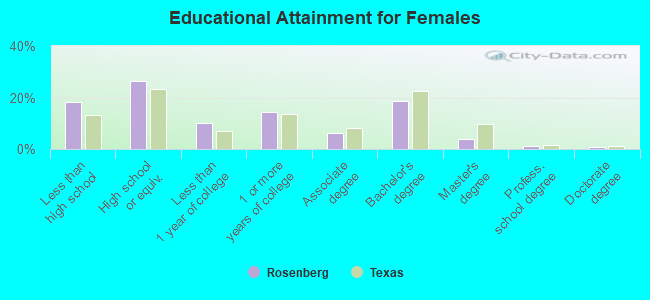
Education attainment for females 25 years and older:
- No schooling: 428
- Nursery to 4th grade: 58
- 5th and 6th grade: 498
- 7th and 8th grade: 111
- 9th grade: 225
- 10th grade: 330
- 11th grade: 427
- 12th grade, no diploma: 108
- High school graduate (or equivalency): 3,210
- Less than 1 year of college: 1,224
- Some college more than 1 year, no degree: 1,745
- Associate degree: 752
- Bachelor's degree: 2,237
- Master's degree: 488
- Professional school degree: 144
- Doctorate degree: 103
Housing units in structures:
- One, detached: 10,143
- One, attached: 732
- Two: 187
- 3 or 4: 1,091
- 5 to 9: 905
- 10 to 19: 918
- 20 to 49: 639
- 50 or more: 620
- Mobile homes: 1,359
Median worth of mobile homes: $27,578
Housing units lacking complete kitchen facilities in 2022: 2.0%
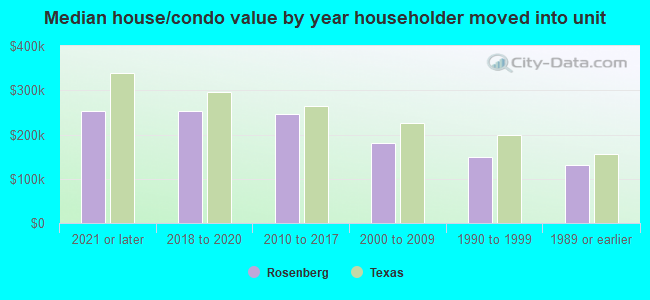
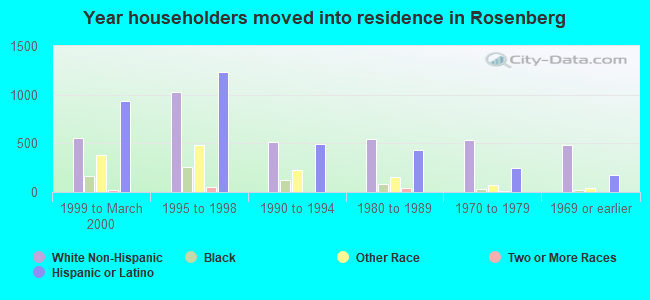
House/condo owner moved in on average 8 years ago
Renter moved in on average 3 years ago
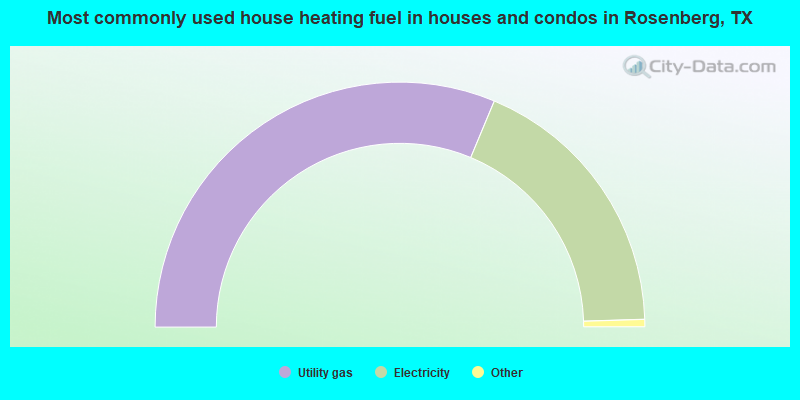
- 62.6%Utility gas
- 36.4%Electricity
- 0.9%Bottled, tank, or LP gas
- 0.1%No fuel used
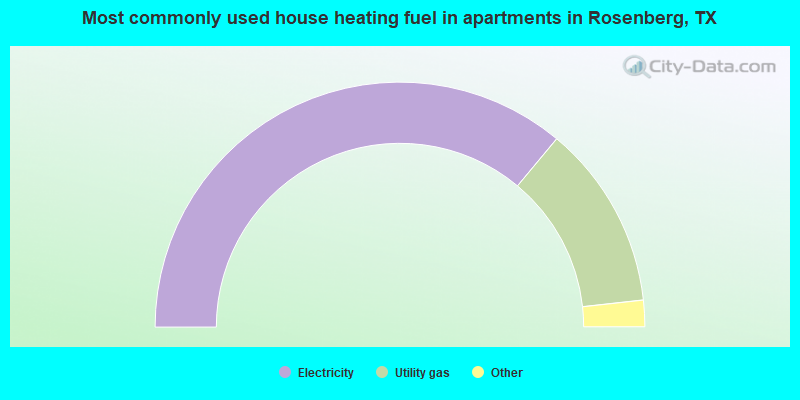
- 72.2%Electricity
- 24.4%Utility gas
- 3.1%No fuel used
- 0.3%Bottled, tank, or LP gas
Private vs. public school enrollment:
| Here: | 6.8% |
| Texas: | 8.8% |
| Here: | 4.5% |
| Texas: | 8.0% |
| Here: | 5.3% |
| Texas: | 16.2% |