Rutherford, NJ (New Jersey) Houses and Residents
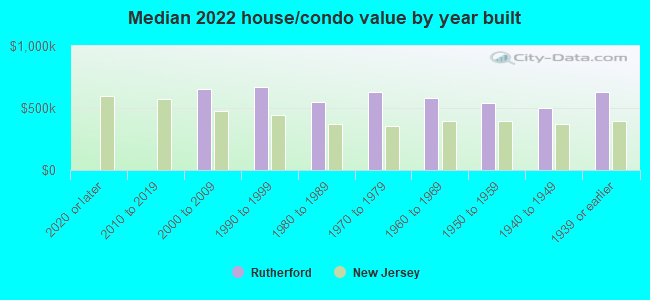
| Rutherford: | $589,729 |
| New Jersey: | $428,900 |
Mean price in 2022:
Detached houses: $699,650
Here: $699,650 State: $537,591 Townhouses or other attached units: $515,897
Here: $515,897 State: $381,113 In 2-unit structures: $535,774
Here: $535,774 State: $444,476 In 3-to-4-unit structures: $882,792
Here: $882,792 State: $457,463 In 5-or-more-unit structures: $324,655
Here: $324,655 State: $368,745
Total population: 18,464 (Urban population: 18,110, Rural population: 0)
Houses: 6,974 (6,797 occupied: 4,260 owner occupied, 2,573 renter occupied)
| % of renters here: | 38% |
| State: | 35% |
Housing density: 2,484 houses/condos per square mile
Median price asked for vacant for-sale houses and condos in 2022: $677,220.
Median contract rent in 2022: $1,567 (lower quartile is $1,175, upper quartile is $1,971)
Median rent asked for vacant for-rent units in 2022: $7,104
Median gross rent in Rutherford, NJ in 2022: $1,672
Housing units in Rutherford with a mortgage: 2,582 (281 second mortgage, 0 home equity loan, 290 both second mortgage and home equity loan)
Houses without a mortgage: 91
Median household income for houses/condos with a mortgage: $185,849
Median household income for apartments without a mortgage: $93,045
Median monthly housing costs: $1,921
Compare current foreclosures near Rutherford, NJ:
| Photo | Address | Area | Beds / Baths | Price | Details |
|---|---|---|---|---|---|

|
#1
State Rt 17
Rutherford, NJ 07070
|
- sq. feet
|
- baths - beds |
show details | |

|
#2
Riverview Ave
Rutherford, NJ 07070
|
1,910 sq. feet
|
- baths - beds |
show details | |

|
#3
Feronia Way
Rutherford, NJ 07070
|
- sq. feet
|
- baths - beds |
show details | |

|
#4
Francisco Ave
Rutherford, NJ 07070
|
1,502 sq. feet
|
- baths - beds |
show details | |

|
#5
Stuyvesant Ave
Rutherford, NJ 07070
|
2,203 sq. feet
|
- baths - beds |
show details | |

|
#6
Ridge Rd # 2b
Rutherford, NJ 07070
|
- sq. feet
|
- baths - beds |
show details | |

|
#7
Woodland Ave
Rutherford, NJ 07070
|
2,376 sq. feet
|
- baths - beds |
show details | |

|
#8
Jackson Ave
Rutherford, NJ 07070
|
1,915 sq. feet
|
- baths - beds |
show details | |

|
#9
Fairview Ave
Rutherford, NJ 07070
|
- sq. feet
|
- baths - beds |
show details | |

|
#10
Riverside Ave
Rutherford, NJ 07070
|
2,964 sq. feet
|
- baths - beds |
show details |
| Photo | Address | Area | Beds / Baths | Price | Details |
|---|---|---|---|---|---|

|
#11
Washington Ave
Rutherford, NJ 07070
|
2,163 sq. feet
|
- baths - beds |
show details | |

|
#12
Riverside Ave
Rutherford, NJ 07070
|
1,222 sq. feet
|
- baths - beds |
show details | |

|
#13
Insley Ave
Rutherford, NJ 07070
|
- sq. feet
|
- baths - beds |
show details | |

|
#14
Orient Way
Rutherford, NJ 07070
|
2,318 sq. feet
|
- baths - beds |
show details | |

|
#15
Sylvan St
Rutherford, NJ 07070
|
- sq. feet
|
- baths - beds |
show details | |

|
#16
Grand Ave
Rutherford, NJ 07070
|
1,210 sq. feet
|
- baths - beds |
show details | |

|
#17
Elliott Pl
Rutherford, NJ 07070
|
2,574 sq. feet
|
- baths - beds |
show details | |

|
#18
Riverside Ave
Rutherford, NJ 07070
|
2,244 sq. feet
|
- baths - beds |
show details | |

|
#19
Union Ave
Rutherford, NJ 07070
|
2,072 sq. feet
|
- baths - beds |
show details | |

|
#20
Marginal Rd
Rutherford, NJ 07070
|
1,482 sq. feet
|
- baths - beds |
show details |
| Photo | Address | Area | Beds / Baths | Price | Details |
|---|---|---|---|---|---|

|
#21
Meadow Rd
Rutherford, NJ 07070
|
- sq. feet
|
- baths - beds |
show details | |

|
#22
Mortimer Ave
Rutherford, NJ 07070
|
1,994 sq. feet
|
- baths - beds |
show details | |

|
#23
Monona Ave
Rutherford, NJ 07070
|
1,422 sq. feet
|
- baths - beds |
show details | |

|
#24
Mountain Way
Rutherford, NJ 07070
|
1,904 sq. feet
|
- baths - beds |
show details | |

|
#25
W Erie Ave
Rutherford, NJ 07070
|
- sq. feet
|
- baths - beds |
show details | |

|
#26
Wheaton Pl
Rutherford, NJ 07070
|
1,500 sq. feet
|
- baths - beds |
show details | |

|
#27
Daniel Ave
Rutherford, NJ 07070
|
1,275 sq. feet
|
- baths - beds |
show details | |

|
#28
Park Ave
Rutherford, NJ 07070
|
- sq. feet
|
- baths - beds |
show details | |

|
#29
Central Park Ave Apt 9m
Yonkers, NY 10710
|
1,300 sq. feet
|
2 baths 3 beds |
$319,900
|
show details |

|
#30
A Somers St
Brooklyn, NY 11233
|
1,830 sq. feet
|
2 baths 4 beds |
$749,900
|
show details |
| Photo | Address | Area | Beds / Baths | Price | Details |
|---|---|---|---|---|---|

|
#31
Olinville Ave Apt 11c
Bronx, NY 10467
|
1,000 sq. feet
|
2 baths 3 beds |
$385,000
|
show details |

|
#32
Fordham Hill Oval Apt 12d
Bronx, NY 10468
|
850 sq. feet
|
1 baths 1 beds |
$179,900
|
show details |

|
#33
Fordham Hill Oval
Bronx, NY 10468
|
700 sq. feet
|
1 baths 1 beds |
$154,900
|
show details |

|
#34
E 73rd St
New York, NY 10021
|
1,253 sq. feet
|
2 baths 2 beds |
$699,900
|
show details |

|
#35
Park Ave Apt 12
North Bergen, NJ 07047
|
835 sq. feet
|
1 baths 2 beds |
$379,900
|
show details |

|
#36
Ashland Ave
East Orange, NJ 07017
|
2,254 sq. feet
|
1 baths 5 beds |
$272,000
|
show details |

|
#37
E 52nd St Apt 4f
New York, NY 10022
|
700 sq. feet
|
1 baths 1 beds |
$689,900
|
show details |

|
#38
2nd Ave # 5c
New York, NY 10029
|
550 sq. feet
|
1 baths 1 beds |
$429,900
|
show details |

|
#39
W Sidney Ave
Mount Vernon, NY 10550
|
2,800 sq. feet
|
3 baths 8 beds |
$454,900
|
show details |

|
#40
E 32nd St Apt C7
Brooklyn, NY 11210
|
670 sq. feet
|
1 baths 1 beds |
$299,900
|
show details |
| Photo | Address | Area | Beds / Baths | Price | Details |
|---|---|---|---|---|---|

|
#41
Bloomfield Ave
Caldwell, NJ 07006
|
1,216 sq. feet
|
2 baths 2 beds |
$400,000
|
show details |

|
#42
17th Ave 1st Floor
Whitestone, NY 11357
|
610 sq. feet
|
1 baths 1 beds |
$229,900
|
show details |

|
#43
Swinton Ave
Bronx, NY 10465
|
1,938 sq. feet
|
2 baths 3 beds |
$789,900
|
show details |

|
#44
Huntington Rd
Union, NJ 07083
|
1,532 sq. feet
|
2 baths 3 beds |
$539,900
|
show details |

|
#45
90th St Apt 5d
Jackson Heights, NY 11372
|
1,000 sq. feet
|
1 baths 2 beds |
$269,900
|
show details |

|
#46
Horizon Rd Apt 803
Fort Lee, NJ 07024
|
843 sq. feet
|
1 baths 1 beds |
$178,900
|
show details |

|
#47
7th St
Ridgefield Park, NJ 07660
|
1,382 sq. feet
|
1 baths 3 beds |
$539,900
|
show details |

|
#48
Martin Dr
Harrington Park, NJ 07640
|
1,746 sq. feet
|
3 baths 3 beds |
$950,000
|
show details |

|
#49
S Orange Ave
Newark, NJ 07103
|
989 sq. feet
|
1 baths 2 beds |
$289,900
|
show details |

|
Check over 1 million property listings on Foreclosure.com!
|
browse all offers | |||

Latest news about housing in Rutherford, NJ collected exclusively by city-data.com from local newspapers, TV, and radio stations

 | East Rutherford/Rutherford Condos vs House? (4 replies) |
| Rutherford apartments/condos (3 replies) |
| Anyone stayed in Rutherford Heights Apartments? (3 replies) |
| The Monarch NJ Apartments (East Rutherford, NJ) Accross from the Meadowlands (4 replies) |
| Rutherford Flooding in the aftermath of Ida (0 replies) |
| Where to buy my starter home (6 replies) |
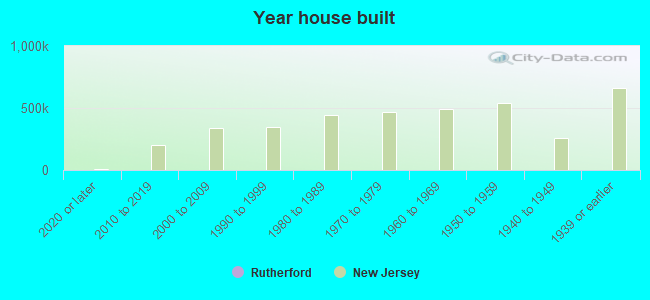
Median year apartment built: 1957
Household type by relationship:
Households: 18,749- Male householders: 3,112 (614 living alone), Female householders: 3,641 (955 living alone)
3,655 spouses (3,618 opposite-sex spouses), 661 unmarried partners, (650 opposite-sex unmarried partners), 5,721 children (5,514 natural, 51 adopted, 154 stepchildren), 350 grandchildren, 136 brothers or sisters, 265 parents, 0 foster children, 382 other relatives, 411 non-relatives
- In group quarters: 408
Size of family households: 1,567 2-persons, 1,383 3-persons, 1,178 4-persons, 539 5-persons, 78 6-persons, 36 7-or-more-persons.
Size of nonfamily households: 1,623 1-person, 368 2-persons, 4 3-persons, 65 5-persons.
2,606 married couples with children.
663 single-parent households (155 men, 508 women).
65.0% of residents of Rutherford speak English at home.
15.9% of residents speak Spanish at home (73% speak English very well, 14% speak English well, 12% speak English not well, 1% don't speak English at all).
9.7% of residents speak other Indo-European language at home (70% speak English very well, 21% speak English well, 4% speak English not well, 4% don't speak English at all).
7.6% of residents speak Asian or Pacific Island language at home (69% speak English very well, 16% speak English well, 13% speak English not well, 2% don't speak English at all).
0.8% of residents speak other language at home (92% speak English very well, 8% speak English well).
Foreign born population: 4,744 (25.3%)
(68.5% of them are naturalized citizens)
| Here: | 6.8 |
| State: | 6.8 |
| Here: | 4.1 |
| State: | 3.9 |
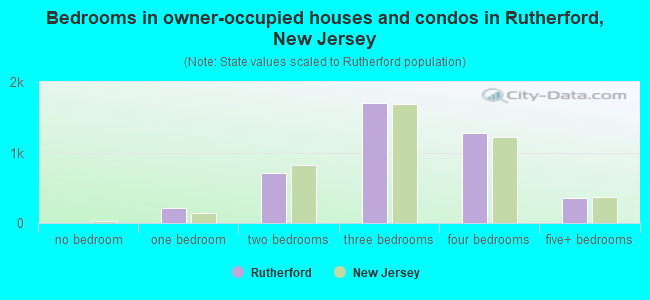
- Bedrooms in owner-occupied houses and condos in Rutherford, New Jersey
- 7no bedroom
- 2191 bedroom
- 7072 bedrooms
- 1,7003 bedrooms
- 1,2744 bedrooms
- 3545+ bedrooms
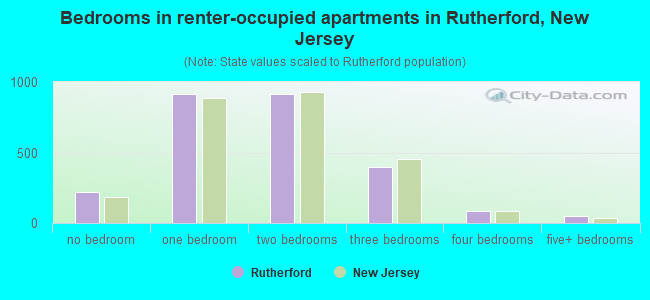
- Bedrooms in renter-occupied apartments in Rutherford, New Jersey
- 218no bedroom
- 9141 bedroom
- 9172 bedrooms
- 3953 bedrooms
- 824 bedrooms
- 505+ bedrooms
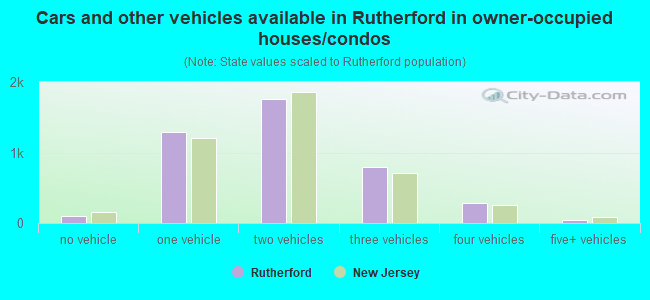
- Cars and other vehicles available in Rutherford in owner-occupied houses/condos
- 99no vehicle
- 1,2871 vehicle
- 1,7582 vehicles
- 7893 vehicles
- 2804 vehicles
- 475+ vehicles
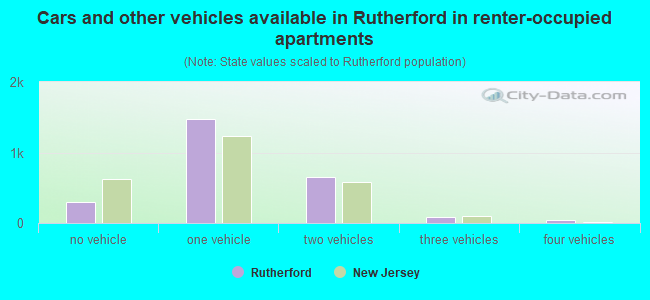
- Cars and other vehicles available in Rutherford in renter-occupied apartments
- 304no vehicle
- 1,4761 vehicle
- 6532 vehicles
- 923 vehicles
- 394 vehicles
- 105+ vehicles
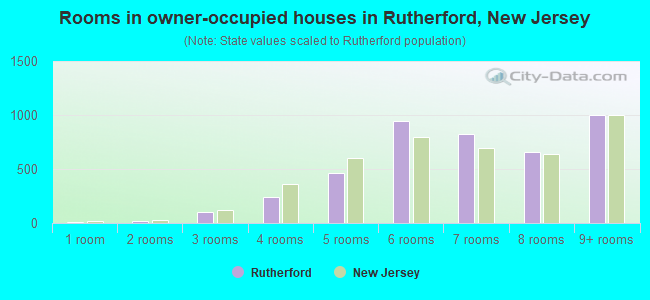
- Rooms in owner-occupied houses in Rutherford, New Jersey
- 71 room
- 182 rooms
- 993 rooms
- 2414 rooms
- 4625 rooms
- 9466 rooms
- 8287 rooms
- 6578 rooms
- 1,0039+ rooms
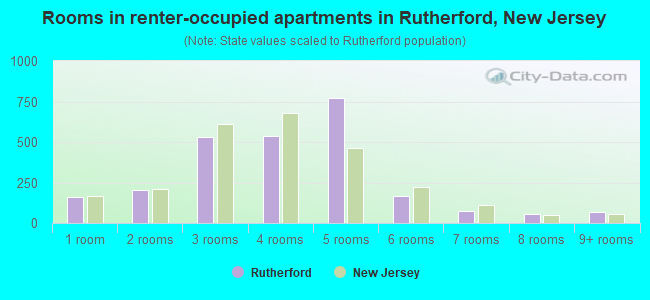
- Rooms in renter-occupied apartments in Rutherford, New Jersey
- 1601 room
- 2012 rooms
- 5333 rooms
- 5394 rooms
- 7745 rooms
- 1676 rooms
- 777 rooms
- 588 rooms
- 659+ rooms
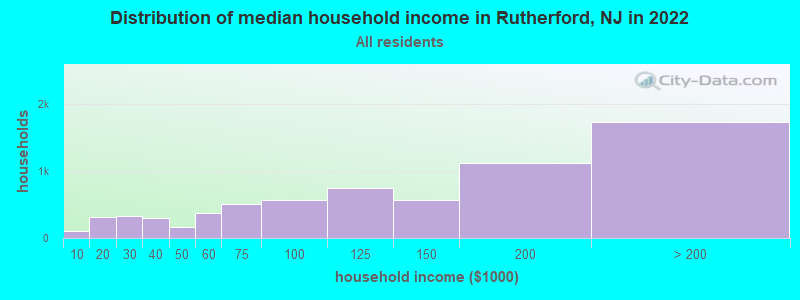
Rutherford, NJ household income distribution

- 112Less than $10,000
- 320$10,000 to $19,999
- 324$20,000 to $29,999
- 302$30,000 to $39,999
- 172$40,000 to $49,999
- 367$50,000 to $59,999
- 504$60,000 to $74,999
- 565$75,000 to $99,999
- 744$100,000 to $124,999
- 566$125,000 to $149,999
- 1,129$150,000 to $199,999
- 1,736$200,000 or more
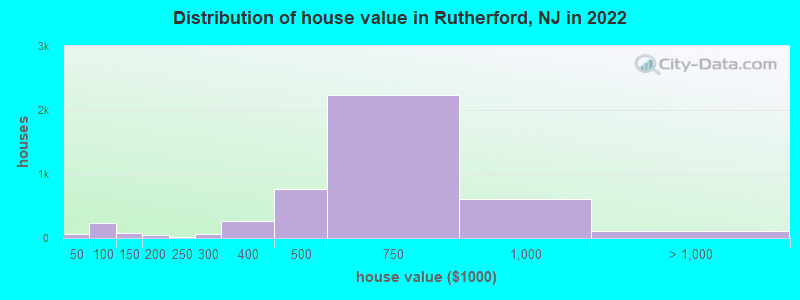
Home value of owner - occupied houses in 2022 in Rutherford, NJ
-
- 32Less than $10,000
- 16$25,000 to $29,999
- 17$40,000 to $49,999
- 83$50,000 to $59,999
- 135$60,000 to $69,999
- 73$100,000 to $124,999
- 24$150,000 to $174,999
- 15$175,000 to $199,999
- 15$200,000 to $249,999
- 63$250,000 to $299,999
- 260$300,000 to $399,999
- 761$400,000 to $499,999
- 2,232$500,000 to $749,999
- 616$750,000 to $999,999
- 104$1,000,000 to $1,499,999
- 9$2,000,000 or more
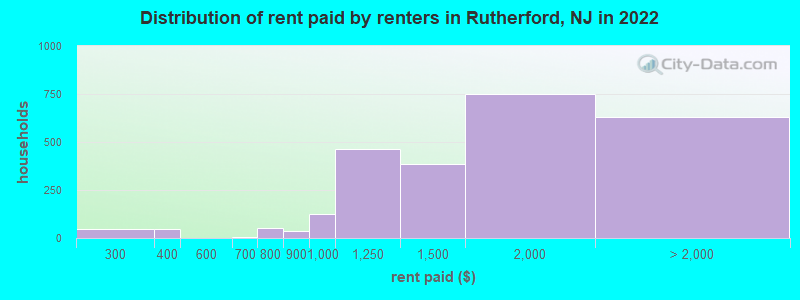
Rent paid by renters in 2022 in Rutherford, NJ
-
- 45$200 to $249
- 16$300 to $349
- 31$350 to $399
- 5$650 to $699
- 37$700 to $749
- 14$750 to $799
- 39$800 to $899
- 124$900 to $999
- 463$1,000 to $1,249
- 385$1,250 to $1,499
- 752$1,500 to $1,999
- 456$2,000 to $2,499
- 39$2,500 to $2,999
- 79$3,000 to $3,499
- 18$3,500 or more
- 38No cash rent
Percentage of workers working in this county: 53.6%
Number of people working at home: 2,179 (21.2% of all workers)
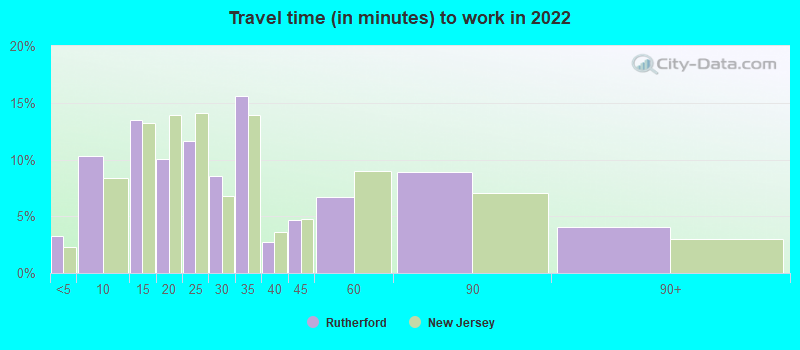
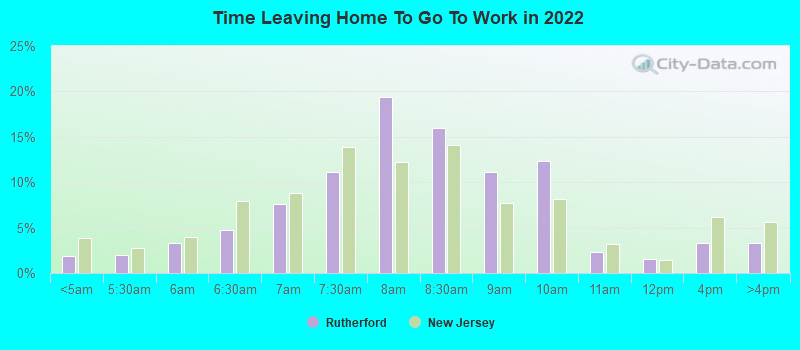
Travel time to work (commute)
- Less than 5 minutes: 210
- 5 to 9 minutes: 627
- 10 to 14 minutes: 1,138
- 15 to 19 minutes: 1,136
- 20 to 24 minutes: 652
- 25 to 29 minutes: 302
- 30 to 34 minutes: 933
- 35 to 39 minutes: 300
- 40 to 44 minutes: 446
- 45 to 59 minutes: 717
- 60 to 89 minutes: 1,324
- 90 or more minutes: 332
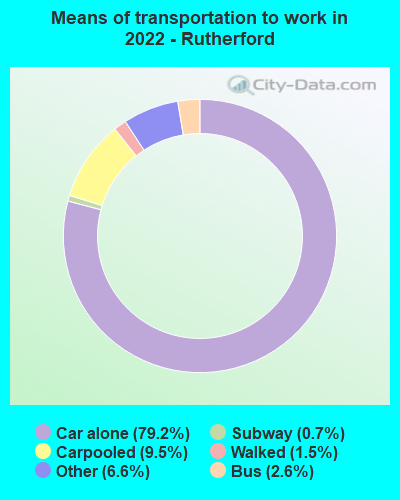
Means of transportation to work:
- Drove a car alone: 4,753 (58.4%)
- Carpooled: 681 (8.4%)
- Bus: 141 (1.7%)
- Long-distance train or commuter rail: 24 (0.3%)
- Taxi: 452 (5.6%)
- Walked: 95 (1.2%)
- Worked at home: 2,179 (26.8%)
- Unemployment by race in 2022
- Unemployment rate for White non-Hispanic residents
- 2.6%Males
- 2.9%Females
- Unemployment rate for Black residents
- 14.4%Females
- Unemployment rate for American Indian and Alaska Native residents
- 3.3%Males
- Unemployment rate for Asian residents
- 1.6%Females
- Unemployment rate for other race residents
- 8.6%Males
- 15.1%Females
- Unemployment rate for two or more race residents
- 1.3%Males
- 2.3%Females
- Unemployment rate for Hispanic or Latino residents
- 1.1%Males
- 3.2%Females
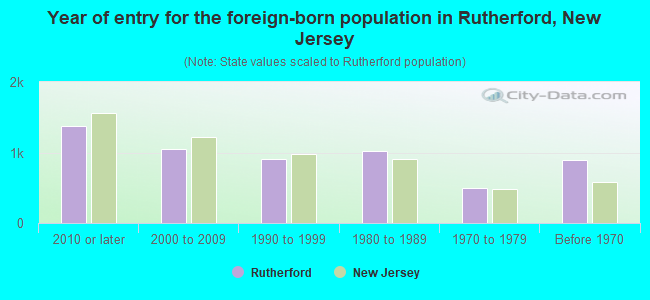
- Year of entry for the foreign-born population in Rutherford, New Jersey
- 1,3692010 or later
- 1,0452000 to 2009
- 9041990 to 1999
- 1,0281980 to 1989
- 4911970 to 1979
- 896Before 1970
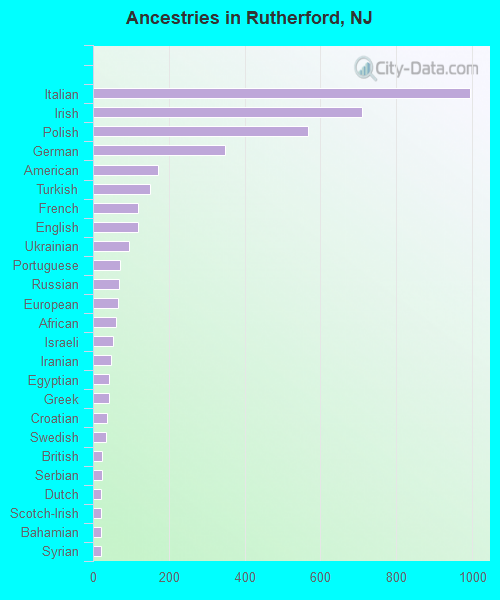
First ancestries reported:
- Italian: 995 (10.8%)
- Irish: 709 (7.7%)
- Polish: 566 (6.1%)
- German: 349 (3.8%)
- American: 171 (1.9%)
- Turkish: 150 (1.6%)
- French: 120 (1.3%)
- English: 118 (1.3%)
- Ukrainian: 94 (1.0%)
- Portuguese: 70 (0.8%)
- Russian: 68 (0.7%)
- European: 65 (0.7%)
- African: 60 (0.7%)
- Israeli: 54 (0.6%)
- Iranian: 48 (0.5%)
- Egyptian: 42 (0.5%)
- Greek: 42 (0.5%)
- Croatian: 36 (0.4%)
- Swedish: 34 (0.4%)
- British: 24 (0.3%)
- Serbian: 23 (0.2%)
- Dutch: 21 (0.2%)
- Scotch-Irish: 21 (0.2%)
- Bahamian: 21 (0.2%)
- Syrian: 20 (0.2%)
- Northern European: 18 (0.2%)
- Haitian: 17 (0.2%)
- Albanian: 16 (0.2%)
- Slavic: 15 (0.2%)
- Scottish: 12 (0.1%)
- Lithuanian: 12 (0.1%)
- Jamaican: 12 (0.1%)
- Ethiopian: 10 (0.1%)
- British West Indian: 10 (0.1%)
- Eastern European: 10 (0.1%)
- Armenian: 9 (0.10%)
- Lebanese: 9 (0.10%)
- Cypriot: 7 (0.08%)
- Danish: 5 (0.05%)
- Hungarian: 4 (0.04%)
- Swiss: 4 (0.04%)
- Nigerian: 4 (0.04%)
- Macedonian: 4 (0.04%)
- West Indian: 4 (0.04%)
Most common places of birth for foreign-born residents (%):
| Rutherford: | 19.0% (902) |
| New Jersey: | 12.8% (274,609) |
| Rutherford: | 13.8% (654) |
| New Jersey: | 4.2% (90,817) |
| Rutherford: | 5.6% (265) |
| New Jersey: | 4.0% (85,934) |
| Rutherford: | 5.4% (255) |
| New Jersey: | 3.3% (70,512) |
| Rutherford: | 5.0% (239) |
| New Jersey: | 2.1% (45,435) |
| Rutherford: | 3.7% (175) |
| New Jersey: | 2.3% (48,811) |
| Rutherford: | 3.1% (149) |
| New Jersey: | 2.7% (58,563) |
| Rutherford: | 2.9% (139) |
| New Jersey: | 0.8% (16,778) |
| Rutherford: | 2.7% (129) |
| New Jersey: | 4.4% (95,275) |
| Rutherford: | 2.7% (127) |
| New Jersey: | 9.7% (209,055) |
| Rutherford: | 2.0% (97) |
| New Jersey: | 0.0% (892) |
| Rutherford: | 2.0% (95) |
| New Jersey: | 1.1% (22,760) |
| Rutherford: | 1.9% (90) |
| New Jersey: | 0.4% (8,146) |
| Rutherford: | 1.9% (88) |
| New Jersey: | 1.5% (33,198) |
Place of birth for U.S.-born residents:
- This state: 9,919
- Other state: 3,737
- Northeast: 2,677
- Midwest: 154
- South: 515
- West: 457
91.3% of Rutherford residents lived in the same house 1 years ago.
Out of people who lived in different houses, 39.5% lived in this county.
Out of people who lived in different counties, 74.5% lived in New Jersey.
| Rutherford: | 91.3% |
| State average: | 90.4% |
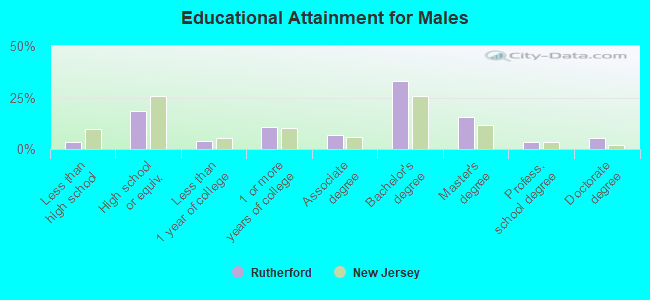
Education attainment for males 25 years and older:
- No schooling: 61
- Nursery to 4th grade: 0
- 5th and 6th grade: 0
- 7th and 8th grade: 39
- 9th grade: 13
- 10th grade: 27
- 11th grade: 15
- 12th grade, no diploma: 63
- High school graduate (or equivalency): 1,161
- Less than 1 year of college: 242
- Some college more than 1 year, no degree: 660
- Associate degree: 419
- Bachelor's degree: 2,094
- Master's degree: 975
- Professional school degree: 212
- Doctorate degree: 342
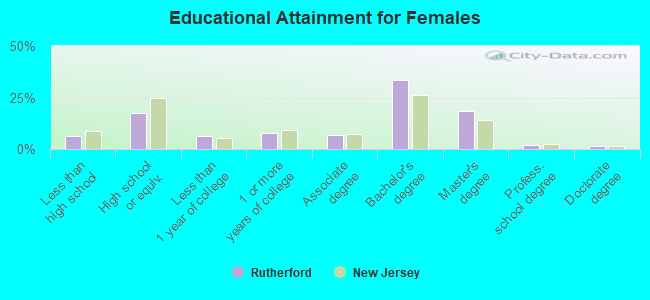
Education attainment for females 25 years and older:
- No schooling: 138
- Nursery to 4th grade: 30
- 5th and 6th grade: 7
- 7th and 8th grade: 104
- 9th grade: 20
- 10th grade: 50
- 11th grade: 12
- 12th grade, no diploma: 67
- High school graduate (or equivalency): 1,169
- Less than 1 year of college: 436
- Some college more than 1 year, no degree: 510
- Associate degree: 452
- Bachelor's degree: 2,233
- Master's degree: 1,252
- Professional school degree: 145
- Doctorate degree: 83
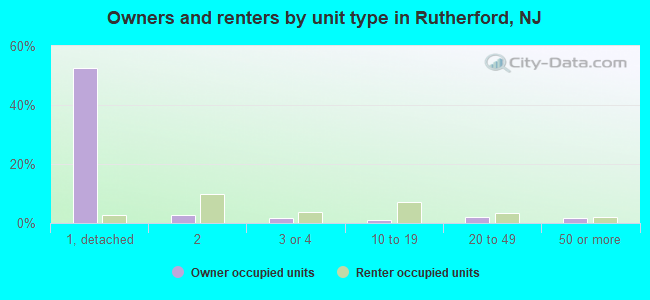
Housing units in structures:
- One, detached: 3,959
- One, attached: 127
- Two: 1,064
- 3 or 4: 332
- 5 to 9: 231
- 10 to 19: 464
- 20 to 49: 395
- 50 or more: 290
- Mobile homes: 107
Housing units lacking complete kitchen facilities in 2022: 0.3%
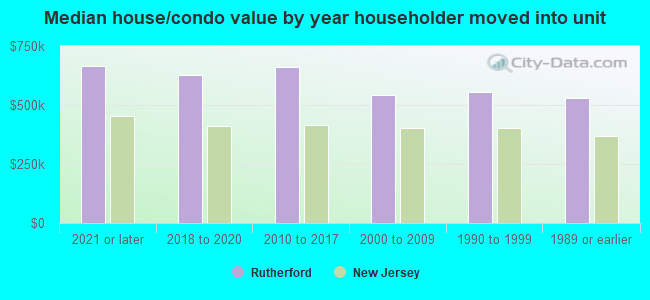
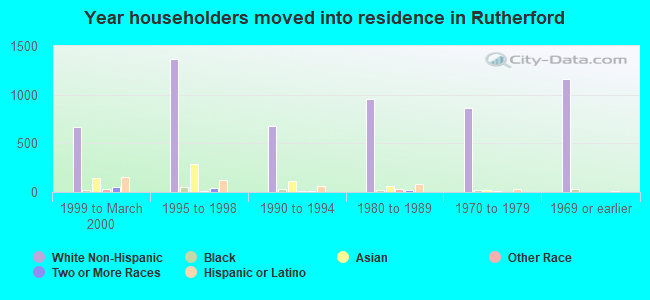
House/condo owner moved in on average 18 years ago
Renter moved in on average 3 years ago
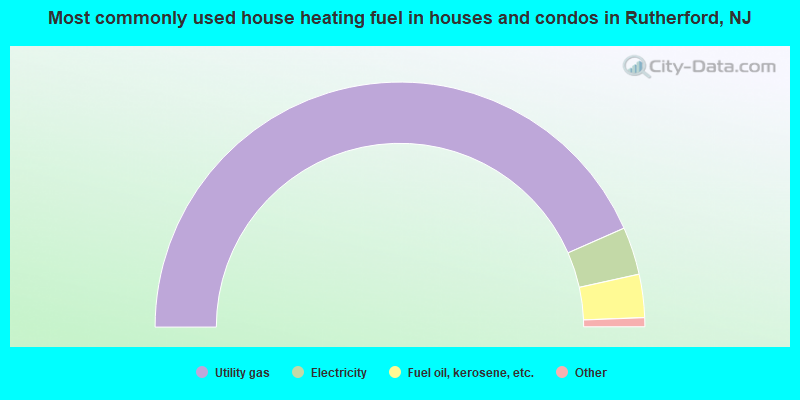
- 86.8%Utility gas
- 6.3%Electricity
- 5.7%Fuel oil, kerosene, etc.
- 0.9%Bottled, tank, or LP gas
- 0.3%Other fuel
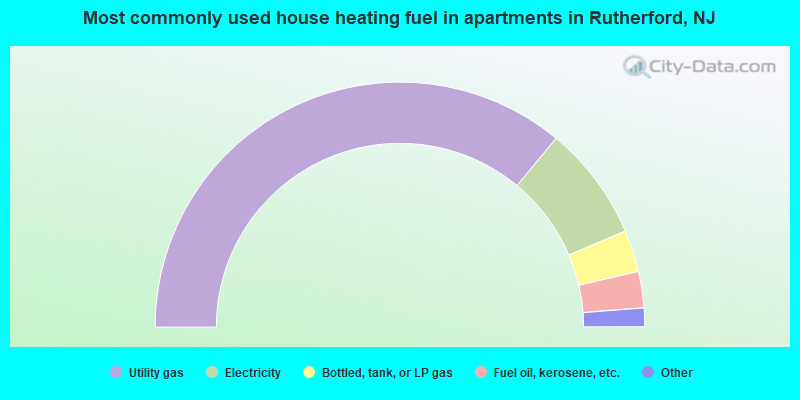
- 72.1%Utility gas
- 15.2%Electricity
- 5.5%Bottled, tank, or LP gas
- 4.8%Fuel oil, kerosene, etc.
- 2.0%No fuel used
- 0.4%Other fuel
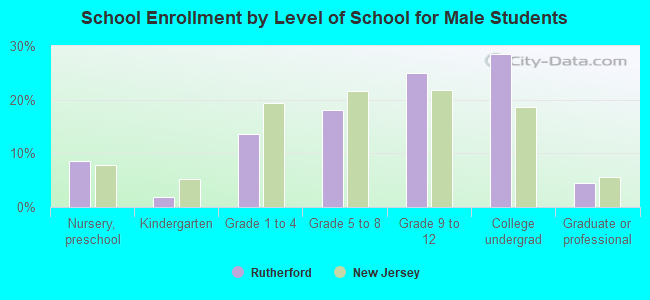
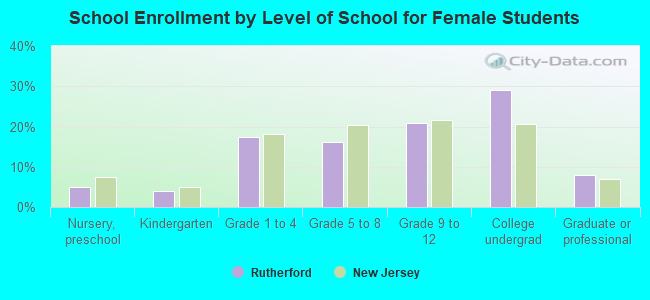
Private vs. public school enrollment:
| Here: | 2.5% |
| New Jersey: | 12.3% |
| Here: | 4.2% |
| New Jersey: | 13.1% |
| Here: | 31.6% |
| New Jersey: | 33.2% |