Rutland, MA (Massachusetts) Houses and Residents
| Rutland: | $352,273 |
| Massachusetts: | $534,700 |
Total population: 2,111 (Urban population: 1,998, Rural population: 226 (all nonfarm))
Houses: 727 (696 occupied: 543 owner occupied, 160 renter occupied)
| % of renters here: | 23% |
| State: | 38% |
Housing density: 246 houses/condos per square mile
Median price asked for vacant for-sale houses and condos in 2022 in this county: $182,682.
Median contract rent in 2022: $924 (lower quartile is $839, upper quartile is $1,125)
Median rent asked for vacant for-rent units in 2022: $813
Median gross rent in Rutland, MA in 2022: $1,162
Housing units in Rutland with a mortgage: 264 (27 second mortgage, 0 home equity loan, 27 both second mortgage and home equity loan)
Houses without a mortgage: 19
Median household income for houses/condos with a mortgage: $118,583
Median household income for apartments without a mortgage: $88,903
Median monthly housing costs: $1,150
Compare current foreclosures near Rutland, MA:
| Photo | Address | Area | Beds / Baths | Price | Details |
|---|---|---|---|---|---|

|
#1
Britney Dr
Rutland, MA 01543
|
1,672 sq. feet
|
1 baths 3 beds |
show details | |

|
#2
Irish Ln
Rutland, MA 01543
|
1,680 sq. feet
|
2 baths 3 beds |
show details | |

|
#3
Oakridge Dr
Rutland, MA 01543
|
1,190 sq. feet
|
1 baths 3 beds |
show details | |

|
#4
Winifreds Way
Rutland, MA 01543
|
1,736 sq. feet
|
2 baths 3 beds |
show details | |

|
#5
Jackson Ave
Rutland, MA 01543
|
2,344 sq. feet
|
2 baths 4 beds |
show details | |

|
#6
Pommogussett Rd
Rutland, MA 01543
|
2,904 sq. feet
|
3 baths 4 beds |
show details | |

|
#7
Colonial Dr
Rutland, MA 01543
|
1,772 sq. feet
|
2 baths 3 beds |
show details | |

|
#8
Grizzly Dr
Rutland, MA 01543
|
- sq. feet
|
- baths - beds |
show details | |

|
#9
Helen Ave
Rutland, MA 01543
|
- sq. feet
|
- baths - beds |
show details | |

|
#10
Oakridge Dr
Rutland, MA 01543
|
- sq. feet
|
- baths - beds |
show details |
| Photo | Address | Area | Beds / Baths | Price | Details |
|---|---|---|---|---|---|

|
#11
N Brookfield Rd
Oakham, MA 01068
|
1,078 sq. feet
|
1 baths 2 beds |
$439,900
|
show details |

|
#12
Sylvan Ave
Leominster, MA 01453
|
720 sq. feet
|
1 baths 2 beds |
$375,000
|
show details |

|
#13
Parker St
Gardner, MA 01440
|
1,980 sq. feet
|
2 baths 4 beds |
$469,900
|
show details |

|
#14
Maple Ave
Rutland, MA 01543
|
- sq. feet
|
- baths - beds |
show details | |

|
#15
Irish Ln
Rutland, MA 01543
|
- sq. feet
|
- baths - beds |
show details | |

|
#16
Irish Ln
Rutland, MA 01543
|
- sq. feet
|
- baths - beds |
show details | |

|
#17
Hardwick Road
Hardwick, MA 01037
|
- sq. feet
|
1 baths 3 beds |
$229,900
|
show details |

|
#18
W Main St
Ware, MA 01082
|
3,645 sq. feet
|
3 baths 5 beds |
show details | |

|
#19
Old West Brookfield Road
Warren, MA 01083
|
1,760 sq. feet
|
2 baths 4 beds |
show details | |

|
#20
Hawkins St
Worcester, MA 01604
|
864 sq. feet
|
1 baths 3 beds |
show details |
| Photo | Address | Area | Beds / Baths | Price | Details |
|---|---|---|---|---|---|

|
#21
Leicester St
Auburn, MA 01501
|
912 sq. feet
|
1 baths 2 beds |
show details | |

|
#22
Nelson Street
Warren, MA 01083
|
- sq. feet
|
2 baths 3 beds |
show details | |

|
#23
Redfield Rd
Cherry Valley, MA 01611
|
1,412 sq. feet
|
1 baths 3 beds |
show details | |

|
#24
Treadwell Ter
Spencer, MA 01562
|
960 sq. feet
|
1 baths 3 beds |
show details | |

|
#25
Loxwood St
Worcester, MA 01604
|
1,001 sq. feet
|
1 baths 2 beds |
show details | |

|
#26
Grove Ave
Leominster, MA 01453
|
3,097 sq. feet
|
1 baths 4 beds |
show details | |

|
#27
Southbridge Rd Unit 104
Charlton, MA 01507
|
1,266 sq. feet
|
2 baths 2 beds |
show details | |

|
#28
Kenberma Rd
Worcester, MA 01604
|
- sq. feet
|
2 baths 3 beds |
show details | |

|
#29
Pocasset Ave
Worcester, MA 01606
|
2,090 sq. feet
|
3 baths 3 beds |
show details | |

|
#30
Main St # 1
Oxford, MA 01540
|
1,199 sq. feet
|
2 baths 3 beds |
show details |
| Photo | Address | Area | Beds / Baths | Price | Details |
|---|---|---|---|---|---|

|
#31
Paul St
Auburn, MA 01501
|
1,037 sq. feet
|
1 baths 3 beds |
show details | |

|
#32
Pleasant St
Leominster, MA 01453
|
1,447 sq. feet
|
1 baths 3 beds |
show details | |

|
#33
Ideal Rd
Worcester, MA 01604
|
1,334 sq. feet
|
1 baths 3 beds |
show details | |

|
#34
Appleton Rd
Auburn, MA 01501
|
1,590 sq. feet
|
2 baths 4 beds |
show details | |

|
#35
Old Meetinghouse Rd
Auburn, MA 01501
|
702 sq. feet
|
1 baths 2 beds |
show details | |

|
#36
Dogwood Rd
Leominster, MA 01453
|
1,428 sq. feet
|
1 baths 3 beds |
show details | |

|
#37
Summer St
Gardner, MA 01440
|
1,893 sq. feet
|
2 baths 5 beds |
show details | |

|
#38
Beach Dr
West Brookfield, MA 01585
|
744 sq. feet
|
1 baths 1 beds |
show details | |

|
#39
Francis Ave
Shrewsbury, MA 01545
|
1,849 sq. feet
|
1 baths 3 beds |
show details | |

|
#40
Grafton St
Shrewsbury, MA 01545
|
3,951 sq. feet
|
2 baths 4 beds |
show details |
| Photo | Address | Area | Beds / Baths | Price | Details |
|---|---|---|---|---|---|

|
#41
Travers St
Gardner, MA 01440
|
660 sq. feet
|
1 baths 1 beds |
show details | |

|
#42
Silver St
Lancaster, MA 01523
|
2,928 sq. feet
|
3 baths 3 beds |
show details | |

|
#43
Mill St
Gardner, MA 01440
|
1,728 sq. feet
|
1 baths 4 beds |
show details | |

|
#44
Winchester Ave
Auburn, MA 01501
|
1,926 sq. feet
|
2 baths 3 beds |
show details | |

|
#45
Faneuf St
Auburn, MA 01501
|
1,116 sq. feet
|
1 baths 3 beds |
show details | |

|
#46
Chelsea St
Gardner, MA 01440
|
1,404 sq. feet
|
2 baths 3 beds |
show details | |

|
#47
Sawyer St
Gardner, MA 01440
|
1,747 sq. feet
|
1 baths 2 beds |
show details | |

|
#48
Greenwood St
Millbury, MA 01527
|
1,429 sq. feet
|
1 baths 3 beds |
show details | |

|
#49
Grove St
Shrewsbury, MA 01545
|
2,120 sq. feet
|
2 baths 3 beds |
show details | |

|
Check over 1 million property listings on Foreclosure.com!
|
browse all offers | |||

Latest news about housing in Rutland, MA collected exclusively by city-data.com from local newspapers, TV, and radio stations

 | How Much Massachusetts Households Make Per Year: Census Data (37 replies) |
| Under $250k any Massachusetts single family house with yard (117 replies) |
| Worcester North - Building a House to Rent (20 replies) |
| Boston (the city) Has Lost Its Allure for Me (141 replies) |
| Central or Western MA towns for Seniors (16 replies) |
| Moving Small Family to Worcester. Advice? (25 replies) |

Median year apartment built: 1944
Household type by relationship:
Households: 1,697- Male householders: 327 (103 living alone), Female householders: 363 (43 living alone)
417 spouses (417 opposite-sex spouses), 31 unmarried partners, (31 opposite-sex unmarried partners), 463 children (435 natural, 28 adopted, 0 stepchildren), 0 grandchildren, 12 brothers or sisters, 55 parents, 0 foster children, 9 other relatives, 0 non-relatives
- In group quarters: 18
Size of family households: 314 2-persons, 122 3-persons, 33 4-persons, 30 5-persons, 28 6-persons.
Size of nonfamily households: 151 1-person, 22 2-persons.
221 married couples with children.
73 single-parent households (0 men, 73 women).
99.6% of residents of Rutland speak English at home.
Foreign born population: 9 (0.5%)
(100.0% of them are naturalized citizens)
| Here: | 6.2 |
| State: | 6.5 |
| Here: | 4.4 |
| State: | 4.0 |

- Bedrooms in owner-occupied houses and condos in Rutland, Massachusetts
- 0no bedroom
- 01 bedroom
- 1562 bedrooms
- 2973 bedrooms
- 494 bedrooms
- 425+ bedrooms

- Bedrooms in renter-occupied apartments in Rutland, Massachusetts
- 0no bedroom
- 101 bedroom
- 732 bedrooms
- 113 bedrooms
- 674 bedrooms
- 05+ bedrooms

- Cars and other vehicles available in Rutland in owner-occupied houses/condos
- 13no vehicle
- 741 vehicle
- 3412 vehicles
- 753 vehicles
- 234 vehicles
- 185+ vehicles

- Cars and other vehicles available in Rutland in renter-occupied apartments
- 0no vehicle
- 961 vehicle
- 642 vehicles
- 03 vehicles
- 04 vehicles
- 05+ vehicles

- Rooms in owner-occupied houses in Rutland, Massachusetts
- 01 room
- 02 rooms
- 233 rooms
- 794 rooms
- 345 rooms
- 1666 rooms
- 1187 rooms
- 508 rooms
- 759+ rooms

- Rooms in renter-occupied apartments in Rutland, Massachusetts
- 01 room
- 102 rooms
- 03 rooms
- 844 rooms
- 05 rooms
- 246 rooms
- 07 rooms
- 118 rooms
- 329+ rooms


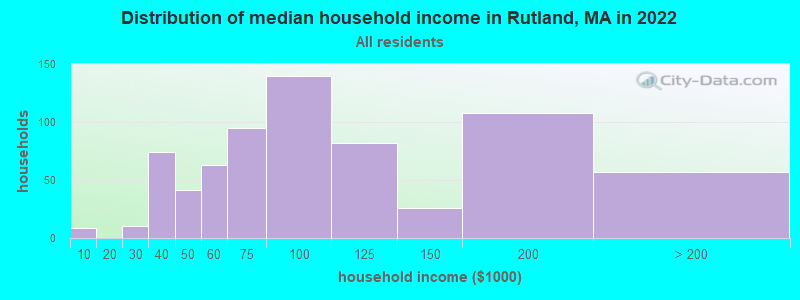
Rutland, MA household income distribution

- 9Less than $10,000
- 10$20,000 to $29,999
- 74$30,000 to $39,999
- 41$40,000 to $49,999
- 63$50,000 to $59,999
- 95$60,000 to $74,999
- 140$75,000 to $99,999
- 82$100,000 to $124,999
- 26$125,000 to $149,999
- 108$150,000 to $199,999
- 57$200,000 or more
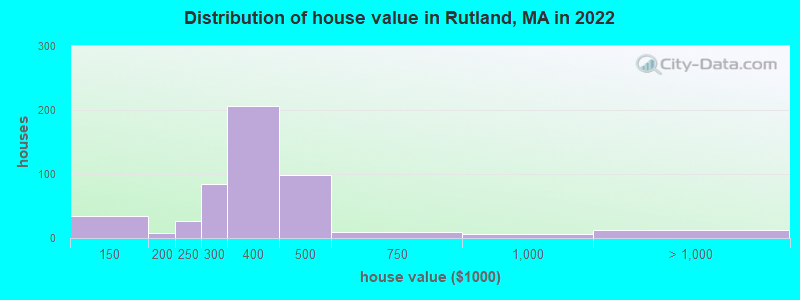
Home value of owner - occupied houses in 2022 in Rutland, MA
-
- 35$125,000 to $149,999
- 7$175,000 to $199,999
- 27$200,000 to $249,999
- 84$250,000 to $299,999
- 205$300,000 to $399,999
- 97$400,000 to $499,999
- 10$500,000 to $749,999
- 6$750,000 to $999,999
- 12$1,000,000 to $1,499,999
Rent paid by renters in 2022 in Rutland, MA
-
- 10$150 to $199
- 44$750 to $799
- 33$800 to $899
- 24$900 to $999
- 59$1,000 to $1,249


Percentage of workers working in this county: 88.9%
Number of people working at home: 69 (8.2% of all workers)
Travel time to work (commute)
- Less than 5 minutes: 39
- 5 to 9 minutes: 61
- 10 to 14 minutes: 23
- 15 to 19 minutes: 34
- 20 to 24 minutes: 133
- 25 to 29 minutes: 121
- 30 to 34 minutes: 95
- 35 to 39 minutes: 10
- 40 to 44 minutes: 63
- 45 to 59 minutes: 119
- 60 to 89 minutes: 19
- 90 or more minutes: 38
Means of transportation to work:
- Drove a car alone: 1,036 (89.2%)
- Carpooled: 90 (7.8%)
- Walked: 28 (2.4%)
- Worked at home: 7 (0.6%)

- Unemployment by race in 2022
- Unemployment rate for White non-Hispanic residents
- 2.3%Females
- Unemployment rate for Black residents
- 100.0%Females
- Unemployment rate for Hispanic or Latino residents
- 17.8%Females

- Year of entry for the foreign-born population in Rutland, Massachusetts
- 02010 or later
- 02000 to 2009
- 81990 to 1999
- 01980 to 1989
- 81970 to 1979
- 30Before 1970

First ancestries reported:
- American: 273 (37.0%)
- Irish: 171 (23.2%)
- Finnish: 59 (8.0%)
- Italian: 40 (5.4%)
- French Canadian: 39 (5.3%)
- English: 36 (4.9%)
- Scotch-Irish: 28 (3.8%)
- German: 12 (1.6%)
- French: 8 (1.1%)
- Russian: 7 (0.9%)
- Swedish: 7 (0.9%)
- Scottish: 4 (0.5%)
Most common places of birth for foreign-born residents (%):
| Rutland: | 100.0% (9) |
| Massachusetts: | 1.5% (18,278) |
Place of birth for U.S.-born residents:
- This state: 1,383
- Other state: 291
- Northeast: 54
- Midwest: 20
- South: 150
- West: 79
84.1% of Rutland residents lived in the same house 1 years ago.
Out of people who lived in different houses, 48.6% lived in this county.
| Rutland: | 84.1% |
| State average: | 87.7% |
Education attainment for males 25 years and older:
- No schooling: 6
- Nursery to 4th grade: 0
- 5th and 6th grade: 0
- 7th and 8th grade: 0
- 9th grade: 0
- 10th grade: 0
- 11th grade: 37
- 12th grade, no diploma: 0
- High school graduate (or equivalency): 208
- Less than 1 year of college: 48
- Some college more than 1 year, no degree: 109
- Associate degree: 58
- Bachelor's degree: 70
- Master's degree: 91
- Professional school degree: 0
- Doctorate degree: 0

Education attainment for females 25 years and older:
- No schooling: 0
- Nursery to 4th grade: 0
- 5th and 6th grade: 0
- 7th and 8th grade: 0
- 9th grade: 0
- 10th grade: 0
- 11th grade: 0
- 12th grade, no diploma: 0
- High school graduate (or equivalency): 220
- Less than 1 year of college: 32
- Some college more than 1 year, no degree: 22
- Associate degree: 56
- Bachelor's degree: 227
- Master's degree: 76
- Professional school degree: 0
- Doctorate degree: 0


Housing units in structures:
- One, detached: 508
- One, attached: 94
- Two: 42
- 5 to 9: 50
- Mobile homes: 31
House/condo owner moved in on average 15 years ago
Renter moved in on average 5 years ago

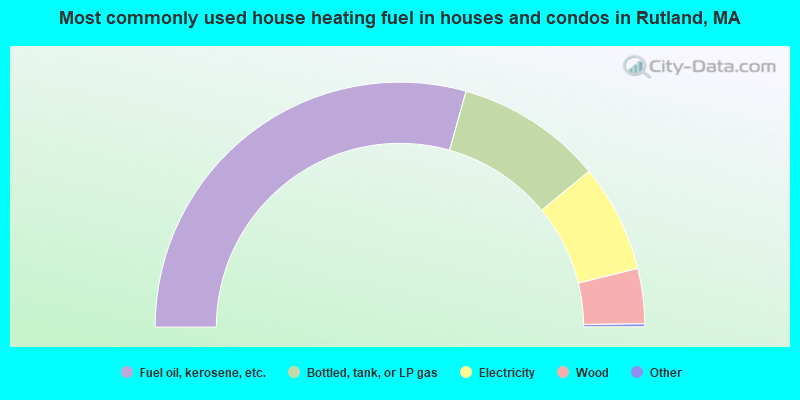
- 58.9%Fuel oil, kerosene, etc.
- 19.4%Bottled, tank, or LP gas
- 14.3%Electricity
- 7.3%Wood
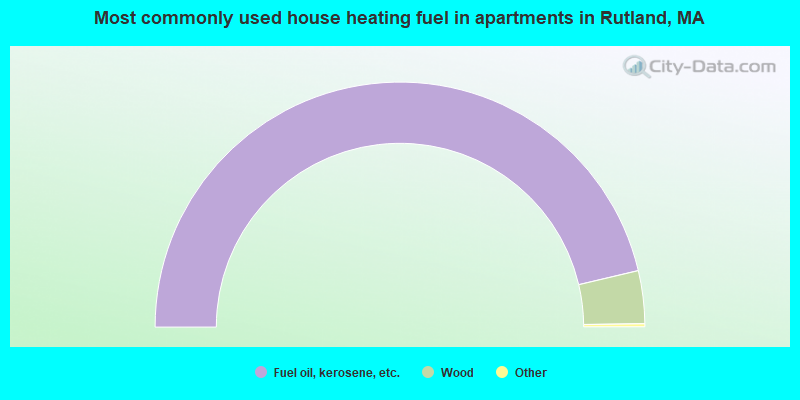
- 93.0%Fuel oil, kerosene, etc.
- 7.0%Wood
Private vs. public school enrollment:
| Here: | 36.6% |
| Massachusetts: | 10.3% |
| Here: | 29.5% |
| Massachusetts: | 12.3% |
| Here: | 17.5% |
| Massachusetts: | 51.2% |


