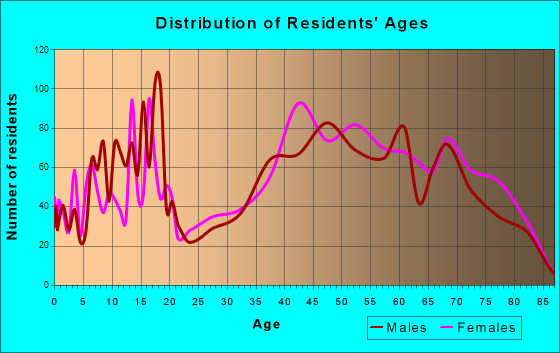
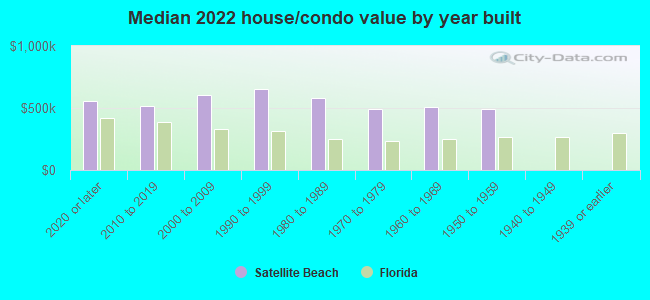
Satellite Beach, FL (Florida) Houses and Residents
| Satellite Beach: | $519,254 |
| Florida: | $354,100 |
Total population: 10,418 (Urban population: 9,304, Rural population: 0)
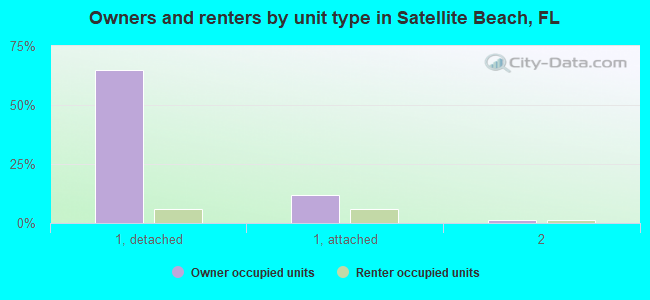
Houses: 4,850 (4,286 occupied: 3,666 owner occupied, 646 renter occupied)
| % of renters here: | 15% |
| State: | 33% |
Housing density: 2,041 houses/condos per square mile
Median price asked for vacant for-sale houses and condos in 2022 in this county: $294,176.
Median contract rent in 2022: $1,834 (lower quartile is $1,402, upper quartile is over $2,000)
Median rent asked for vacant for-rent units in 2022: $3,049
Median gross rent in Satellite Beach, FL in 2022: over $2,000
Housing units in Satellite Beach with a mortgage: 2,258 (203 second mortgage, 0 home equity loan, 178 both second mortgage and home equity loan)
Houses without a mortgage: 52
Median household income for houses/condos with a mortgage: $126,820
Median household income for apartments without a mortgage: $96,320
Median monthly housing costs: $1,823
Compare current foreclosures near Satellite Beach, FL:
| Photo | Address | Area | Beds / Baths | Price | Details |
|---|---|---|---|---|---|

|
#1
Montecito Dr
Satellite Beach, FL 32937
|
3,100 sq. feet
|
2 baths 3 beds |
show details | |

|
#2
Sunrise Ave
Satellite Beach, FL 32937
|
1,734 sq. feet
|
2 baths 3 beds |
show details | |

|
#3
Ponkapoag Way
Satellite Beach, FL 32937
|
1,222 sq. feet
|
2 baths 3 beds |
show details | |

|
#4
Sheridan Ave
Satellite Beach, FL 32937
|
1,698 sq. feet
|
2 baths 3 beds |
show details | |

|
#5
Atlantic Blvd
Satellite Beach, FL 32937
|
1,220 sq. feet
|
2 baths 3 beds |
show details | |

|
#6
Ashley Ave
Satellite Beach, FL 32937
|
1,460 sq. feet
|
2 baths 3 beds |
show details | |

|
#7
Ellwood Ave
Satellite Beach, FL 32937
|
1,890 sq. feet
|
2 baths 3 beds |
show details | |

|
#8
Park Ave
Satellite Beach, FL 32937
|
2,649 sq. feet
|
3 baths 6 beds |
show details | |

|
#9
Highway A1a
Satellite Beach, FL 32937
|
6,706 sq. feet
|
- baths - beds |
show details | |

|
#10
Highway A1a Apt D201
Satellite Beach, FL 32937
|
- sq. feet
|
- baths - beds |
show details |
| Photo | Address | Area | Beds / Baths | Price | Details |
|---|---|---|---|---|---|

|
#11
Palm Springs Blvd Apt 812
Satellite Beach, FL 32937
|
1,100 sq. feet
|
- baths - beds |
show details | |

|
#12
Majorca Ct
Satellite Beach, FL 32937
|
- sq. feet
|
- baths - beds |
show details | |

|
#13
Ocean Blvd
Satellite Beach, FL 32937
|
- sq. feet
|
- baths - beds |
show details | |

|
#14
Lanai Cir
Satellite Beach, FL 32937
|
- sq. feet
|
- baths - beds |
show details | |

|
#15
Dove Ln
Satellite Beach, FL 32937
|
- sq. feet
|
- baths - beds |
show details | |

|
#16
E Eau Gallie Blvd Ste E8014
Satellite Beach, FL 32937
|
- sq. feet
|
- baths - beds |
show details | |

|
#17
Rosewood Ct Apt 3a
Satellite Beach, FL 32937
|
- sq. feet
|
- baths - beds |
show details | |

|
#18
Desoto Pkwy # 7
Satellite Beach, FL 32937
|
- sq. feet
|
- baths - beds |
show details | |

|
#19
Kensington Dr
Cocoa, FL 32922
|
1,388 sq. feet
|
3 baths 3 beds |
$280,000
|
show details |

|
#20
Heather Ave NE
Palm Bay, FL 32907
|
1,569 sq. feet
|
2 baths 3 beds |
$300,000
|
show details |
| Photo | Address | Area | Beds / Baths | Price | Details |
|---|---|---|---|---|---|

|
#21
Academy St NE
Palm Bay, FL 32905
|
1,793 sq. feet
|
2 baths 3 beds |
show details | |

|
#22
Broomsedge Circle
Melbourne, FL 32904
|
3,350 sq. feet
|
2 baths 4 beds |
show details | |

|
#23
Bougainvillea Dr
Rockledge, FL 32955
|
1,566 sq. feet
|
2 baths 3 beds |
show details | |

|
#24
Autumn Glen Dr
Melbourne, FL 32940
|
2,755 sq. feet
|
3 baths 5 beds |
show details | |

|
#25
Riviera Dr NE
Palm Bay, FL 32905
|
1,940 sq. feet
|
3 baths 4 beds |
show details | |

|
#26
Chicory Ave NE
Palm Bay, FL 32907
|
2,083 sq. feet
|
2 baths 4 beds |
show details | |

|
#27
Rio Ln
Indialantic, FL 32903
|
2,800 sq. feet
|
2 baths 3 beds |
show details | |

|
#28
Snapdragon Dr NW
Palm Bay, FL 32907
|
2,862 sq. feet
|
2 baths 4 beds |
show details | |

|
#29
Meadowwood Ct
Melbourne, FL 32935
|
968 sq. feet
|
2 baths 2 beds |
show details | |

|
#30
Loring St
Cocoa, FL 32922
|
2,252 sq. feet
|
1 baths 2 beds |
show details |
| Photo | Address | Area | Beds / Baths | Price | Details |
|---|---|---|---|---|---|

|
#31
N Sylvan Ln
Melbourne, FL 32935
|
2,172 sq. feet
|
2 baths 3 beds |
show details | |

|
#32
Pheasant Ct
Melbourne, FL 32935
|
2,720 sq. feet
|
3 baths 3 beds |
show details | |

|
#33
Chipper Dr NE
Palm Bay, FL 32905
|
1,286 sq. feet
|
1 baths 3 beds |
show details | |

|
#34
Manor Dr NE
Palm Bay, FL 32905
|
1,496 sq. feet
|
2 baths 2 beds |
show details | |

|
#35
Hampton Dr NE
Palm Bay, FL 32905
|
1,286 sq. feet
|
2 baths 3 beds |
show details | |

|
#36
Peach Ave NE
Palm Bay, FL 32907
|
1,692 sq. feet
|
2 baths 3 beds |
show details | |

|
#37
Edwards St NE
Palm Bay, FL 32905
|
1,286 sq. feet
|
1 baths 3 beds |
show details | |

|
#38
Costa Mesa Ln
Rockledge, FL 32955
|
2,006 sq. feet
|
2 baths 3 beds |
show details | |

|
#39
Eastman Ave NE
Palm Bay, FL 32905
|
1,059 sq. feet
|
2 baths 2 beds |
show details | |

|
#40
Rheine Rd NW
Palm Bay, FL 32907
|
1,232 sq. feet
|
2 baths 2 beds |
show details |
| Photo | Address | Area | Beds / Baths | Price | Details |
|---|---|---|---|---|---|

|
#41
Alesio Ave SE
Palm Bay, FL 32909
|
1,649 sq. feet
|
2 baths 3 beds |
show details | |

|
#42
Knecht Rd NE
Palm Bay, FL 32905
|
1,530 sq. feet
|
2 baths 4 beds |
show details | |

|
#43
Algeria St NE
Palm Bay, FL 32905
|
1,881 sq. feet
|
2 baths 3 beds |
show details | |

|
#44
Beekman St NE
Palm Bay, FL 32905
|
1,639 sq. feet
|
2 baths 3 beds |
show details | |

|
#45
Trier Rd NW
Palm Bay, FL 32907
|
2,093 sq. feet
|
2 baths 4 beds |
show details | |

|
#46
Badger Dr NE
Palm Bay, FL 32905
|
1,303 sq. feet
|
2 baths 3 beds |
show details | |

|
#47
Advana St NE
Palm Bay, FL 32905
|
2,370 sq. feet
|
2 baths 3 beds |
show details | |

|
#48
Cloverleaf Ave SE
Palm Bay, FL 32909
|
1,134 sq. feet
|
2 baths 3 beds |
show details | |

|
#49
Cromey Rd NE
Palm Bay, FL 32905
|
1,202 sq. feet
|
2 baths 3 beds |
show details | |

|
Check over 1 million property listings on Foreclosure.com!
|
browse all offers | |||


Median year apartment built: 1987
Household type by relationship:
Households: 11,541- Male householders: 2,192 (294 living alone), Female householders: 2,103 (574 living alone)
2,743 spouses (2,685 opposite-sex spouses), 348 unmarried partners, (348 opposite-sex unmarried partners), 3,705 children (3,575 natural, 30 adopted, 99 stepchildren), 78 grandchildren, 79 brothers or sisters, 13 parents, 0 foster children, 25 other relatives, 235 non-relatives
- In group quarters: 15
Size of family households: 1,482 2-persons, 682 3-persons, 652 4-persons, 271 5-persons, 9 6-persons, 48 7-or-more-persons.
Size of nonfamily households: 851 1-person, 315 2-persons, 10 3-persons.
2,271 married couples with children.
358 single-parent households (141 men, 217 women).
93.6% of residents of Satellite Beach speak English at home.
2.9% of residents speak Spanish at home (68% speak English very well, 24% speak English well, 1% speak English not well, 7% don't speak English at all).
2.4% of residents speak other Indo-European language at home (76% speak English very well, 24% speak English well).
0.5% of residents speak Asian or Pacific Island language at home (41% speak English very well, 59% speak English well).
Foreign born population: 604 (5.2%)
(60.6% of them are naturalized citizens)
| Here: | 6.4 |
| State: | 5.9 |
| Here: | 5.2 |
| State: | 4.2 |
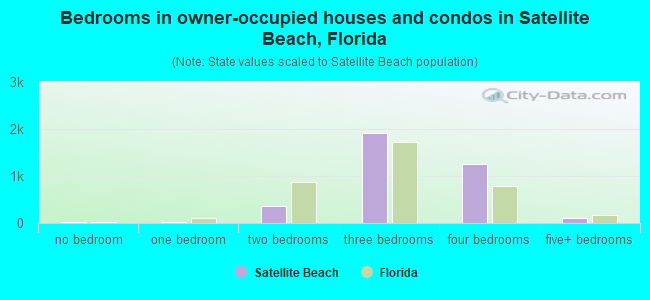
- Bedrooms in owner-occupied houses and condos in Satellite Beach, Florida
- 15no bedroom
- 221 bedroom
- 3612 bedrooms
- 1,9153 bedrooms
- 1,2524 bedrooms
- 1025+ bedrooms
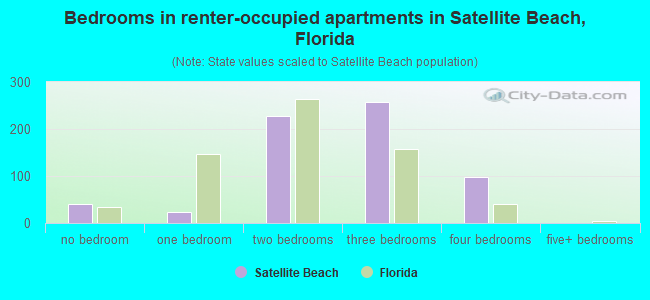
- Bedrooms in renter-occupied apartments in Satellite Beach, Florida
- 40no bedroom
- 241 bedroom
- 2272 bedrooms
- 2583 bedrooms
- 974 bedrooms
- 05+ bedrooms
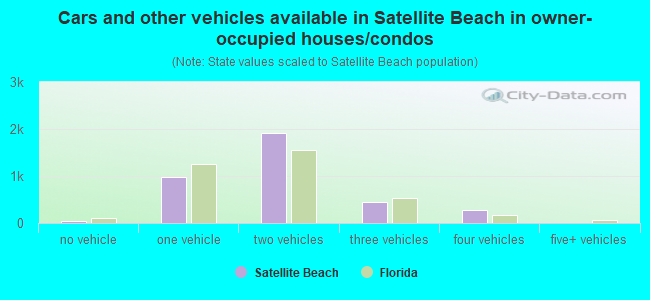
- Cars and other vehicles available in Satellite Beach in owner-occupied houses/condos
- 53no vehicle
- 9751 vehicle
- 1,9112 vehicles
- 4563 vehicles
- 2724 vehicles
- 05+ vehicles
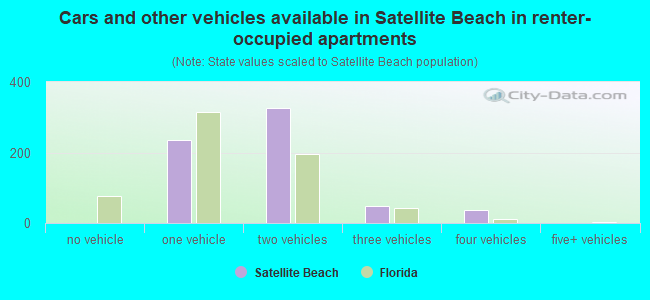
- Cars and other vehicles available in Satellite Beach in renter-occupied apartments
- 0no vehicle
- 2361 vehicle
- 3272 vehicles
- 473 vehicles
- 374 vehicles
- 05+ vehicles
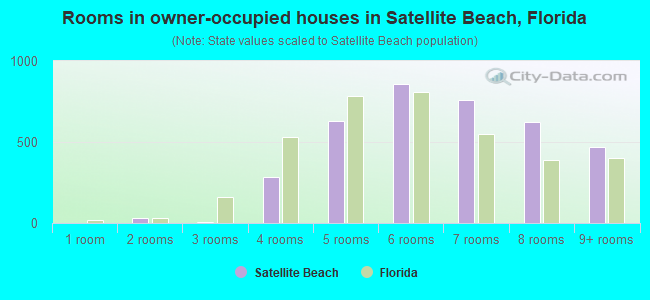
- Rooms in owner-occupied houses in Satellite Beach, Florida
- 01 room
- 322 rooms
- 73 rooms
- 2864 rooms
- 6315 rooms
- 8596 rooms
- 7577 rooms
- 6248 rooms
- 4699+ rooms
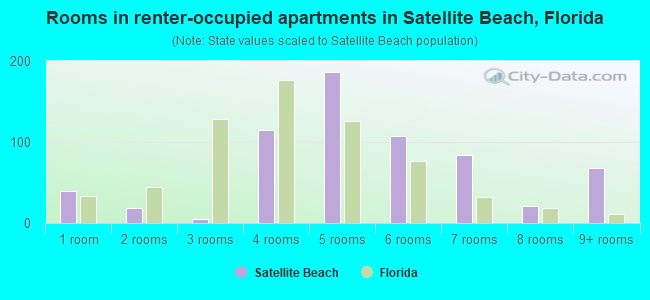
- Rooms in renter-occupied apartments in Satellite Beach, Florida
- 401 room
- 192 rooms
- 53 rooms
- 1154 rooms
- 1875 rooms
- 1086 rooms
- 847 rooms
- 218 rooms
- 689+ rooms
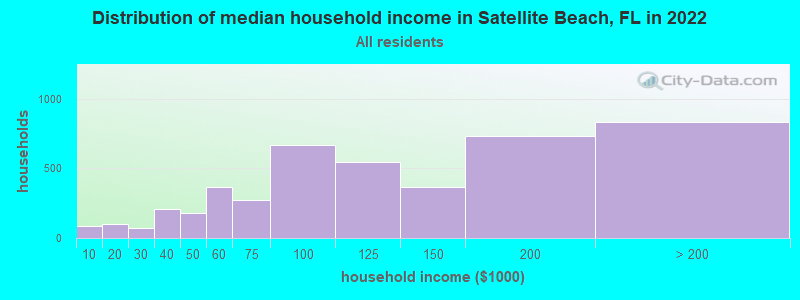
Satellite Beach, FL household income distribution

- 86Less than $10,000
- 103$10,000 to $19,999
- 70$20,000 to $29,999
- 211$30,000 to $39,999
- 180$40,000 to $49,999
- 365$50,000 to $59,999
- 269$60,000 to $74,999
- 665$75,000 to $99,999
- 544$100,000 to $124,999
- 365$125,000 to $149,999
- 732$150,000 to $199,999
- 832$200,000 or more
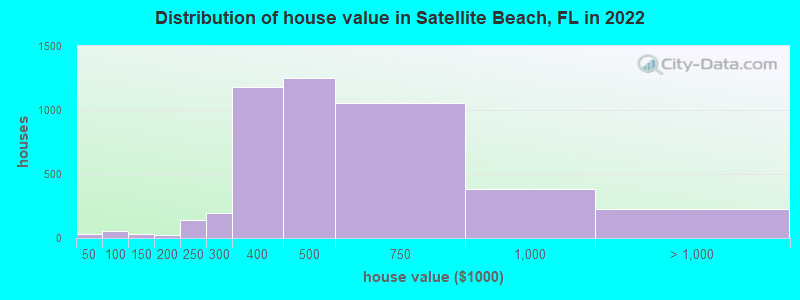
Home value of owner - occupied houses in 2022 in Satellite Beach, FL
-
- 17$25,000 to $29,999
- 10$30,000 to $34,999
- 3$40,000 to $49,999
- 0$50,000 to $59,999
- 3$70,000 to $79,999
- 37$80,000 to $89,999
- 5$90,000 to $99,999
- 17$100,000 to $124,999
- 17$125,000 to $149,999
- 10$150,000 to $174,999
- 15$175,000 to $199,999
- 143$200,000 to $249,999
- 195$250,000 to $299,999
- 1,178$300,000 to $399,999
- 1,252$400,000 to $499,999
- 1,053$500,000 to $749,999
- 382$750,000 to $999,999
- 222$1,000,000 to $1,499,999
- 4$2,000,000 or more
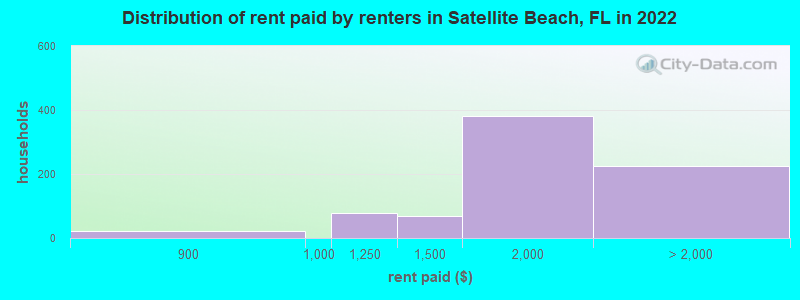
Rent paid by renters in 2022 in Satellite Beach, FL
-
- 22$800 to $899
- 78$1,000 to $1,249
- 67$1,250 to $1,499
- 382$1,500 to $1,999
- 57$2,000 to $2,499
- 101$2,500 to $2,999
- 5$3,000 to $3,499
- 61No cash rent
Percentage of workers working in this county: 90.6%
Number of people working at home: 1,610 (28.8% of all workers)
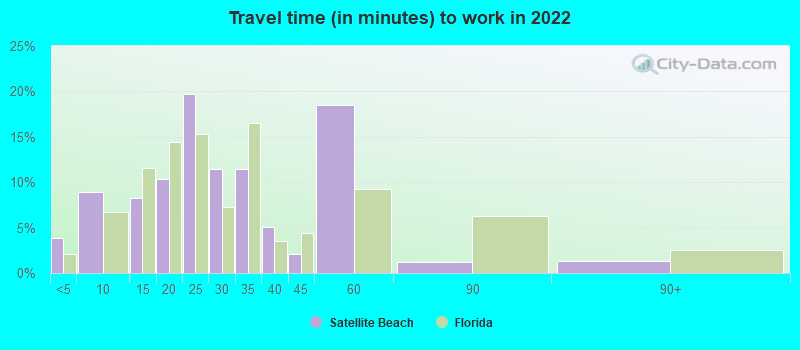
Travel time to work (commute)
- Less than 5 minutes: 158
- 5 to 9 minutes: 331
- 10 to 14 minutes: 336
- 15 to 19 minutes: 809
- 20 to 24 minutes: 837
- 25 to 29 minutes: 222
- 30 to 34 minutes: 559
- 35 to 39 minutes: 88
- 40 to 44 minutes: 86
- 45 to 59 minutes: 247
- 60 to 89 minutes: 399
- 90 or more minutes: 138
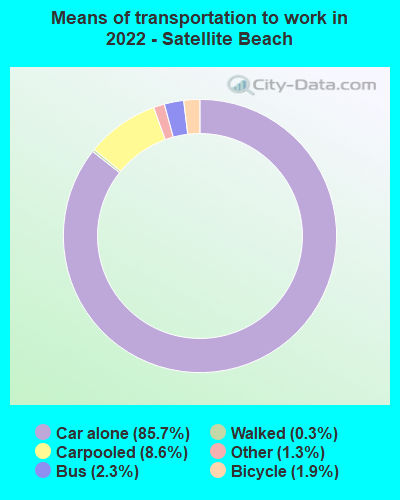
Means of transportation to work:
- Drove a car alone: 4,825 (67.0%)
- Carpooled: 499 (6.9%)
- Bus: 207 (2.9%)
- Taxi: 100 (1.4%)
- Bicycle: 103 (1.4%)
- Walked: 19 (0.3%)
- Worked at home: 1,610 (22.4%)
- Unemployment by race in 2022
- Unemployment rate for White non-Hispanic residents
- 1.4%Males
- 6.9%Females
- Unemployment rate for Black residents
- 82.8%Males
- Unemployment rate for two or more race residents
- 28.7%Males
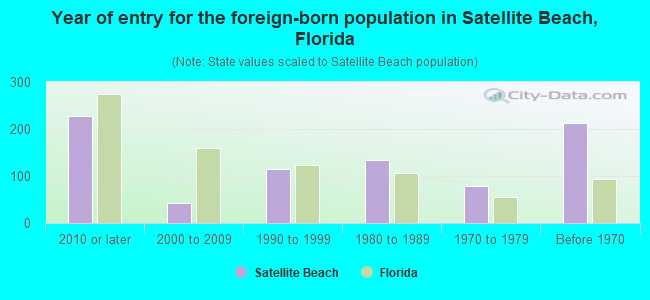
- Year of entry for the foreign-born population in Satellite Beach, Florida
- 2282010 or later
- 432000 to 2009
- 1141990 to 1999
- 1341980 to 1989
- 781970 to 1979
- 213Before 1970
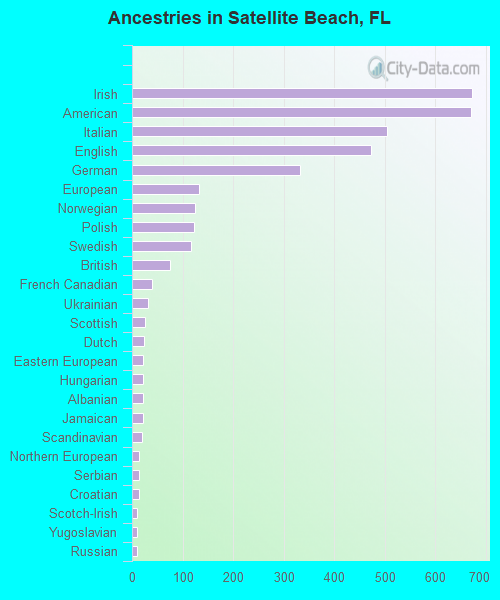
First ancestries reported:
- Irish: 673 (15.2%)
- American: 672 (15.2%)
- Italian: 504 (11.4%)
- English: 474 (10.7%)
- German: 333 (7.5%)
- European: 132 (3.0%)
- Norwegian: 124 (2.8%)
- Polish: 122 (2.8%)
- Swedish: 117 (2.7%)
- British: 75 (1.7%)
- French Canadian: 39 (0.9%)
- Ukrainian: 32 (0.7%)
- Scottish: 26 (0.6%)
- Dutch: 23 (0.5%)
- Eastern European: 21 (0.5%)
- Hungarian: 21 (0.5%)
- Albanian: 21 (0.5%)
- Jamaican: 21 (0.5%)
- Scandinavian: 19 (0.4%)
- Northern European: 13 (0.3%)
- Serbian: 13 (0.3%)
- Croatian: 13 (0.3%)
- Scotch-Irish: 10 (0.2%)
- Yugoslavian: 10 (0.2%)
- Russian: 9 (0.2%)
- Welsh: 9 (0.2%)
- Czech: 8 (0.2%)
- Lithuanian: 8 (0.2%)
- Greek: 7 (0.2%)
- French: 7 (0.2%)
- Nigerian: 6 (0.1%)
- Finnish: 5 (0.1%)
- African: 3 (0.07%)
Most common places of birth for foreign-born residents (%):
| Satellite Beach: | 12.5% (71) |
| Florida: | 2.4% (109,132) |
| Satellite Beach: | 10.0% (57) |
| Florida: | 22.0% (1,006,576) |
| Satellite Beach: | 8.1% (46) |
| Florida: | 0.1% (5,190) |
| Satellite Beach: | 6.7% (38) |
| Florida: | 0.2% (7,299) |
| Satellite Beach: | 6.2% (35) |
| Florida: | 1.8% (84,403) |
| Satellite Beach: | 4.8% (27) |
| Florida: | 5.7% (262,042) |
| Satellite Beach: | 3.9% (22) |
| Florida: | 0.5% (21,886) |
| Satellite Beach: | 3.9% (22) |
| Florida: | 0.7% (34,227) |
| Satellite Beach: | 3.7% (21) |
| Florida: | 2.1% (97,632) |
| Satellite Beach: | 3.5% (20) |
| Florida: | 0.2% (9,779) |
| Satellite Beach: | 2.8% (16) |
| Florida: | 7.5% (342,375) |
| Satellite Beach: | 2.8% (16) |
| Florida: | 6.5% (298,669) |
| Satellite Beach: | 2.5% (14) |
| Florida: | 0.4% (19,445) |
| Satellite Beach: | 2.3% (13) |
| Florida: | 0.6% (25,219) |
| Satellite Beach: | 2.3% (13) |
| Florida: | 5.0% (227,319) |
| Satellite Beach: | 2.1% (12) |
| Florida: | 0.7% (31,076) |
| Satellite Beach: | 2.1% (12) |
| Florida: | 0.4% (20,008) |
| Satellite Beach: | 2.1% (12) |
| Florida: | 1.2% (54,272) |
| Satellite Beach: | 2.1% (12) |
| Florida: | 1.1% (49,838) |
| Satellite Beach: | 1.9% (11) |
| Florida: | 0.2% (6,883) |
Place of birth for U.S.-born residents:
- This state: 3,981
- Other state: 6,693
- Northeast: 2,373
- Midwest: 1,534
- South: 1,876
- West: 899
83.7% of Satellite Beach residents lived in the same house 1 years ago.
Out of people who lived in different houses, 31.0% lived in this county.
Out of people who lived in different counties, 25.1% lived in Florida.
| Satellite Beach: | 83.7% |
| State average: | 86.3% |
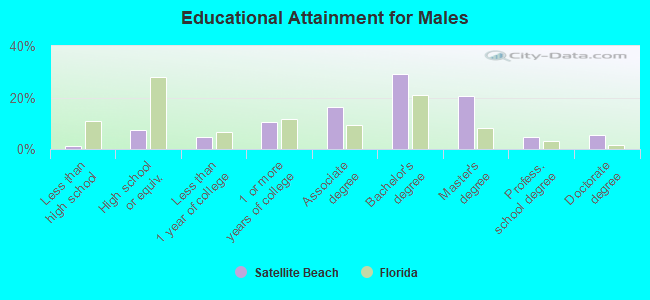
Education attainment for males 25 years and older:
- No schooling: 9
- Nursery to 4th grade: 0
- 5th and 6th grade: 0
- 7th and 8th grade: 0
- 9th grade: 4
- 10th grade: 10
- 11th grade: 0
- 12th grade, no diploma: 26
- High school graduate (or equivalency): 302
- Less than 1 year of college: 194
- Some college more than 1 year, no degree: 416
- Associate degree: 651
- Bachelor's degree: 1,182
- Master's degree: 839
- Professional school degree: 189
- Doctorate degree: 217
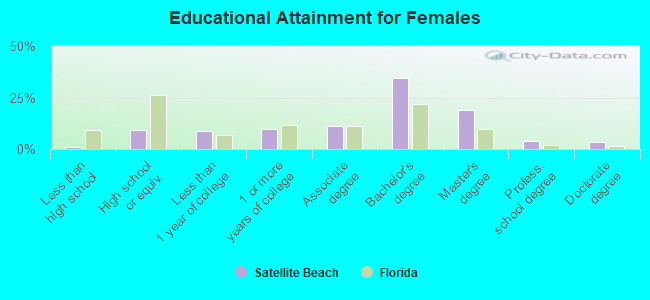
Education attainment for females 25 years and older:
- No schooling: 5
- Nursery to 4th grade: 0
- 5th and 6th grade: 0
- 7th and 8th grade: 0
- 9th grade: 0
- 10th grade: 0
- 11th grade: 3
- 12th grade, no diploma: 35
- High school graduate (or equivalency): 390
- Less than 1 year of college: 385
- Some college more than 1 year, no degree: 421
- Associate degree: 477
- Bachelor's degree: 1,492
- Master's degree: 814
- Professional school degree: 163
- Doctorate degree: 150
Housing units in structures:
- One, detached: 3,179
- One, attached: 773
- Two: 207
- 3 or 4: 81
- 5 to 9: 73
- 10 to 19: 63
- 20 to 49: 302
- 50 or more: 151
- Mobile homes: 17
Housing units lacking complete kitchen facilities in 2022: 1.7%
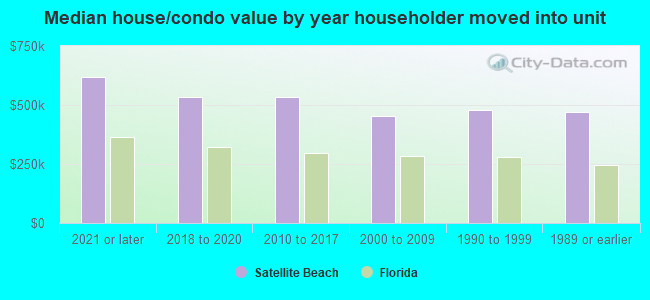
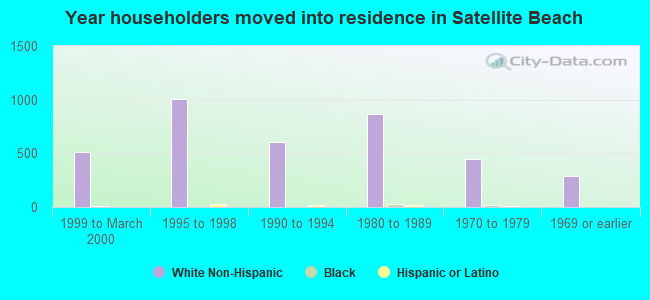
House/condo owner moved in on average 8 years ago
Renter moved in on average 0 years ago
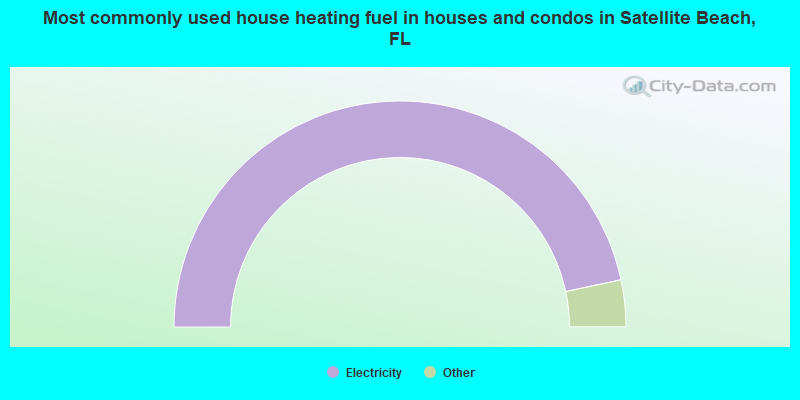
- 93.3%Electricity
- 3.5%Utility gas
- 3.1%Bottled, tank, or LP gas
- 0.2%Solar energy
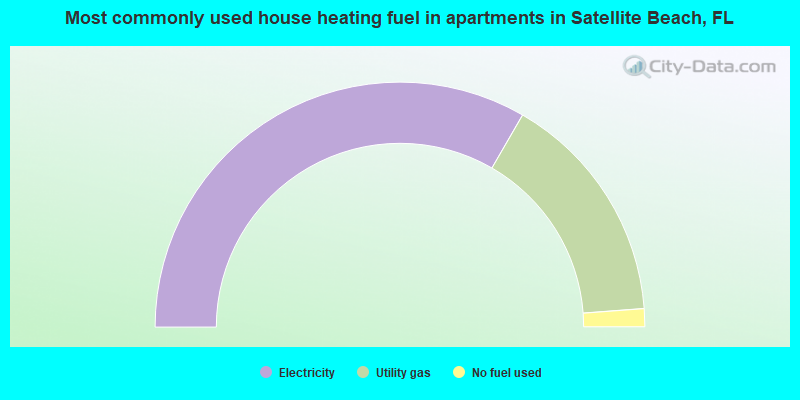
- 66.7%Electricity
- 30.9%Utility gas
- 2.4%No fuel used
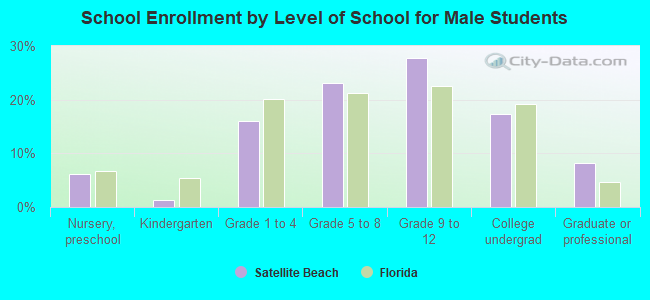
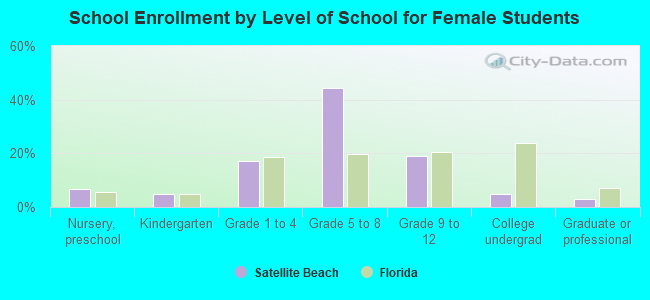
Private vs. public school enrollment:
| Here: | 13.4% |
| Florida: | 15.8% |
| Here: | 7.5% |
| Florida: | 12.9% |
| Here: | 36.4% |
| Florida: | 23.6% |