Scranton, PA (Pennsylvania) Houses and Residents
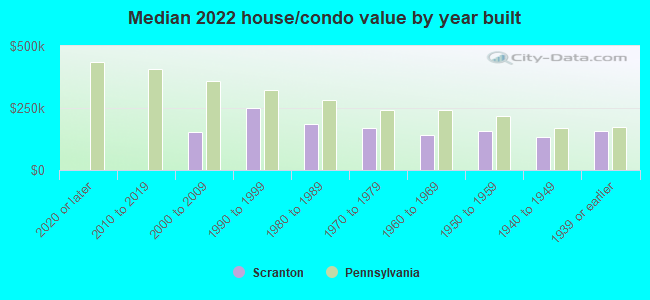
| Scranton: | $153,200 |
| Pennsylvania: | $245,500 |
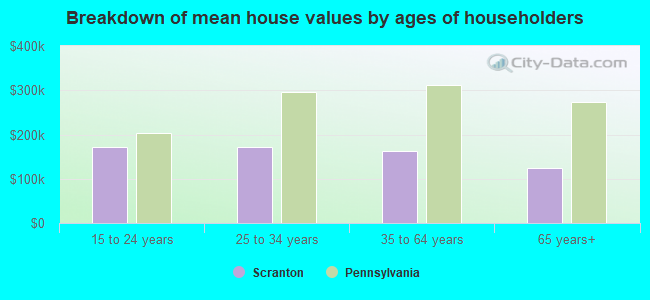
Mean price in 2022:
Detached houses: $156,454
Here: $156,454 State: $317,202 Townhouses or other attached units: $136,328
Here: $136,328 State: $254,369 In 2-unit structures: $221,284
Here: $221,284 State: $249,182 In 3-to-4-unit structures: $308,892
Here: $308,892 State: $297,446 In 5-or-more-unit structures: $67,870
Here: $67,870 State: $320,068 Mobile homes: $76,044
Here: $76,044 State: $92,414
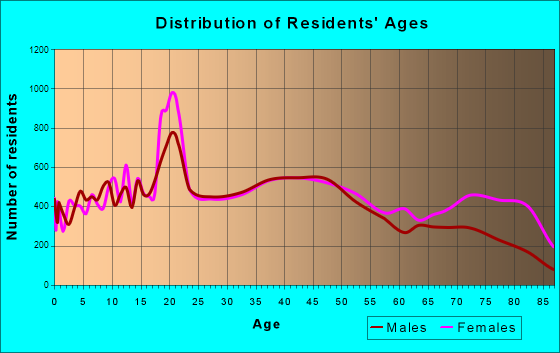
Total population: 75,281 (All urban)
Houses: 37,299 (31,998 occupied: 15,920 owner occupied, 16,078 renter occupied)
| % of renters here: | 50% |
| State: | 31% |
Housing density: 1,479 houses/condos per square mile
Median price asked for vacant for-sale houses and condos in 2022: $113,071.
Median contract rent in 2022: $760 (lower quartile is $567, upper quartile is $942)
Median rent asked for vacant for-rent units in 2022: $683
Median gross rent in Scranton, PA in 2022: $966
Housing units in Scranton with a mortgage: 7,464 (798 second mortgage, 0 home equity loan, 705 both second mortgage and home equity loan)
Houses without a mortgage: 736
Median household income for houses/condos with a mortgage: $80,420
Median household income for apartments without a mortgage: $53,401
Median monthly housing costs: $944
Compare current foreclosures in Scranton, PA:
| Photo | Address | Area | Beds / Baths | Price | Details |
|---|---|---|---|---|---|

|
#1
Cedar Ave
Scranton, PA 18505
|
1,500 sq. feet
|
1 baths 3 beds |
$26,900
|
show details |

|
#2
Maple St
Scranton, PA 18505
|
1,500 sq. feet
|
1 baths 3 beds |
$195,500
|
show details |

|
#3
N Garfield Ave
Scranton, PA 18504
|
1,776 sq. feet
|
1 baths 4 beds |
show details | |

|
#4
N Sumner Ave
Scranton, PA 18508
|
1,025 sq. feet
|
1 baths 2 beds |
show details | |

|
#5
N Main Ave
Scranton, PA 18508
|
1,400 sq. feet
|
1 baths 3 beds |
show details | |

|
#6
Pittston Ave
Scranton, PA 18505
|
1,856 sq. feet
|
2 baths 2 beds |
show details | |

|
#7
Grace St
Scranton, PA 18509
|
1,220 sq. feet
|
2 baths 4 beds |
show details | |

|
#8
S Hyde Park Ave
Scranton, PA 18504
|
1,760 sq. feet
|
2 baths 4 beds |
show details | |

|
#9
Grace St
Scranton, PA 18509
|
- sq. feet
|
- baths - beds |
$39,900
|
show details |

|
#10
N Irving Ave
Scranton, PA 18510
|
1,770 sq. feet
|
2 baths 3 beds |
show details |
| Photo | Address | Area | Beds / Baths | Price | Details |
|---|---|---|---|---|---|

|
#11
Cypress St
Scranton, PA 18512
|
- sq. feet
|
1 baths 3 beds |
show details | |

|
#12
Green Ridge St
Scranton, PA 18509
|
- sq. feet
|
- baths - beds |
show details | |

|
#13
Providence Rd # B
Scranton, PA 18508
|
- sq. feet
|
- baths - beds |
show details | |

|
#14
W Market St
Scranton, PA 18508
|
- sq. feet
|
- baths - beds |
show details | |

|
#15
-830 Alder St
Scranton, PA 18505
|
- sq. feet
|
- baths - beds |
show details | |

|
#16
4th Ave
Scranton, PA 18505
|
- sq. feet
|
- baths - beds |
show details | |

|
#17
E Locust St
Scranton, PA 18505
|
- sq. feet
|
- baths - beds |
show details | |

|
#18
Jefferson Ave
Scranton, PA 18509
|
- sq. feet
|
- baths - beds |
show details | |

|
#19
Sanderson Ave
Scranton, PA 18509
|
- sq. feet
|
- baths - beds |
show details | |

|
#20
Wyoming Ave
Scranton, PA 18509
|
- sq. feet
|
- baths - beds |
show details |
| Photo | Address | Area | Beds / Baths | Price | Details |
|---|---|---|---|---|---|

|
#21
Smallacombe Dr Unit 54
Scranton, PA 18508
|
- sq. feet
|
- baths - beds |
show details | |

|
#22
Delaware St
Scranton, PA 18509
|
- sq. feet
|
- baths - beds |
show details | |

|
#23
Lakewood Mnr
Scranton, PA 18505
|
- sq. feet
|
- baths - beds |
show details | |

|
#24
Champion Cir
Scranton, PA 18512
|
- sq. feet
|
- baths - beds |
show details | |

|
#25
E Elm St # 2
Scranton, PA 18512
|
- sq. feet
|
- baths - beds |
show details | |

|
#26
Mount Vernon Ave # 1
Scranton, PA 18508
|
- sq. feet
|
- baths - beds |
show details | |

|
#27
Marion St
Scranton, PA 18509
|
- sq. feet
|
- baths - beds |
show details | |

|
#28
Smallacombe Dr Unit 57
Scranton, PA 18508
|
- sq. feet
|
- baths - beds |
show details | |

|
#29
Electric St
Scranton, PA 18509
|
- sq. feet
|
- baths - beds |
show details | |

|
#30
Adams Ave Ste 403
Scranton, PA 18503
|
- sq. feet
|
- baths - beds |
show details |
| Photo | Address | Area | Beds / Baths | Price | Details |
|---|---|---|---|---|---|

|
#31
Regan Pl
Scranton, PA 18505
|
- sq. feet
|
- baths - beds |
show details | |

|
#32
Corner St
Scranton, PA 18512
|
- sq. feet
|
- baths - beds |
show details | |

|
#33
N Main Ave
Scranton, PA 18504
|
- sq. feet
|
- baths - beds |
show details | |

|
#34
Kane St Apt D
Scranton, PA 18505
|
- sq. feet
|
- baths - beds |
show details | |

|
#35
Elizabeth St
Scranton, PA 18504
|
- sq. feet
|
- baths - beds |
show details | |

|
#36
Laurel Dr # 2
Scranton, PA 18505
|
- sq. feet
|
- baths - beds |
show details | |

|
#37
Adams Ave Apt 304
Scranton, PA 18509
|
- sq. feet
|
- baths - beds |
show details | |

|
#38
Knox Rd Apt 109
Scranton, PA 18505
|
- sq. feet
|
- baths - beds |
show details | |

|
#39
Office
Scranton, PA 18503
|
- sq. feet
|
- baths - beds |
show details | |

|
#40
Avenue
Scranton, PA 18505
|
- sq. feet
|
- baths - beds |
show details |
| Photo | Address | Area | Beds / Baths | Price | Details |
|---|---|---|---|---|---|

|
#41
Davis St
Scranton, PA 18505
|
- sq. feet
|
- baths - beds |
show details | |

|
#42
1016 North Main Avenue Aka 1016 N.. Main Ave
Scranton, PA 18508
|
- sq. feet
|
- baths - beds |
show details | |

|
#43
1516 Luzerne Street
Scranton, PA 18504
|
- sq. feet
|
- baths - beds |
show details | |

|
#44
426 13th Avenue
Scranton, PA 18504
|
- sq. feet
|
- baths - beds |
show details | |

|
#45
Shawnee Ave
Scranton, PA 18509
|
- sq. feet
|
- baths - beds |
show details | |

|
#46
1232 Rundle Street
Scranton, PA 18504
|
- sq. feet
|
- baths - beds |
show details | |

|
#47
Being 1615 Ash Street
Scranton, PA 18510
|
- sq. feet
|
- baths - beds |
show details | |

|
#48
Being 922 North Irving Ave.
Scranton, PA 18510
|
- sq. feet
|
- baths - beds |
show details | |

|
#49
312 Cypress Street
Scranton, PA 18512
|
- sq. feet
|
- baths - beds |
show details | |

|
Check over 1 million property listings on Foreclosure.com!
|
browse all offers | |||

Latest news about housing in Scranton, PA collected exclusively by city-data.com from local newspapers, TV, and radio stations

 | Scranton Luxury condos (3 replies) |
| Home shortage in Scranton (2 replies) |
| Moving to Scranton - suggested rental homes/apts? (41 replies) |
| condos or townhouses (5 replies) |
| Close to Philadelphia second home great for kids (6 replies) |
| Offered a job in Swiftwater, housing holding us back (17 replies) |
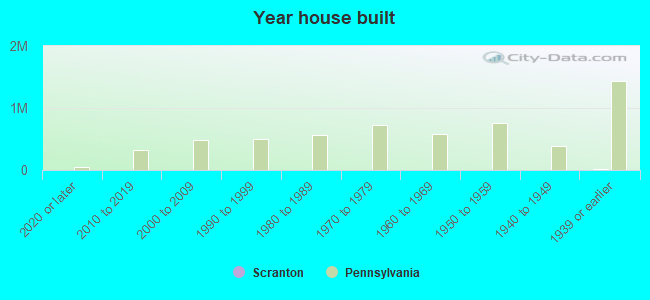
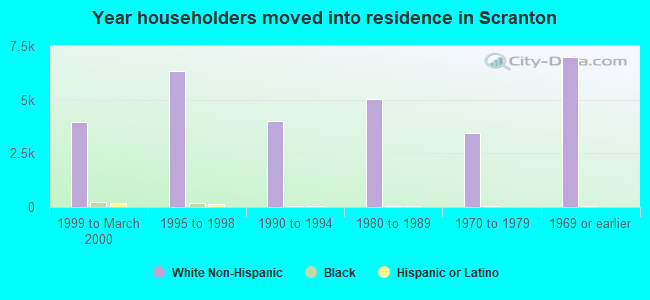
Median year apartment built: 1948
Household type by relationship:
Households: 75,838- Male householders: 15,109 (4,934 living alone), Female householders: 16,889 (7,505 living alone)
8,996 spouses (8,850 opposite-sex spouses), 3,335 unmarried partners, (3,290 opposite-sex unmarried partners), 20,120 children (19,409 natural, 0 adopted, 711 stepchildren), 1,629 grandchildren, 603 brothers or sisters, 479 parents, 0 foster children, 982 other relatives, 2,192 non-relatives
- In group quarters: 5,504
Size of family households: 7,043 2-persons, 4,173 3-persons, 2,683 4-persons, 1,438 5-persons, 581 6-persons, 199 7-or-more-persons.
Size of nonfamily households: 12,439 1-person, 2,956 2-persons, 212 3-persons, 92 4-persons, 182 5-persons.
5,713 married couples with children.
7,203 single-parent households (736 men, 6,467 women).
81.4% of residents of Scranton speak English at home.
11.7% of residents speak Spanish at home (61% speak English very well, 19% speak English well, 17% speak English not well, 4% don't speak English at all).
5.0% of residents speak other Indo-European language at home (46% speak English very well, 34% speak English well, 15% speak English not well, 5% don't speak English at all).
1.5% of residents speak Asian or Pacific Island language at home (49% speak English very well, 15% speak English well, 24% speak English not well, 13% don't speak English at all).
0.8% of residents speak other language at home (41% speak English very well, 17% speak English well, 43% speak English not well).
Foreign born population: 7,477 (9.9%)
(56.7% of them are naturalized citizens)
| Here: | 6.4 |
| State: | 6.8 |
| Here: | 4.5 |
| State: | 4.3 |
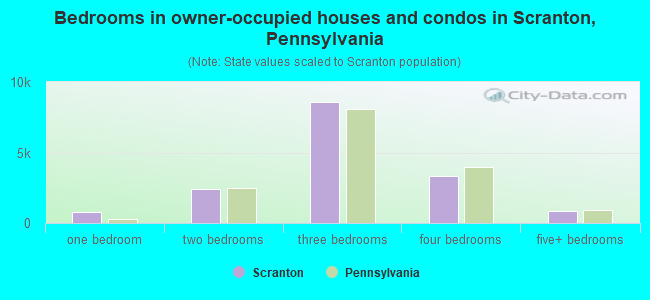
- Bedrooms in owner-occupied houses and condos in Scranton, Pennsylvania
- 0no bedroom
- 7561 bedroom
- 2,3962 bedrooms
- 8,5873 bedrooms
- 3,3104 bedrooms
- 8715+ bedrooms
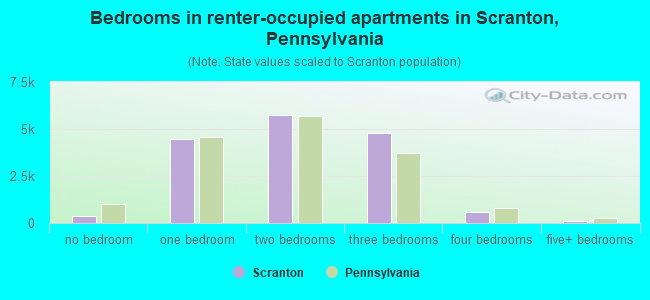
- Bedrooms in renter-occupied apartments in Scranton, Pennsylvania
- 358no bedroom
- 4,4771 bedroom
- 5,7532 bedrooms
- 4,7723 bedrooms
- 6104 bedrooms
- 1085+ bedrooms
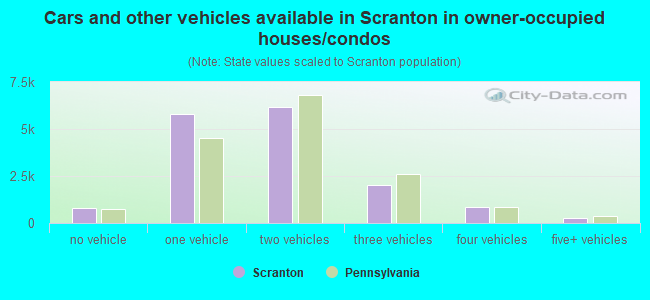
- Cars and other vehicles available in Scranton in owner-occupied houses/condos
- 778no vehicle
- 5,8141 vehicle
- 6,1962 vehicles
- 2,0303 vehicles
- 8324 vehicles
- 2705+ vehicles
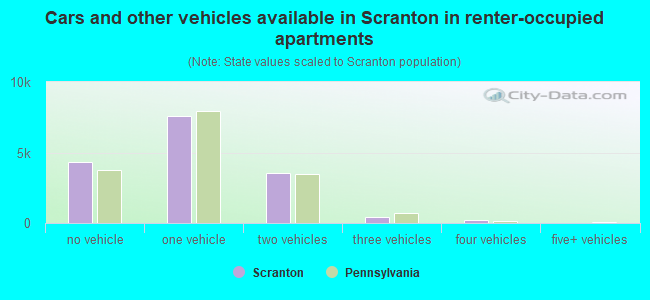
- Cars and other vehicles available in Scranton in renter-occupied apartments
- 4,309no vehicle
- 7,5881 vehicle
- 3,5772 vehicles
- 4223 vehicles
- 1824 vehicles
- 05+ vehicles
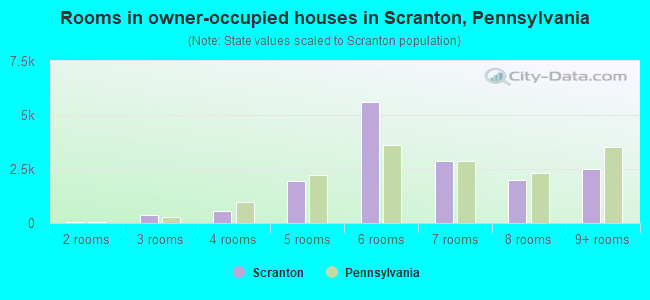
- Rooms in owner-occupied houses in Scranton, Pennsylvania
- 01 room
- 682 rooms
- 3813 rooms
- 5614 rooms
- 1,9445 rooms
- 5,6126 rooms
- 2,8637 rooms
- 2,0098 rooms
- 2,4829+ rooms
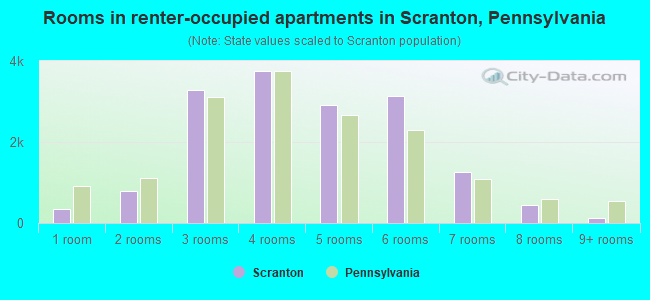
- Rooms in renter-occupied apartments in Scranton, Pennsylvania
- 3581 room
- 7912 rooms
- 3,2883 rooms
- 3,7654 rooms
- 2,9235 rooms
- 3,1396 rooms
- 1,2477 rooms
- 4418 rooms
- 1269+ rooms
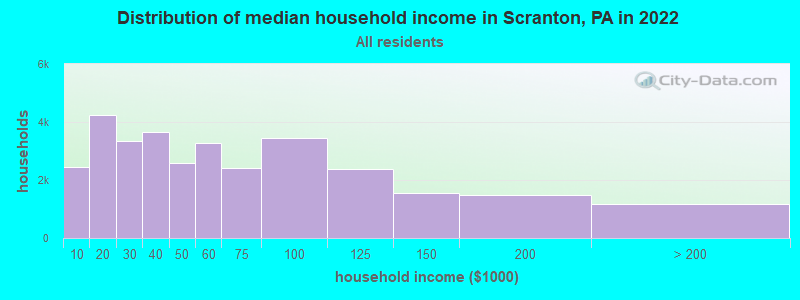
Scranton, PA household income distribution

- 2,436Less than $10,000
- 4,252$10,000 to $19,999
- 3,360$20,000 to $29,999
- 3,640$30,000 to $39,999
- 2,596$40,000 to $49,999
- 3,279$50,000 to $59,999
- 2,419$60,000 to $74,999
- 3,442$75,000 to $99,999
- 2,368$100,000 to $124,999
- 1,557$125,000 to $149,999
- 1,484$150,000 to $199,999
- 1,165$200,000 or more
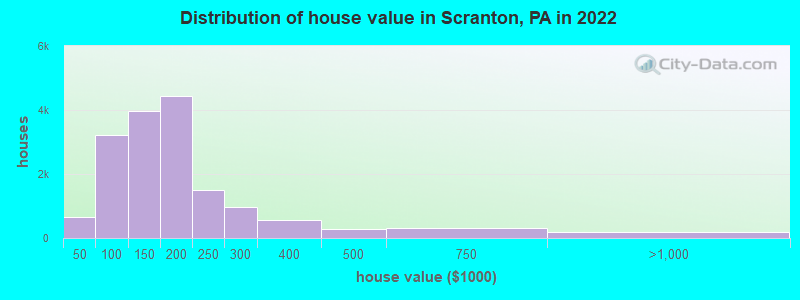
Home value of owner - occupied houses in 2022 in Scranton, PA
-
- 160Less than $10,000
- 86$10,000 to $14,999
- 92$15,000 to $19,999
- 64$20,000 to $24,999
- 56$30,000 to $34,999
- 187$40,000 to $49,999
- 318$50,000 to $59,999
- 667$60,000 to $69,999
- 736$70,000 to $79,999
- 628$80,000 to $89,999
- 683$90,000 to $99,999
- 2,097$100,000 to $124,999
- 1,882$125,000 to $149,999
- 2,396$150,000 to $174,999
- 2,052$175,000 to $199,999
- 1,499$200,000 to $249,999
- 979$250,000 to $299,999
- 550$300,000 to $399,999
- 276$400,000 to $499,999
- 321$500,000 to $749,999
- 191$750,000 to $999,999
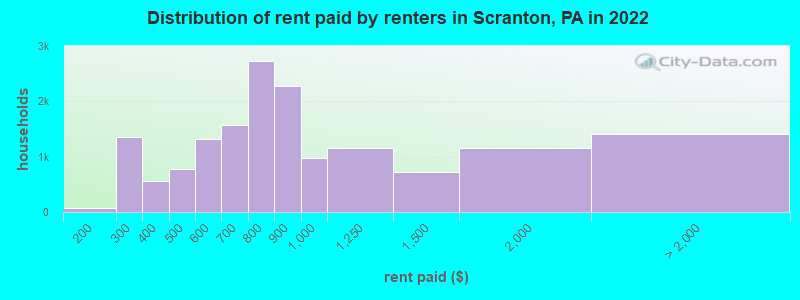
Rent paid by renters in 2022 in Scranton, PA
-
- 70$150 to $199
- 1,157$200 to $249
- 206$250 to $299
- 193$300 to $349
- 364$350 to $399
- 568$400 to $449
- 211$450 to $499
- 714$500 to $549
- 600$550 to $599
- 837$600 to $649
- 730$650 to $699
- 1,476$700 to $749
- 1,260$750 to $799
- 2,277$800 to $899
- 967$900 to $999
- 1,153$1,000 to $1,249
- 717$1,250 to $1,499
- 1,164$1,500 to $1,999
- 47$2,000 to $2,499
- 48$2,500 to $2,999
- 1,319No cash rent
Percentage of workers working in this county: 81.9%
Number of people working at home: 2,864 (8.4% of all workers)
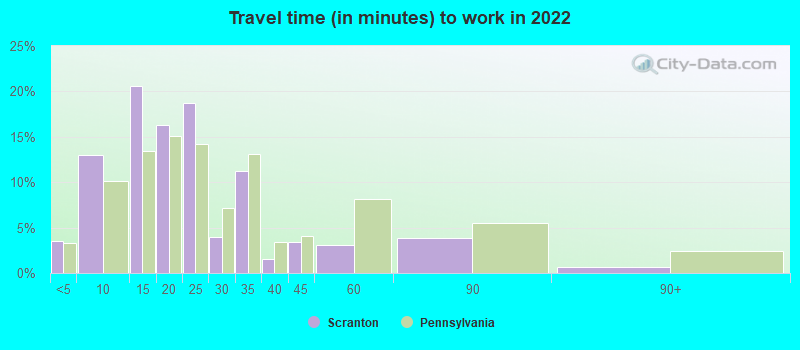
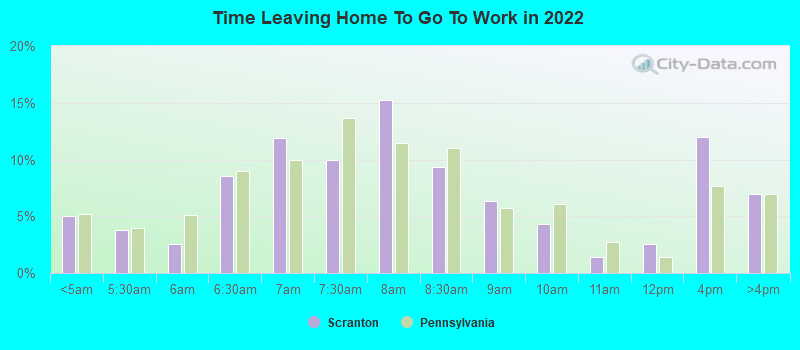
Travel time to work (commute)
- Less than 5 minutes: 1,342
- 5 to 9 minutes: 4,645
- 10 to 14 minutes: 7,955
- 15 to 19 minutes: 6,271
- 20 to 24 minutes: 4,322
- 25 to 29 minutes: 878
- 30 to 34 minutes: 3,064
- 35 to 39 minutes: 556
- 40 to 44 minutes: 412
- 45 to 59 minutes: 782
- 60 to 89 minutes: 664
- 90 or more minutes: 201
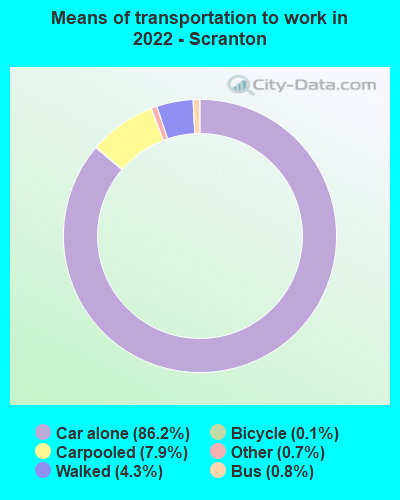
Means of transportation to work:
- Drove a car alone: 30,287 (78.3%)
- Carpooled: 2,777 (7.2%)
- Bus: 206 (0.5%)
- Long-distance train or commuter rail: 1 (0.0%)
- Taxi: 282 (0.7%)
- Bicycle: 59 (0.2%)
- Walked: 1,518 (3.9%)
- Worked at home: 3,043 (7.9%)
- Unemployment by race in 2022
- Unemployment rate for White non-Hispanic residents
- 1.4%Males
- 3.5%Females
- Unemployment rate for Black residents
- 4.7%Males
- 3.5%Females
- Unemployment rate for American Indian and Alaska Native residents
- 57.8%Females
- Unemployment rate for Asian residents
- 1.3%Males
- 3.2%Females
- Unemployment rate for other race residents
- 8.1%Males
- 5.0%Females
- Unemployment rate for two or more race residents
- 6.3%Males
- 13.8%Females
- Unemployment rate for Hispanic or Latino residents
- 7.1%Males
- 9.3%Females
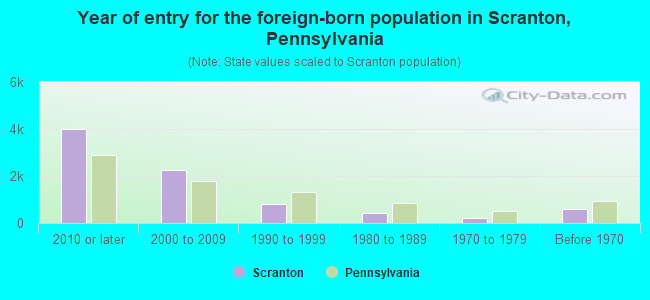
- Year of entry for the foreign-born population in Scranton, Pennsylvania
- 4,0132010 or later
- 2,2532000 to 2009
- 8291990 to 1999
- 4151980 to 1989
- 2121970 to 1979
- 589Before 1970
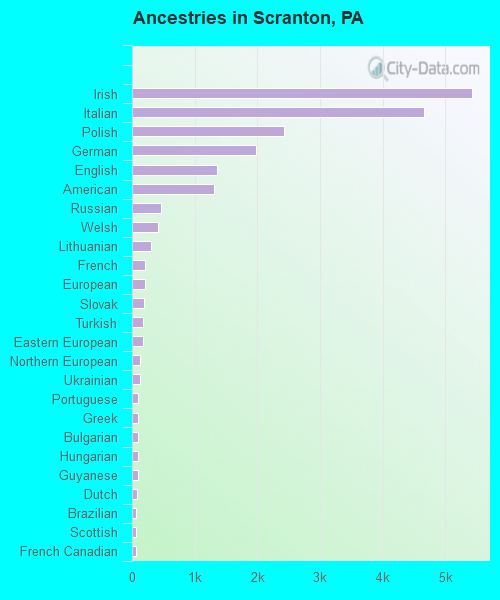
First ancestries reported:
- Irish: 5,428 (15.5%)
- Italian: 4,661 (13.3%)
- Polish: 2,422 (6.9%)
- German: 1,986 (5.7%)
- English: 1,363 (3.9%)
- American: 1,313 (3.8%)
- Russian: 464 (1.3%)
- Welsh: 421 (1.2%)
- Lithuanian: 305 (0.9%)
- French: 209 (0.6%)
- European: 204 (0.6%)
- Slovak: 186 (0.5%)
- Turkish: 174 (0.5%)
- Eastern European: 169 (0.5%)
- Northern European: 128 (0.4%)
- Ukrainian: 126 (0.4%)
- Portuguese: 103 (0.3%)
- Greek: 102 (0.3%)
- Bulgarian: 98 (0.3%)
- Hungarian: 90 (0.3%)
- Guyanese: 89 (0.3%)
- Dutch: 77 (0.2%)
- Brazilian: 71 (0.2%)
- Scottish: 67 (0.2%)
- French Canadian: 63 (0.2%)
- Kenyan: 61 (0.2%)
- Pennsylvania German: 60 (0.2%)
- Jamaican: 53 (0.2%)
- Haitian: 46 (0.1%)
- Scotch-Irish: 40 (0.1%)
- Austrian: 39 (0.1%)
- Albanian: 37 (0.1%)
- Czech: 36 (0.1%)
- African: 33 (0.09%)
- Carpatho Rusyn: 31 (0.09%)
- Czechoslovakian: 30 (0.09%)
- Lebanese: 27 (0.08%)
- Iranian: 27 (0.08%)
- Afghan: 19 (0.05%)
- Cape Verdean: 17 (0.05%)
- Israeli: 16 (0.05%)
- British: 15 (0.04%)
- Sierra Leonean: 13 (0.04%)
- Swedish: 13 (0.04%)
- Romanian: 12 (0.03%)
- Arab: 12 (0.03%)
- Egyptian: 11 (0.03%)
- Norwegian: 11 (0.03%)
- Slavic: 11 (0.03%)
- Yugoslavian: 10 (0.03%)
- Slovene: 7 (0.02%)
- Nigerian: 4 (0.01%)
- British West Indian: 4 (0.01%)
- Croatian: 3 (0.01%)
- Armenian: 3 (0.01%)
Most common places of birth for foreign-born residents (%):
| Scranton: | 15.0% (1,195) |
| Pennsylvania: | 10.7% (100,596) |
| Scranton: | 13.2% (1,053) |
| Pennsylvania: | 9.2% (86,544) |
| Scranton: | 12.4% (988) |
| Pennsylvania: | 5.8% (54,190) |
| Scranton: | 5.9% (471) |
| Pennsylvania: | 0.9% (8,463) |
| Scranton: | 5.1% (406) |
| Pennsylvania: | 0.7% (6,855) |
| Scranton: | 4.0% (316) |
| Pennsylvania: | 0.8% (7,882) |
| Scranton: | 3.1% (249) |
| Pennsylvania: | 1.6% (15,272) |
| Scranton: | 3.0% (242) |
| Pennsylvania: | 1.4% (13,077) |
| Scranton: | 3.0% (239) |
| Pennsylvania: | 1.1% (10,035) |
| Scranton: | 2.9% (230) |
| Pennsylvania: | 2.2% (21,039) |
| Scranton: | 2.6% (209) |
| Pennsylvania: | 7.2% (67,704) |
| Scranton: | 2.4% (192) |
| Pennsylvania: | 0.6% (6,036) |
| Scranton: | 2.3% (186) |
| Pennsylvania: | 0.1% (1,263) |
| Scranton: | 2.3% (181) |
| Pennsylvania: | 0.2% (1,752) |
| Scranton: | 2.1% (170) |
| Pennsylvania: | 3.3% (31,542) |
| Scranton: | 1.7% (136) |
| Pennsylvania: | 0.5% (4,441) |
Place of birth for U.S.-born residents:
- This state: 50,150
- Other state: 15,898
- Northeast: 11,714
- Midwest: 698
- South: 2,911
- West: 575
80.4% of Scranton residents lived in the same house 1 years ago.
Out of people who lived in different houses, 40.2% lived in this county.
Out of people who lived in different counties, 39.7% lived in Pennsylvania.
| Scranton: | 80.4% |
| State average: | 89.3% |
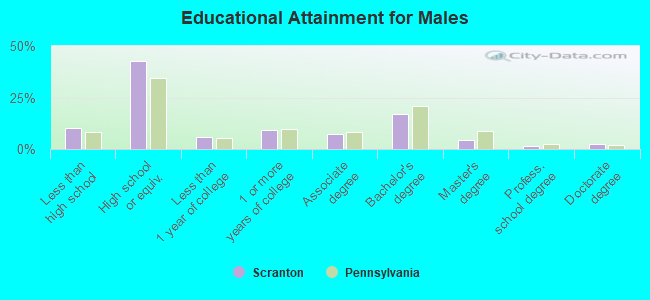
Education attainment for males 25 years and older:
- No schooling: 224
- Nursery to 4th grade: 48
- 5th and 6th grade: 220
- 7th and 8th grade: 162
- 9th grade: 244
- 10th grade: 330
- 11th grade: 560
- 12th grade, no diploma: 617
- High school graduate (or equivalency): 9,978
- Less than 1 year of college: 1,326
- Some college more than 1 year, no degree: 2,126
- Associate degree: 1,701
- Bachelor's degree: 3,949
- Master's degree: 991
- Professional school degree: 351
- Doctorate degree: 599
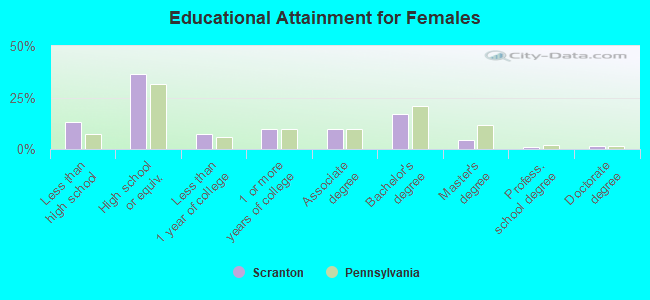
Education attainment for females 25 years and older:
- No schooling: 516
- Nursery to 4th grade: 153
- 5th and 6th grade: 93
- 7th and 8th grade: 285
- 9th grade: 270
- 10th grade: 531
- 11th grade: 1,044
- 12th grade, no diploma: 713
- High school graduate (or equivalency): 9,972
- Less than 1 year of college: 1,974
- Some college more than 1 year, no degree: 2,674
- Associate degree: 2,714
- Bachelor's degree: 4,646
- Master's degree: 1,204
- Professional school degree: 249
- Doctorate degree: 346
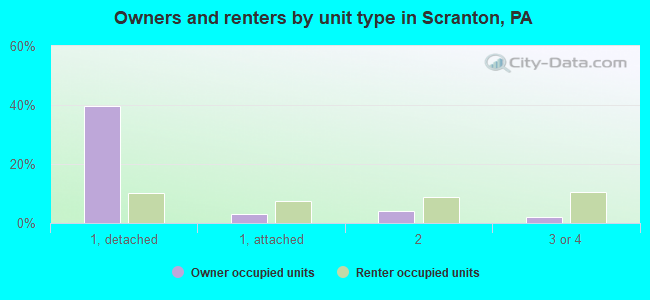
Housing units in structures:
- One, detached: 19,053
- One, attached: 3,811
- Two: 4,136
- 3 or 4: 4,906
- 5 to 9: 896
- 10 to 19: 1,293
- 20 to 49: 640
- 50 or more: 2,357
- Mobile homes: 207
Housing units lacking complete kitchen facilities in 2022: 3.6%
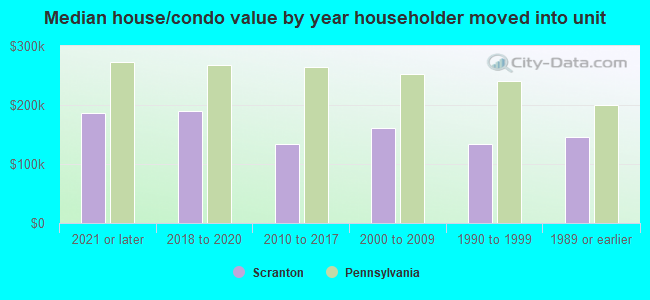
House/condo owner moved in on average 25 years ago
Renter moved in on average 3 years ago
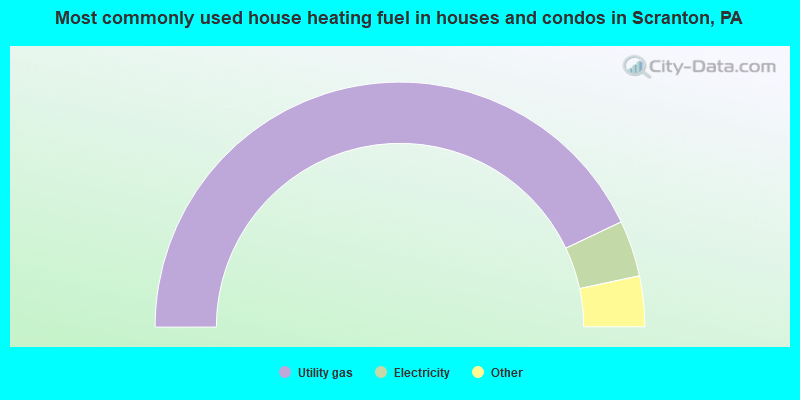
- 86.0%Utility gas
- 7.4%Electricity
- 3.2%Fuel oil, kerosene, etc.
- 1.9%Bottled, tank, or LP gas
- 0.9%Coal or coke
- 0.5%Wood
- 0.1%Other fuel
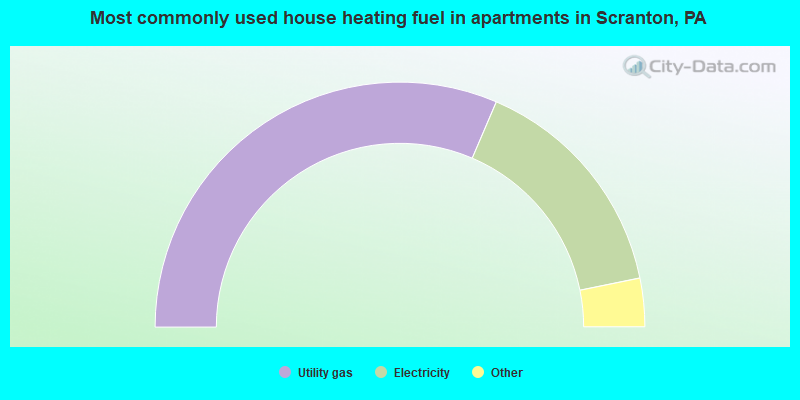
- 62.9%Utility gas
- 30.7%Electricity
- 1.9%Bottled, tank, or LP gas
- 1.6%Fuel oil, kerosene, etc.
- 1.3%Other fuel
- 1.3%No fuel used
- 0.3%Coal or coke
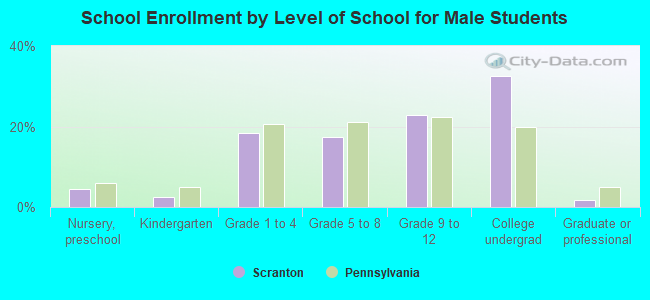
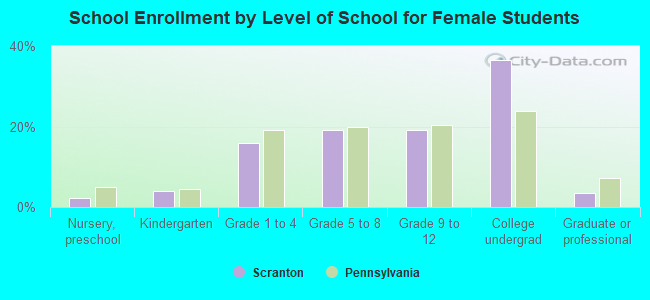
Private vs. public school enrollment:
| Here: | 5.7% |
| Pennsylvania: | 15.7% |
| Here: | 13.1% |
| Pennsylvania: | 13.4% |
| Here: | 71.2% |
| Pennsylvania: | 39.8% |