Seattle Hill-Silver Firs, WA (Washington) Houses and Residents
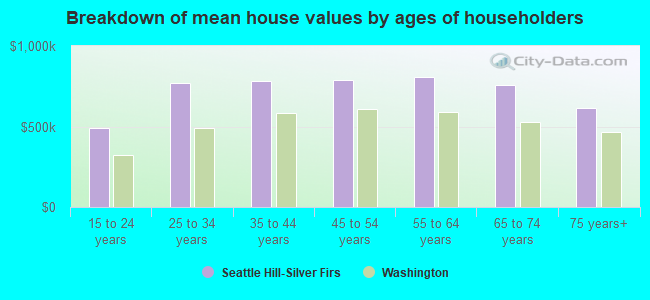
| Seattle Hill-Silver Firs: | $821,730 |
| Washington: | $569,500 |
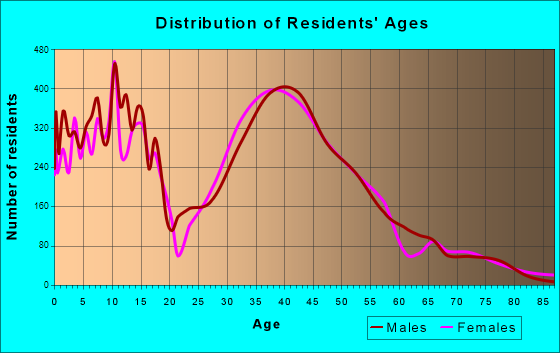
Total population: 39,176 (Urban population: 35,551, Rural population: 0)
Houses: 11,840 (11,627 occupied: 10,663 owner occupied, 964 renter occupied)
| % of renters here: | 8% |
| State: | 36% |
Housing density: 849 houses/condos per square mile
Median price asked for vacant for-sale houses and condos in 2022 in this county: $628,500.
Median contract rent in 2022: over $2,000 (lower quartile is $1,660, upper quartile is over $2,000)
Median rent asked for vacant for-rent units in 2022: $2,726
Median gross rent in Seattle Hill-Silver Firs, WA in 2022: over $2,000
Housing units in Seattle Hill-Silver Firs with a mortgage: 8,772 (1,043 second mortgage, 1,154 home equity loan, 28 both second mortgage and home equity loan)
Houses without a mortgage: 1,073
Compare current foreclosures near Seattle Hill-Silver Firs, WA:
| Photo | Address | Area | Beds / Baths | Price | Details |
|---|---|---|---|---|---|

|
#1
3rd Dr SE
Bothell, WA 98012
|
1,957 sq. feet
|
2 baths 4 beds |
show details | |

|
#2
Rucker Ave Apt 9
Everett, WA 98201
|
879 sq. feet
|
1 baths 2 beds |
show details | |

|
#3
4th Ave W Apt 6a
Everett, WA 98204
|
1,346 sq. feet
|
3 baths 2 beds |
show details | |

|
#4
100th St SW Apt B206
Everett, WA 98204
|
856 sq. feet
|
2 baths 2 beds |
show details | |

|
#5
64th Pl NE
Marysville, WA 98270
|
1,132 sq. feet
|
1 baths 3 beds |
show details | |

|
#6
19th Dr SE
Bothell, WA 98012
|
852 sq. feet
|
1 baths 3 beds |
show details | |

|
#7
17th St NE
Lake Stevens, WA 98258
|
1,368 sq. feet
|
2 baths 3 beds |
show details | |

|
#8
63rd Pl NE
Marysville, WA 98270
|
2,082 sq. feet
|
2 baths 4 beds |
show details | |

|
#9
& 29424 181st Street SE
Monroe, WA 98272
|
1,634 sq. feet
|
2 baths 3 beds |
show details | |

|
#10
199th St SW
Bothell, WA 98012
|
2,846 sq. feet
|
2 baths 4 beds |
show details |
| Photo | Address | Area | Beds / Baths | Price | Details |
|---|---|---|---|---|---|

|
#11
Interurban Blvd
Snohomish, WA 98296
|
1,156 sq. feet
|
1 baths 3 beds |
show details | |

|
#12
20th Ave SE
Bothell, WA 98021
|
1,552 sq. feet
|
2 baths 3 beds |
show details | |

|
#13
NE 190th St
Seattle, WA 98155
|
2,070 sq. feet
|
2 baths 5 beds |
show details | |

|
#14
Leonard Dr
Everett, WA 98201
|
1,000 sq. feet
|
1 baths 3 beds |
show details | |

|
#15
Howard Ave NE
Kingston, WA 98346
|
1,008 sq. feet
|
1 baths 2 beds |
show details | |

|
#16
Storm Lake Rd
Snohomish, WA 98290
|
2,323 sq. feet
|
3 baths 3 beds |
show details | |

|
#17
Autumn Ln
Clinton, WA 98236
|
1,940 sq. feet
|
3 baths 2 beds |
show details | |

|
#18
NE 64th St
Redmond, WA 98053
|
1,540 sq. feet
|
1 baths 3 beds |
show details | |

|
#19
Cascadian Way
Bothell, WA 98012
|
1,492 sq. feet
|
2 baths 3 beds |
show details | |

|
#20
4th Ave W
Everett, WA 98204
|
1,206 sq. feet
|
2 baths 2 beds |
show details |
| Photo | Address | Area | Beds / Baths | Price | Details |
|---|---|---|---|---|---|

|
#21
Ravenna Ave NE
Seattle, WA 98125
|
1,660 sq. feet
|
2 baths 4 beds |
show details | |

|
#22
S Camano Dr
Camano Island, WA 98282
|
1,772 sq. feet
|
1 baths 2 beds |
show details | |

|
#23
NE 172nd St
Duvall, WA 98019
|
3,780 sq. feet
|
3 baths 4 beds |
show details | |

|
#24
NE 205th St
Kenmore, WA 98028
|
1,210 sq. feet
|
2 baths 3 beds |
show details | |

|
#25
114th Ave NE
Kirkland, WA 98033
|
1,950 sq. feet
|
2 baths 4 beds |
show details | |

|
#26
116th Ave NE
Kirkland, WA 98033
|
1,260 sq. feet
|
2 baths 3 beds |
show details | |

|
#27
2nd Pl SE
Lake Stevens, WA 98258
|
1,504 sq. feet
|
2 baths 3 beds |
show details | |

|
#28
20th Ave W
Lynnwood, WA 98037
|
912 sq. feet
|
1 baths 3 beds |
show details | |

|
#29
N Ridge Dr
Snohomish, WA 98290
|
2,033 sq. feet
|
3 baths 3 beds |
show details | |

|
#30
1st Ave NE
Seattle, WA 98115
|
1,110 sq. feet
|
1 baths 4 beds |
show details |
| Photo | Address | Area | Beds / Baths | Price | Details |
|---|---|---|---|---|---|

|
#31
51st Ave NE
Marysville, WA 98271
|
1,174 sq. feet
|
2 baths 3 beds |
show details | |

|
#32
51st Ave NE
Seattle, WA 98115
|
2,450 sq. feet
|
2 baths 4 beds |
show details | |

|
#33
320th Ave NE
Duvall, WA 98019
|
3,140 sq. feet
|
2 baths 3 beds |
show details | |

|
#34
173rd Pl SE
Monroe, WA 98272
|
1,024 sq. feet
|
2 baths 3 beds |
show details | |

|
#35
5th Ave NE
Seattle, WA 98155
|
1,460 sq. feet
|
1 baths 3 beds |
show details | |

|
#36
91st Ave W
Edmonds, WA 98026
|
1,504 sq. feet
|
1 baths 3 beds |
show details | |

|
#37
67th Pl W
Mountlake Terrace, WA 98043
|
2,194 sq. feet
|
2 baths 5 beds |
show details | |

|
#38
13th Ave NW
Seattle, WA 98117
|
1,490 sq. feet
|
2 baths 3 beds |
show details | |

|
#39
93rd St SW
Everett, WA 98204
|
1,022 sq. feet
|
1 baths 3 beds |
show details | |

|
#40
NE Woodinville Duvall Rd
Woodinville, WA 98072
|
1,520 sq. feet
|
1 baths 2 beds |
show details |
| Photo | Address | Area | Beds / Baths | Price | Details |
|---|---|---|---|---|---|

|
#41
123rd Pl NE
Marysville, WA 98271
|
1,018 sq. feet
|
1 baths 3 beds |
show details | |

|
#42
NE 173rd St
Woodinville, WA 98072
|
2,730 sq. feet
|
2 baths 3 beds |
show details | |

|
#43
N 161st Pl Unit A308 Aka 700 N 160th St Unit A308
Seattle, WA 98133
|
- sq. feet
|
1 baths 1 beds |
show details | |

|
#44
Heintz Ave SE
Monroe, WA 98272
|
1,455 sq. feet
|
2 baths 3 beds |
show details | |

|
#45
Harrison Ave
Everett, WA 98201
|
735 sq. feet
|
1 baths 2 beds |
show details | |

|
#46
W Casino Rd Apt 63
Everett, WA 98204
|
1,203 sq. feet
|
2 baths 2 beds |
show details | |

|
#47
49th Ave SE
Bothell, WA 98012
|
1,756 sq. feet
|
2 baths 3 beds |
show details | |

|
#48
NE 88th St
Seattle, WA 98115
|
2,200 sq. feet
|
2 baths 3 beds |
show details | |

|
#49
Woods Creek Rd
Monroe, WA 98272
|
2,496 sq. feet
|
2 baths 4 beds |
show details | |

|
Check over 1 million property listings on Foreclosure.com!
|
browse all offers | |||

Household type by relationship:
Households: 702,938- In family households: 589,694 (132,675 male householders, 49,607 female householders)
140,500 spouses, 208,748 children (193,212 natural, 5,027 adopted, 10,509 stepchildren), 9,881 grandchildren, 6,965 brothers or sisters, 6,533 parents, foster children, 9,131 other relatives, 20,713 non-relatives
- In nonfamily households: 113,244 (43,016 male householders (30,707 living alone)), 43,027 female householders (34,612 living alone)), 27,201 nonrelatives
- In group quarters: 10,397 (5,769 institutionalized population)
121,078 married couples with children.
33,184 single-parent households (9,051 men, 24,133 women).
88.9% of residents of Seattle Hill-Silver Firs speak English at home.
1.9% of residents speak Spanish at home (75% speak English very well, 8% speak English well, 15% speak English not well, 1% don't speak English at all).
3.1% of residents speak other Indo-European language at home (71% speak English very well, 18% speak English well, 12% speak English not well).
5.6% of residents speak Asian or Pacific Island language at home (51% speak English very well, 30% speak English well, 16% speak English not well, 3% don't speak English at all).
0.4% of residents speak other language at home (61% speak English very well, 24% speak English well, 15% speak English not well).
Foreign born population: 8,490 (17.2%)
(62.5% of them are naturalized citizens)
| Here: | 7.6 |
| State: | 6.5 |
| Here: | 5.0 |
| State: | 3.9 |
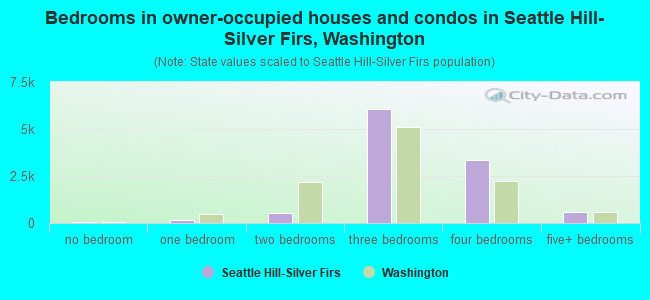
- Bedrooms in owner-occupied houses and condos in Seattle Hill-Silver Firs, Washington
- 31no bedroom
- 1511 bedroom
- 5292 bedrooms
- 6,0403 bedrooms
- 3,3414 bedrooms
- 5715+ bedrooms
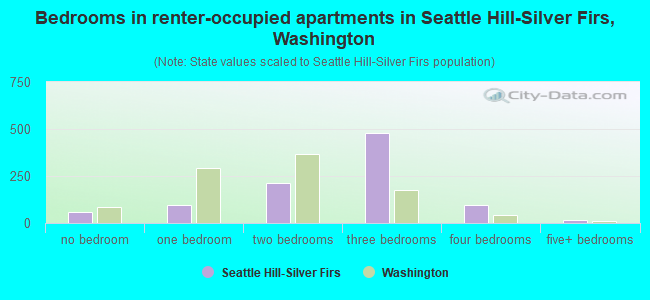
- Bedrooms in renter-occupied apartments in Seattle Hill-Silver Firs, Washington
- 58no bedroom
- 971 bedroom
- 2152 bedrooms
- 4813 bedrooms
- 964 bedrooms
- 175+ bedrooms
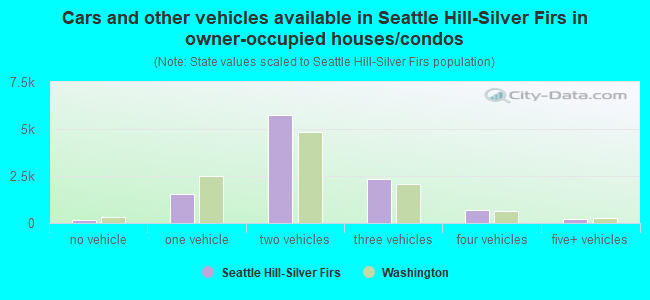
- Cars and other vehicles available in Seattle Hill-Silver Firs in owner-occupied houses/condos
- 148no vehicle
- 1,5361 vehicle
- 5,7262 vehicles
- 2,3293 vehicles
- 6874 vehicles
- 2375+ vehicles
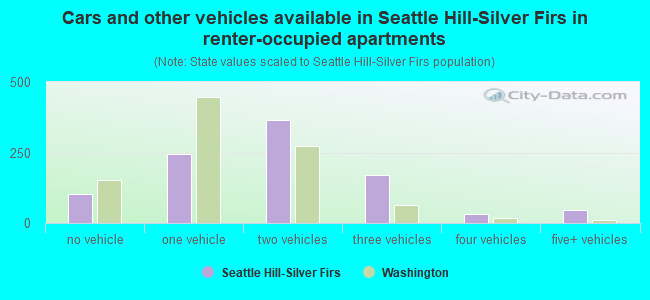
- Cars and other vehicles available in Seattle Hill-Silver Firs in renter-occupied apartments
- 102no vehicle
- 2461 vehicle
- 3672 vehicles
- 1713 vehicles
- 314 vehicles
- 475+ vehicles
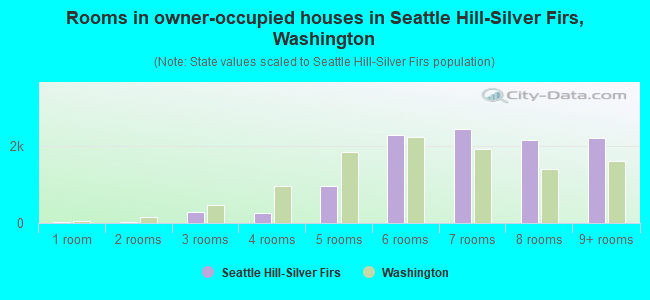
- Rooms in owner-occupied houses in Seattle Hill-Silver Firs, Washington
- 161 room
- 312 rooms
- 2923 rooms
- 2534 rooms
- 9595 rooms
- 2,2896 rooms
- 2,4437 rooms
- 2,1588 rooms
- 2,2229+ rooms
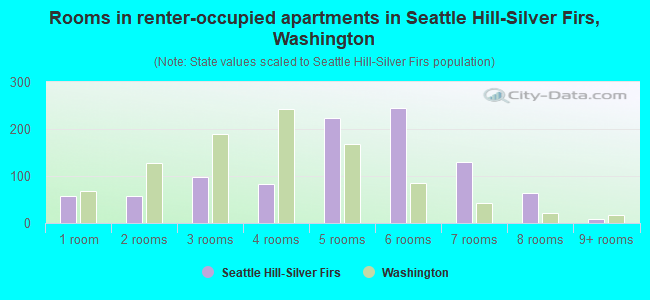
- Rooms in renter-occupied apartments in Seattle Hill-Silver Firs, Washington
- 581 room
- 572 rooms
- 973 rooms
- 824 rooms
- 2245 rooms
- 2456 rooms
- 1307 rooms
- 638 rooms
- 89+ rooms
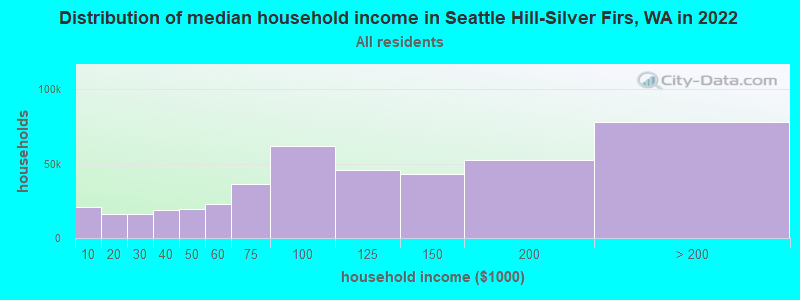
Seattle Hill-Silver Firs, WA household income distribution

- 20,568Less than $10,000
- 16,405$10,000 to $19,999
- 15,921$20,000 to $29,999
- 18,591$30,000 to $39,999
- 19,491$40,000 to $49,999
- 22,836$50,000 to $59,999
- 36,519$60,000 to $74,999
- 61,603$75,000 to $99,999
- 45,443$100,000 to $124,999
- 42,681$125,000 to $149,999
- 52,598$150,000 to $199,999
- 77,921$200,000 or more
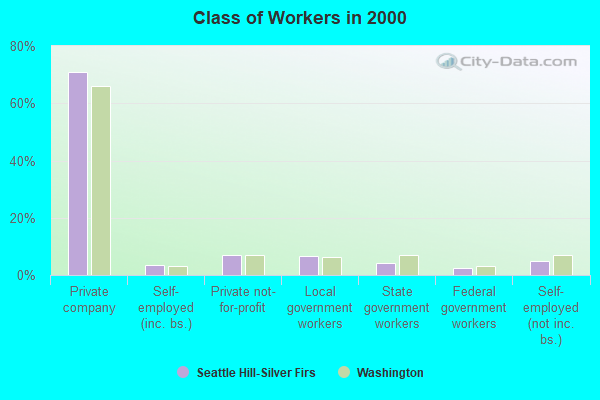
Percentage of workers working in this county: 70.1%
Number of people working at home: 5,609 (21.6% of all workers)
Travel time to work (commute)
- Less than 5 minutes: 171
- 5 to 9 minutes: 1,019
- 10 to 14 minutes: 1,855
- 15 to 19 minutes: 2,897
- 20 to 24 minutes: 2,664
- 25 to 29 minutes: 1,026
- 30 to 34 minutes: 2,527
- 35 to 39 minutes: 565
- 40 to 44 minutes: 908
- 45 to 59 minutes: 1,931
- 60 to 89 minutes: 1,618
- 90 or more minutes: 354
Means of transportation to work:
- Drove a car alone: 14,178 (78.4%)
- Carpooled: 2,485 (13.7%)
- Bus or trolley bus: 716 (4.0%)
- Streetcar or trolley car: 6 (0.0%)
- Motorcycle: 15 (0.1%)
- Bicycle: 13 (0.1%)
- Walked: 47 (0.3%)
- Other means: 75 (0.4%)
- Worked at home: 542 (3.0%)
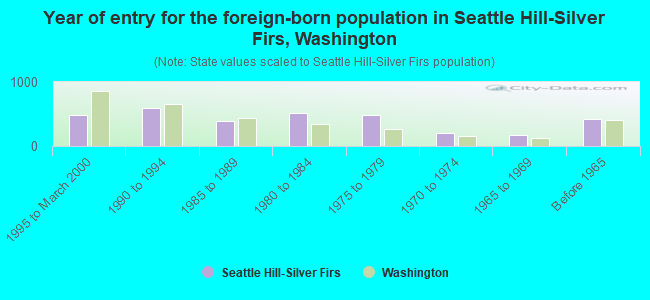
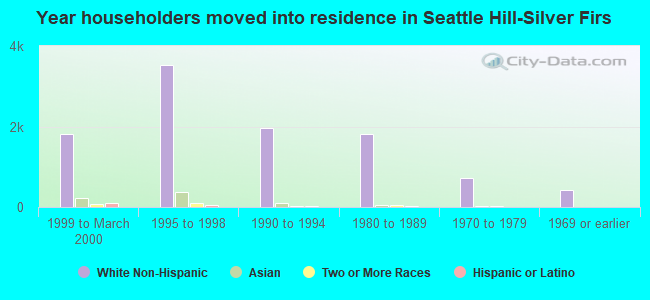
- Year of entry for the foreign-born population in Seattle Hill-Silver Firs, Washington
- 4901995 to March 2000
- 5961990 to 1994
- 3851985 to 1989
- 5141980 to 1984
- 4791975 to 1979
- 2051970 to 1974
- 1671965 to 1969
- 421Before 1965
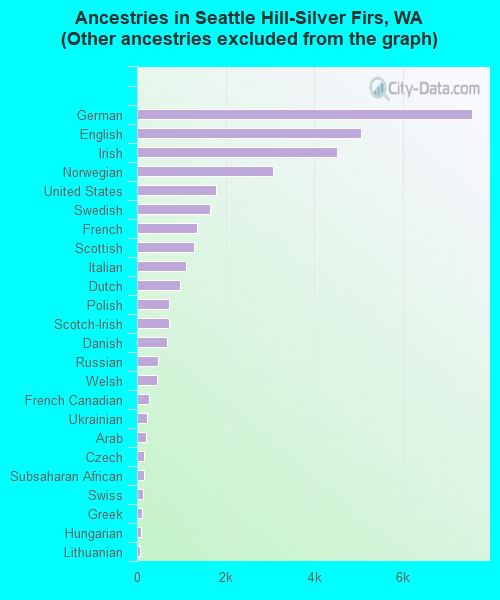
First ancestries reported:
- Other: 8,388 (20.3%)
- German: 7,564 (18.3%)
- English: 5,058 (12.2%)
- Irish: 4,519 (10.9%)
- Norwegian: 3,075 (7.4%)
- United States: 1,791 (4.3%)
- Swedish: 1,655 (4.0%)
- French: 1,363 (3.3%)
- Scottish: 1,275 (3.1%)
- Italian: 1,116 (2.7%)
- Dutch: 967 (2.3%)
- Polish: 729 (1.8%)
- Scotch-Irish: 715 (1.7%)
- Danish: 684 (1.7%)
- Russian: 482 (1.2%)
- Welsh: 461 (1.1%)
- French Canadian: 266 (0.6%)
- Ukrainian: 228 (0.6%)
- Arab: 192 (0.5%)
- Czech: 152 (0.4%)
- Subsaharan African: 149 (0.4%)
- Swiss: 136 (0.3%)
- Greek: 106 (0.3%)
- Hungarian: 99 (0.2%)
- Lithuanian: 69 (0.2%)
- Portuguese: 64 (0.2%)
- Slovak: 43 (0.1%)
- West Indian: 5 (0.01%)
Most common places of birth for foreign-born residents (%):
| Seattle Hill-Silver Firs: | 15.1% (491) |
| Washington: | 7.7% (47,568) |
| Seattle Hill-Silver Firs: | 14.2% (464) |
| Washington: | 6.2% (38,172) |
| Seattle Hill-Silver Firs: | 12.6% (411) |
| Washington: | 6.7% (40,879) |
| Seattle Hill-Silver Firs: | 8.2% (268) |
| Washington: | 7.6% (46,733) |
| Seattle Hill-Silver Firs: | 5.4% (175) |
| Washington: | 3.3% (20,530) |
| Seattle Hill-Silver Firs: | 4.9% (158) |
| Washington: | 24.1% (148,115) |
| Seattle Hill-Silver Firs: | 4.1% (134) |
| Washington: | 2.4% (14,714) |
| Seattle Hill-Silver Firs: | 3.7% (119) |
| Washington: | 2.8% (16,936) |
| Seattle Hill-Silver Firs: | 2.7% (89) |
| Washington: | 2.5% (15,491) |
| Seattle Hill-Silver Firs: | 2.7% (87) |
| Washington: | 3.3% (20,321) |
| Seattle Hill-Silver Firs: | 2.6% (84) |
| Washington: | 3.0% (18,572) |
| Seattle Hill-Silver Firs: | 2.2% (72) |
| Washington: | 0.4% (2,661) |
| Seattle Hill-Silver Firs: | 2.2% (71) |
| Washington: | 1.0% (6,393) |
| Seattle Hill-Silver Firs: | 2.0% (66) |
| Washington: | 3.4% (21,167) |
| Seattle Hill-Silver Firs: | 1.8% (59) |
| Washington: | 1.7% (10,656) |
Place of birth for U.S.-born residents:
- This state: 18,909
- Other state: 12,845
- Northeast: 1,305
- Midwest: 3,658
- South: 1,645
- West: 6,237
51% of Seattle Hill-Silver Firs residents lived in the same house 5 years ago.
Out of people who lived in different houses, 57% lived in this county.
Out of people who lived in different counties, 59% lived in Washington.
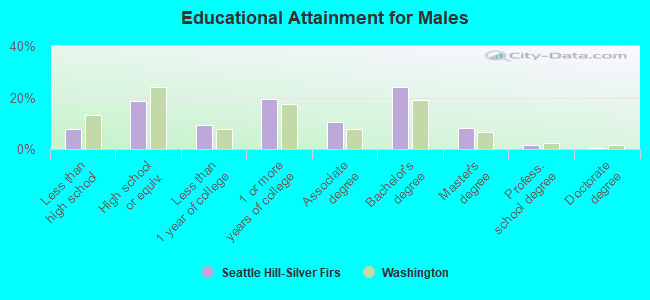
Education attainment for males 25 years and older:
- No schooling: 0
- Nursery to 4th grade: 10
- 5th and 6th grade: 10
- 7th and 8th grade: 117
- 9th grade: 115
- 10th grade: 176
- 11th grade: 124
- 12th grade, no diploma: 305
- High school graduate (or equivalency): 2,056
- Less than 1 year of college: 1,013
- Some college more than 1 year, no degree: 2,146
- Associate degree: 1,167
- Bachelor's degree: 2,634
- Master's degree: 898
- Professional school degree: 175
- Doctorate degree: 47
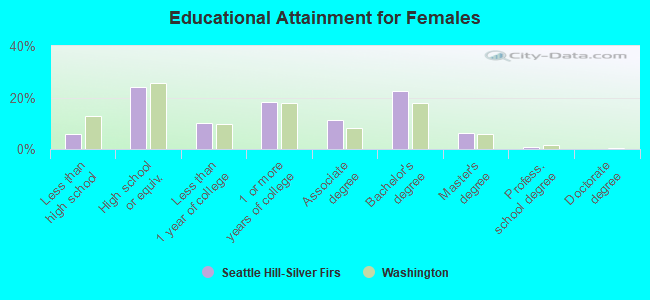
Education attainment for females 25 years and older:
- No schooling: 45
- Nursery to 4th grade: 14
- 5th and 6th grade: 9
- 7th and 8th grade: 81
- 9th grade: 67
- 10th grade: 109
- 11th grade: 134
- 12th grade, no diploma: 225
- High school graduate (or equivalency): 2,756
- Less than 1 year of college: 1,171
- Some college more than 1 year, no degree: 2,091
- Associate degree: 1,286
- Bachelor's degree: 2,568
- Master's degree: 725
- Professional school degree: 85
- Doctorate degree: 9
Housing units in structures:
- One, detached: 10,792
- One, attached: 342
- Two: 119
- 3 or 4: 50
- 5 to 9: 6
- 10 to 19: 15
- 20 to 49: 13
- 50 or more: 123
- Mobile homes: 374
- Boats, RVs, vans, etc.: 6
Median worth of mobile homes: $234,743
Housing units lacking complete kitchen facilities: 0.8%
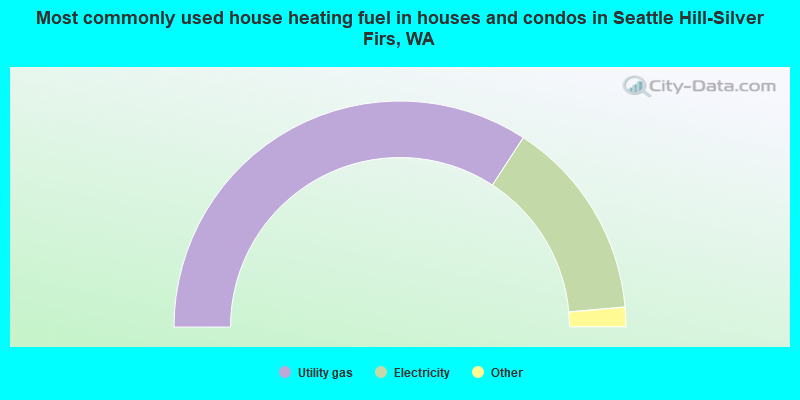
- 68.4%Utility gas
- 28.8%Electricity
- 1.6%Wood
- 0.7%Bottled, tank, or LP gas
- 0.4%Fuel oil, kerosene, etc.
- 0.2%Other fuel
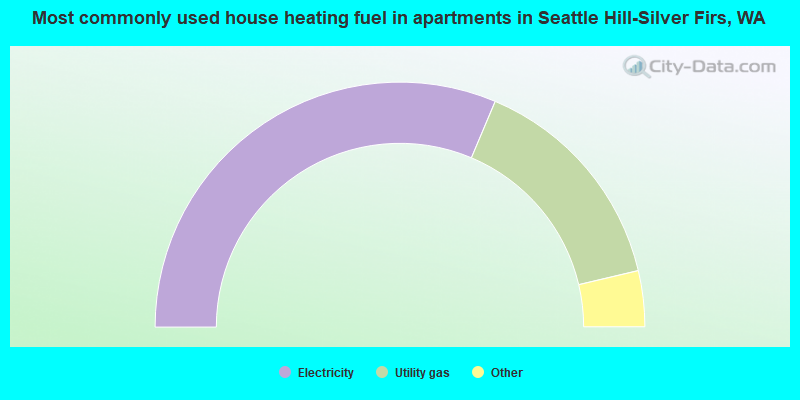
- 62.8%Electricity
- 29.9%Utility gas
- 3.7%Bottled, tank, or LP gas
- 2.7%Wood
- 0.8%Other fuel
- 0.1%Fuel oil, kerosene, etc.
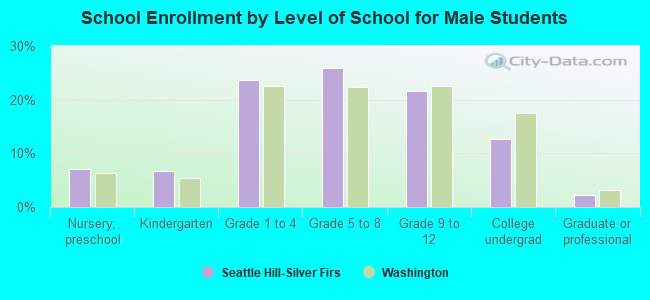
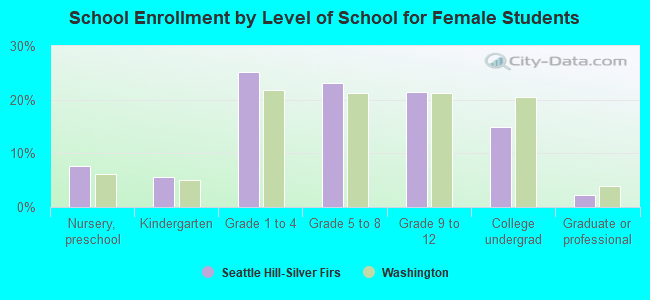
Private vs. public school enrollment:
| Here: | 9.2% |
| Washington: | 9.2% |
| Here: | 4.9% |
| Washington: | 7.0% |
| Here: | 7.4% |
| Washington: | 15.7% |