Sedalia, MO (Missouri) Houses and Residents
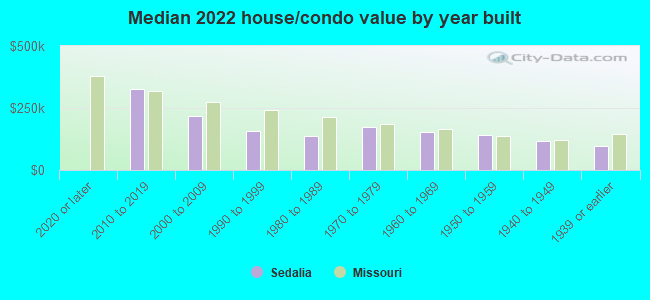
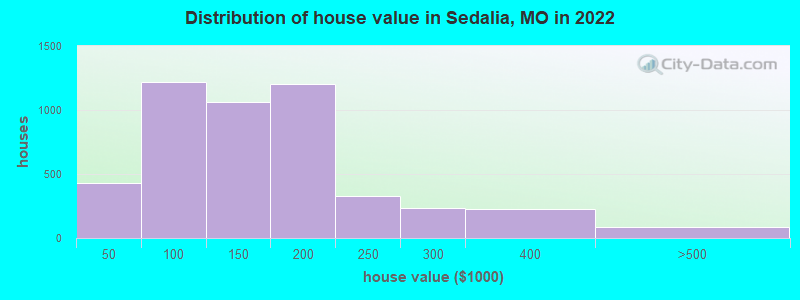
| Sedalia: | $141,107 |
| Missouri: | $221,200 |
Total population: 21,492 (Urban population: 20,400 (all inside urban clusters), Rural population: 47 (all nonfarm))
Houses: 10,078 (9,014 occupied: 5,262 owner occupied, 3,882 renter occupied)
| % of renters here: | 42% |
| State: | 32% |
Housing density: 843 houses/condos per square mile
Median price asked for vacant for-sale houses and condos in 2022: $70,983.
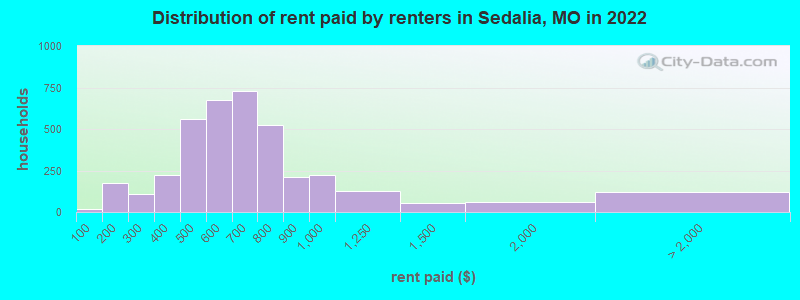
Median contract rent in 2022: $623 (lower quartile is $474, upper quartile is $790)
Median rent asked for vacant for-rent units in 2022: $944
Median gross rent in Sedalia, MO in 2022: $822
Housing units in Sedalia with a mortgage: 2,734 (136 second mortgage, 0 home equity loan, 111 both second mortgage and home equity loan)
Houses without a mortgage: 82
Median household income for houses/condos with a mortgage: $67,204
Median household income for apartments without a mortgage: $50,050
Median monthly housing costs: $743
Compare current foreclosures in Sedalia, MO:
| Photo | Address | Area | Beds / Baths | Price | Details |
|---|---|---|---|---|---|

|
#1
S Kentucky Ave
Sedalia, MO 65301
|
2,460 sq. feet
|
2 baths 4 beds |
$199,000
|
show details |

|
#2
W 5th St
Sedalia, MO 65301
|
2,146 sq. feet
|
2 baths 4 beds |
show details | |

|
#3
E 16th St
Sedalia, MO 65301
|
784 sq. feet
|
1 baths 2 beds |
show details | |

|
#4
Southgate Loop
Sedalia, MO 65301
|
1,900 sq. feet
|
1 baths 3 beds |
show details | |

|
#5
W Broadway Blvd
Sedalia, MO 65301
|
2,088 sq. feet
|
1 baths 3 beds |
show details | |

|
#6
Winchester Dr # 8c
Sedalia, MO 65301
|
1,242 sq. feet
|
2 baths 2 beds |
show details | |

|
#7
E 9th St
Sedalia, MO 65301
|
936 sq. feet
|
1 baths 2 beds |
show details | |

|
#8
Honeysuckle Rd
Sedalia, MO 65301
|
1,296 sq. feet
|
1 baths 3 beds |
show details | |

|
#9
E 25th St
Sedalia, MO 65301
|
1,414 sq. feet
|
2 baths 3 beds |
show details | |

|
#10
Anderson School Rd
Sedalia, MO 65301
|
2,101 sq. feet
|
2 baths 3 beds |
show details |
| Photo | Address | Area | Beds / Baths | Price | Details |
|---|---|---|---|---|---|

|
#11
E 14th St
Sedalia, MO 65301
|
864 sq. feet
|
1 baths 2 beds |
show details | |

|
#12
E 15th St
Sedalia, MO 65301
|
806 sq. feet
|
1 baths 2 beds |
show details | |

|
#13
N Hill Ave
Sedalia, MO 65301
|
1,056 sq. feet
|
1 baths 3 beds |
show details | |

|
#14
Ruth Ann Dr
Sedalia, MO 65301
|
2,094 sq. feet
|
1 baths 4 beds |
show details | |

|
#15
S Mildred Ave
Sedalia, MO 65301
|
1,881 sq. feet
|
1 baths 3 beds |
show details | |

|
#16
Coffey Rd
Sedalia, MO 65301
|
1,743 sq. feet
|
1 baths 3 beds |
show details | |

|
#17
S Garfield Ave
Sedalia, MO 65301
|
1,132 sq. feet
|
1 baths 3 beds |
show details | |

|
#18
West Ave
Sedalia, MO 65301
|
1,212 sq. feet
|
1 baths 3 beds |
show details | |

|
#19
E 4th St
Sedalia, MO 65301
|
- sq. feet
|
- baths - beds |
show details | |

|
#20
John J Housel Dr
Sedalia, MO 65301
|
- sq. feet
|
- baths - beds |
show details |
| Photo | Address | Area | Beds / Baths | Price | Details |
|---|---|---|---|---|---|

|
#21
S Garfield Ave
Sedalia, MO 65301
|
- sq. feet
|
- baths - beds |
show details | |

|
#22
S Kentucky Ave
Sedalia, MO 65301
|
- sq. feet
|
2 baths - beds |
show details | |

|
#23
E 6th St
Sedalia, MO 65301
|
- sq. feet
|
- baths - beds |
show details | |

|
#24
E 10th St
Sedalia, MO 65301
|
- sq. feet
|
- baths - beds |
show details | |

|
#25
S Kentucky Ave
Sedalia, MO 65301
|
- sq. feet
|
1 baths - beds |
show details | |

|
#26
W 36th St
Sedalia, MO 65301
|
- sq. feet
|
- baths - beds |
show details | |

|
#27
W 6th St
Sedalia, MO 65301
|
- sq. feet
|
- baths - beds |
show details | |

|
#28
S Lamine Ave
Sedalia, MO 65301
|
- sq. feet
|
- baths - beds |
show details | |

|
#29
Highway Hh
Sedalia, MO 65301
|
- sq. feet
|
- baths - beds |
show details | |

|
#30
W 7th St
Sedalia, MO 65301
|
- sq. feet
|
- baths - beds |
show details |
| Photo | Address | Area | Beds / Baths | Price | Details |
|---|---|---|---|---|---|

|
#31
W 6th St
Sedalia, MO 65301
|
- sq. feet
|
- baths - beds |
show details | |

|
#32
Road Runner Ct
Sedalia, MO 65301
|
- sq. feet
|
- baths - beds |
show details | |

|
#33
Heck Ave
Sedalia, MO 65301
|
- sq. feet
|
- baths - beds |
show details | |

|
#34
E 5th St Apt C
Sedalia, MO 65301
|
- sq. feet
|
- baths - beds |
show details | |

|
#35
W 11th St
Sedalia, MO 65301
|
- sq. feet
|
- baths - beds |
show details | |

|
#36
E 4th St, Apt D
Sedalia, MO 65301
|
- sq. feet
|
- baths - beds |
show details | |

|
#37
Mcanally St
Sedalia, MO 65301
|
- sq. feet
|
- baths - beds |
show details | |

|
#38
W 16th St
Sedalia, MO 65301
|
- sq. feet
|
- baths - beds |
show details | |

|
#39
E 9th St
Sedalia, MO 65301
|
- sq. feet
|
- baths - beds |
show details | |

|
#40
E 10th St
Sedalia, MO 65301
|
- sq. feet
|
- baths - beds |
show details |
| Photo | Address | Area | Beds / Baths | Price | Details |
|---|---|---|---|---|---|

|
Check over 1 million property listings on Foreclosure.com!
|
browse all offers | |||
| Photo | Address | Area | Beds / Baths | Price | Details |
|---|

Latest news about housing in Sedalia, MO collected exclusively by city-data.com from local newspapers, TV, and radio stations

 | Sedalia is boring (7 replies) |
| Apartments in Sedalia, MO with short term lease agreements (0 replies) |
| Always nice to come home to Missouri.... (57 replies) |
| Renting a house in Sedalia? (1 reply) |
| Missouri Outlaw History (3407 replies) |
| Parts of Missouri that have an upstate NY feel/vibe? (22 replies) |
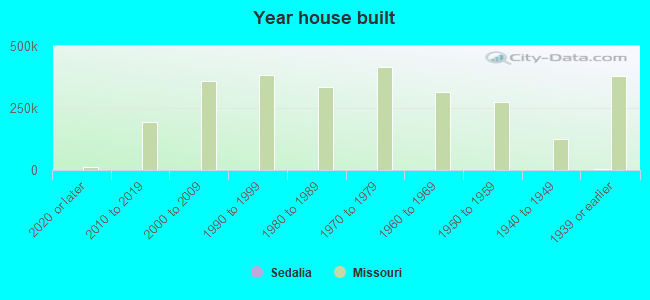
Median year apartment built: 1975
Household type by relationship:
Households: 21,850- Male householders: 4,069 (1,281 living alone), Female householders: 4,879 (1,767 living alone)
3,441 spouses (3,441 opposite-sex spouses), 805 unmarried partners, (780 opposite-sex unmarried partners), 6,269 children (5,852 natural, 81 adopted, 336 stepchildren), 610 grandchildren, 171 brothers or sisters, 218 parents, 2 foster children, 260 other relatives, 570 non-relatives
- In group quarters: 551
Size of family households: 2,479 2-persons, 1,019 3-persons, 1,165 4-persons, 428 5-persons, 209 6-persons, 73 7-or-more-persons.
Size of nonfamily households: 3,155 1-person, 533 2-persons, 41 3-persons, 26 4-persons, 5 6-persons.
2,853 married couples with children.
1,941 single-parent households (547 men, 1,394 women).
86.9% of residents of Sedalia speak English at home.
9.6% of residents speak Spanish at home (50% speak English very well, 24% speak English well, 19% speak English not well, 7% don't speak English at all).
3.0% of residents speak other Indo-European language at home (60% speak English very well, 32% speak English well, 1% speak English not well, 7% don't speak English at all).
0.3% of residents speak Asian or Pacific Island language at home (47% speak English very well, 25% speak English well, 28% speak English not well).
0.1% of residents speak other language at home (100% speak English very well).
Foreign born population: 1,757 (8.0%)
(36.3% of them are naturalized citizens)
| Here: | 6.1 |
| State: | 6.4 |
| Here: | 4.5 |
| State: | 4.4 |
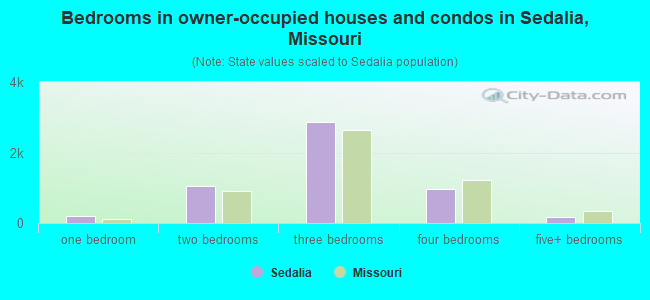
- Bedrooms in owner-occupied houses and condos in Sedalia, Missouri
- 11no bedroom
- 2001 bedroom
- 1,0502 bedrooms
- 2,8723 bedrooms
- 9554 bedrooms
- 1735+ bedrooms
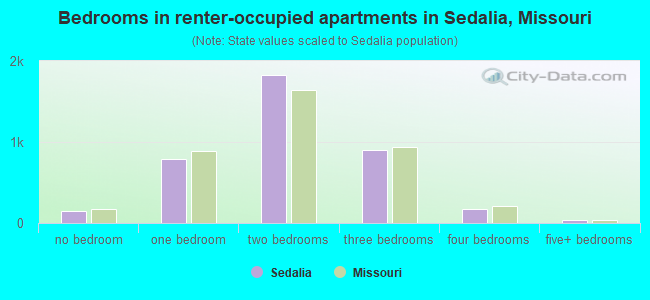
- Bedrooms in renter-occupied apartments in Sedalia, Missouri
- 150no bedroom
- 7891 bedroom
- 1,8312 bedrooms
- 9023 bedrooms
- 1684 bedrooms
- 435+ bedrooms
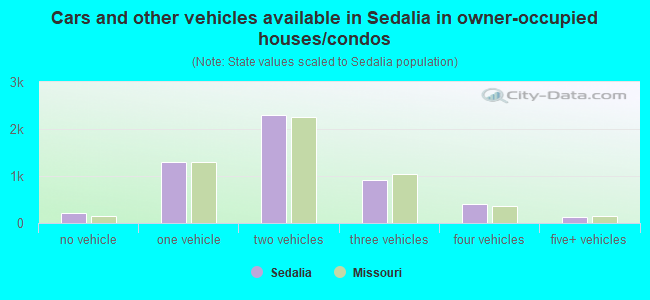
- Cars and other vehicles available in Sedalia in owner-occupied houses/condos
- 214no vehicle
- 1,2901 vehicle
- 2,3072 vehicles
- 9103 vehicles
- 4084 vehicles
- 1325+ vehicles
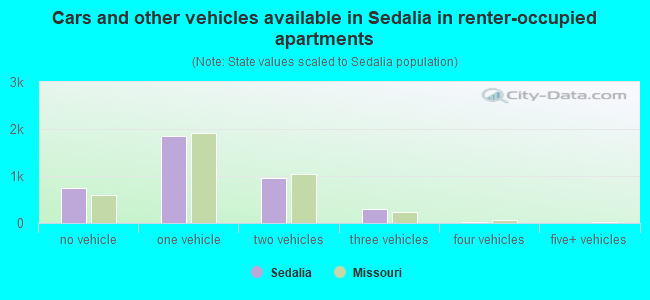
- Cars and other vehicles available in Sedalia in renter-occupied apartments
- 748no vehicle
- 1,8501 vehicle
- 9642 vehicles
- 2913 vehicles
- 224 vehicles
- 85+ vehicles
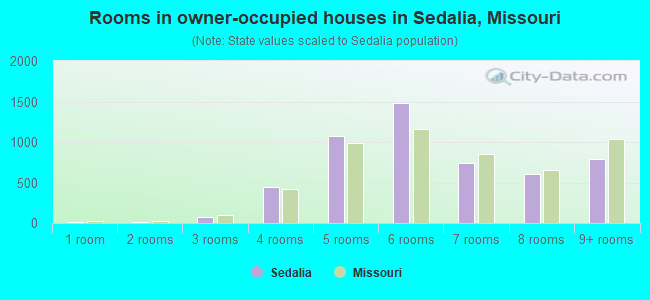
- Rooms in owner-occupied houses in Sedalia, Missouri
- 111 room
- 142 rooms
- 803 rooms
- 4454 rooms
- 1,0785 rooms
- 1,4876 rooms
- 7447 rooms
- 6088 rooms
- 7949+ rooms
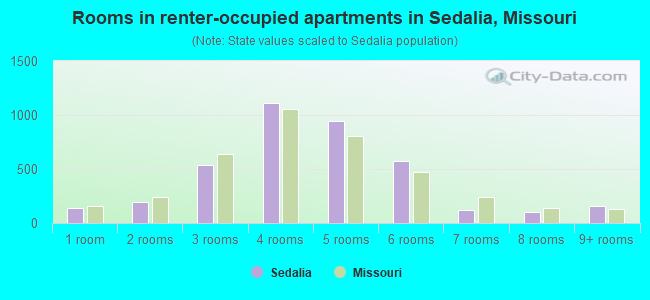
- Rooms in renter-occupied apartments in Sedalia, Missouri
- 1371 room
- 1922 rooms
- 5403 rooms
- 1,1144 rooms
- 9405 rooms
- 5786 rooms
- 1237 rooms
- 1068 rooms
- 1549+ rooms
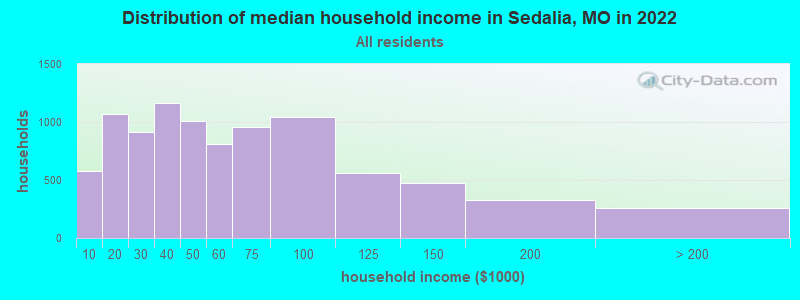
Sedalia, MO household income distribution

- 578Less than $10,000
- 1,073$10,000 to $19,999
- 913$20,000 to $29,999
- 1,165$30,000 to $39,999
- 1,005$40,000 to $49,999
- 813$50,000 to $59,999
- 953$60,000 to $74,999
- 1,047$75,000 to $99,999
- 560$100,000 to $124,999
- 478$125,000 to $149,999
- 330$150,000 to $199,999
- 258$200,000 or more
Home value of owner - occupied houses in 2022 in Sedalia, MO
-
- 80Less than $10,000
- 26$10,000 to $14,999
- 79$15,000 to $19,999
- 34$20,000 to $24,999
- 19$25,000 to $29,999
- 89$30,000 to $34,999
- 49$35,000 to $39,999
- 49$40,000 to $49,999
- 260$50,000 to $59,999
- 174$60,000 to $69,999
- 162$70,000 to $79,999
- 279$80,000 to $89,999
- 296$90,000 to $99,999
- 591$100,000 to $124,999
- 467$125,000 to $149,999
- 873$150,000 to $174,999
- 329$175,000 to $199,999
- 327$200,000 to $249,999
- 232$250,000 to $299,999
- 227$300,000 to $399,999
- 84$400,000 to $499,999
Rent paid by renters in 2022 in Sedalia, MO
-
- 18Less than $100
- 66$100 to $149
- 106$150 to $199
- 34$200 to $249
- 72$250 to $299
- 146$300 to $349
- 75$350 to $399
- 323$400 to $449
- 234$450 to $499
- 411$500 to $549
- 264$550 to $599
- 442$600 to $649
- 286$650 to $699
- 335$700 to $749
- 186$750 to $799
- 212$800 to $899
- 220$900 to $999
- 127$1,000 to $1,249
- 56$1,250 to $1,499
- 59$1,500 to $1,999
- 13$2,000 to $2,499
- 24$2,500 to $2,999
- 23$3,500 or more
- 61No cash rent
Percentage of workers working in this county: 89.4%
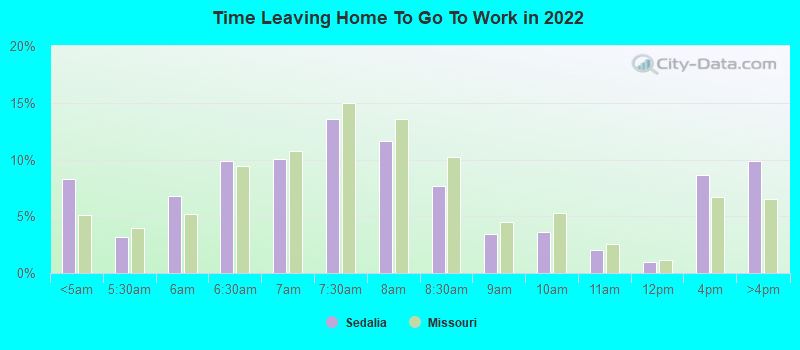
Number of people working at home: 525 (5.2% of all workers)
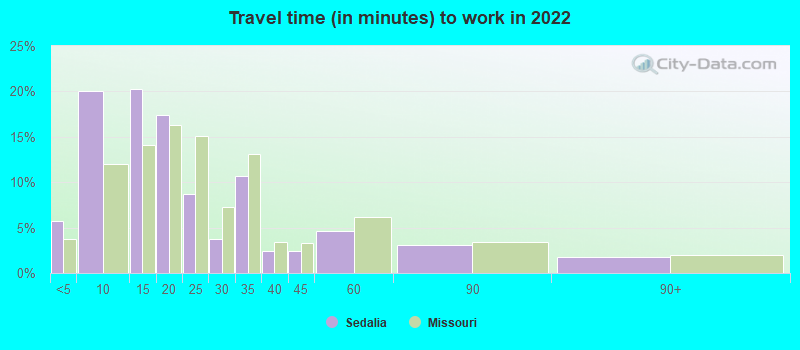
Travel time to work (commute)
- Less than 5 minutes: 706
- 5 to 9 minutes: 2,561
- 10 to 14 minutes: 2,264
- 15 to 19 minutes: 1,728
- 20 to 24 minutes: 576
- 25 to 29 minutes: 196
- 30 to 34 minutes: 702
- 35 to 39 minutes: 120
- 40 to 44 minutes: 138
- 45 to 59 minutes: 150
- 60 to 89 minutes: 106
- 90 or more minutes: 203
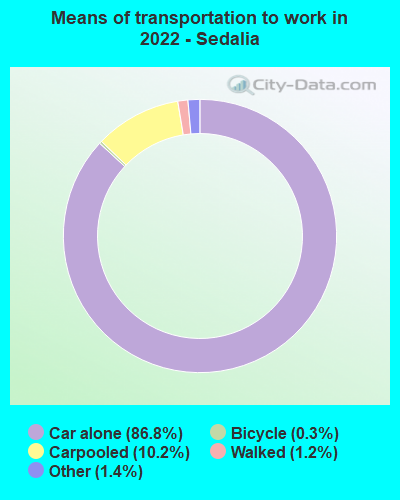
Means of transportation to work:
- Drove a car alone: 12,866 (81.8%)
- Carpooled: 1,537 (9.8%)
- Bus: 7 (0.0%)
- Taxi: 217 (1.4%)
- Bicycle: 41 (0.3%)
- Walked: 172 (1.1%)
- Worked at home: 525 (3.3%)
- Unemployment by race in 2022
- Unemployment rate for White non-Hispanic residents
- 3.3%Males
- 4.8%Females
- Unemployment rate for Black residents
- 2.9%Males
- 24.3%Females
- Unemployment rate for other race residents
- 9.5%Males
- 10.5%Females
- Unemployment rate for two or more race residents
- 12.8%Males
- 1.4%Females
- Unemployment rate for Hispanic or Latino residents
- 7.3%Males
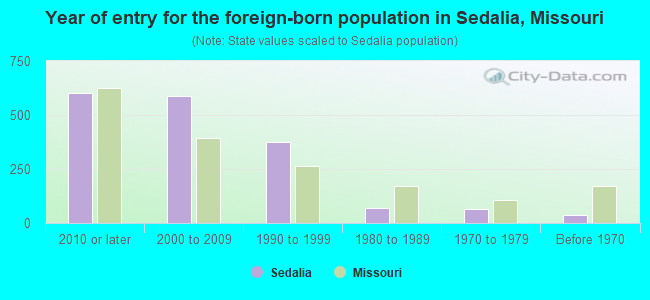
- Year of entry for the foreign-born population in Sedalia, Missouri
- 6042010 or later
- 5862000 to 2009
- 3761990 to 1999
- 681980 to 1989
- 641970 to 1979
- 39Before 1970
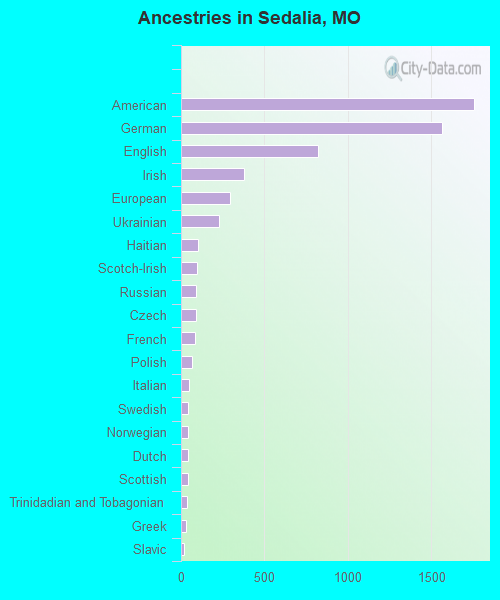
First ancestries reported:
- American: 1,760 (17.9%)
- German: 1,568 (16.0%)
- English: 823 (8.4%)
- Irish: 379 (3.9%)
- European: 293 (3.0%)
- Ukrainian: 227 (2.3%)
- Haitian: 102 (1.0%)
- Scotch-Irish: 95 (1.0%)
- Russian: 93 (0.9%)
- Czech: 89 (0.9%)
- French: 83 (0.8%)
- Polish: 68 (0.7%)
- Italian: 49 (0.5%)
- Swedish: 45 (0.5%)
- Norwegian: 42 (0.4%)
- Dutch: 41 (0.4%)
- Scottish: 41 (0.4%)
- Trinidadian and Tobagonian: 37 (0.4%)
- Greek: 29 (0.3%)
- Slavic: 19 (0.2%)
- Canadian: 14 (0.1%)
- Yugoslavian: 13 (0.1%)
- Welsh: 12 (0.1%)
- Ethiopian: 9 (0.09%)
- Northern European: 8 (0.08%)
- Scandinavian: 8 (0.08%)
- Somali: 8 (0.08%)
- Nigerian: 6 (0.06%)
- Brazilian: 5 (0.05%)
Most common places of birth for foreign-born residents (%):
| Sedalia: | 50.4% (886) |
| Missouri: | 14.9% (38,568) |
| Sedalia: | 11.7% (205) |
| Missouri: | 1.1% (2,895) |
| Sedalia: | 8.5% (150) |
| Missouri: | 0.2% (447) |
| Sedalia: | 7.5% (131) |
| Missouri: | 4.2% (10,873) |
| Sedalia: | 5.4% (95) |
| Missouri: | 0.4% (1,107) |
| Sedalia: | 4.7% (83) |
| Missouri: | 2.1% (5,346) |
| Sedalia: | 2.0% (36) |
| Missouri: | 1.5% (3,767) |
| Sedalia: | 1.9% (34) |
| Missouri: | 0.3% (689) |
| Sedalia: | 1.7% (29) |
| Missouri: | 2.8% (7,146) |
Place of birth for U.S.-born residents:
- This state: 15,127
- Other state: 4,676
- Northeast: 196
- Midwest: 1,878
- South: 1,359
- West: 1,258
87.9% of Sedalia residents lived in the same house 1 years ago.
Out of people who lived in different houses, 35.7% lived in this county.
Out of people who lived in different counties, 71.9% lived in Missouri.
| Sedalia: | 87.9% |
| State average: | 87.1% |
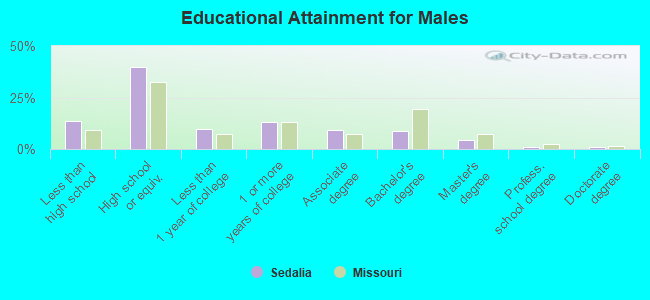
Education attainment for males 25 years and older:
- No schooling: 134
- Nursery to 4th grade: 26
- 5th and 6th grade: 15
- 7th and 8th grade: 146
- 9th grade: 72
- 10th grade: 180
- 11th grade: 59
- 12th grade, no diploma: 286
- High school graduate (or equivalency): 2,651
- Less than 1 year of college: 633
- Some college more than 1 year, no degree: 864
- Associate degree: 613
- Bachelor's degree: 593
- Master's degree: 286
- Professional school degree: 67
- Doctorate degree: 60
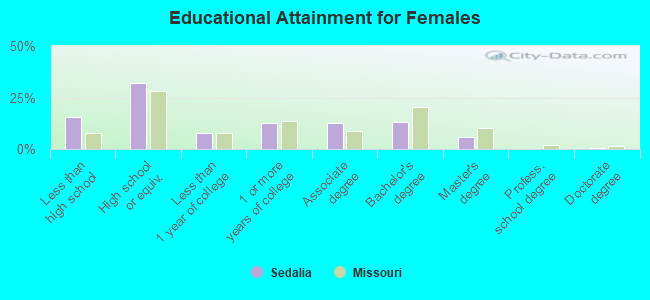
Education attainment for females 25 years and older:
- No schooling: 153
- Nursery to 4th grade: 39
- 5th and 6th grade: 69
- 7th and 8th grade: 165
- 9th grade: 144
- 10th grade: 162
- 11th grade: 188
- 12th grade, no diploma: 234
- High school graduate (or equivalency): 2,384
- Less than 1 year of college: 584
- Some college more than 1 year, no degree: 947
- Associate degree: 929
- Bachelor's degree: 996
- Master's degree: 447
- Professional school degree: 6
- Doctorate degree: 40
Housing units in structures:
- One, detached: 7,523
- One, attached: 232
- Two: 327
- 3 or 4: 461
- 5 to 9: 372
- 10 to 19: 522
- 20 to 49: 406
- 50 or more: 124
- Mobile homes: 108
Median worth of mobile homes: $35,467
Housing units lacking complete kitchen facilities in 2022: 3.4%
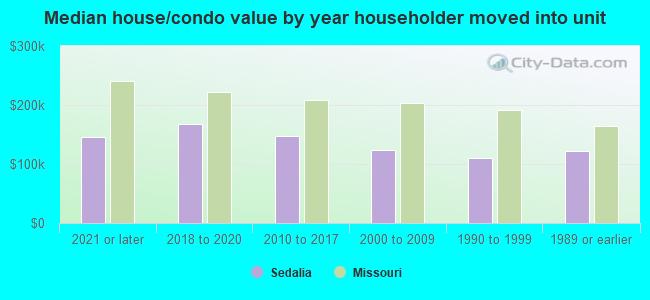
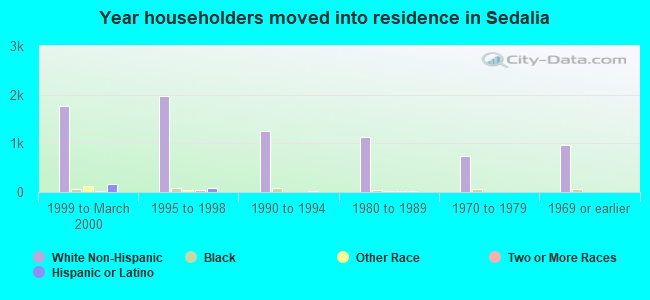
House/condo owner moved in on average 9 years ago
Renter moved in on average 2 years ago
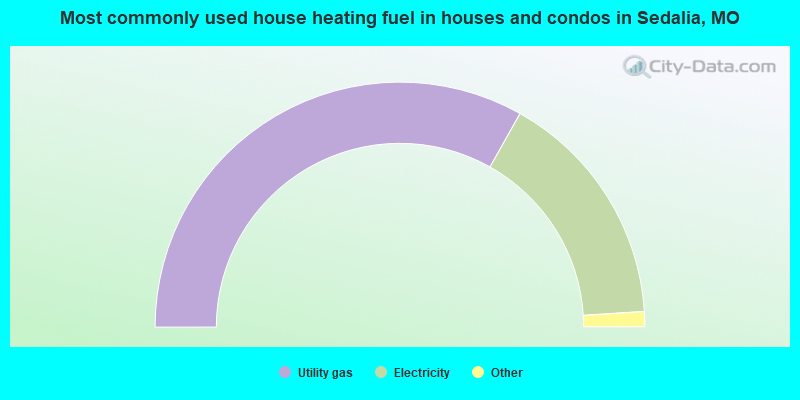
- 66.4%Utility gas
- 31.7%Electricity
- 1.1%Bottled, tank, or LP gas
- 0.9%Wood
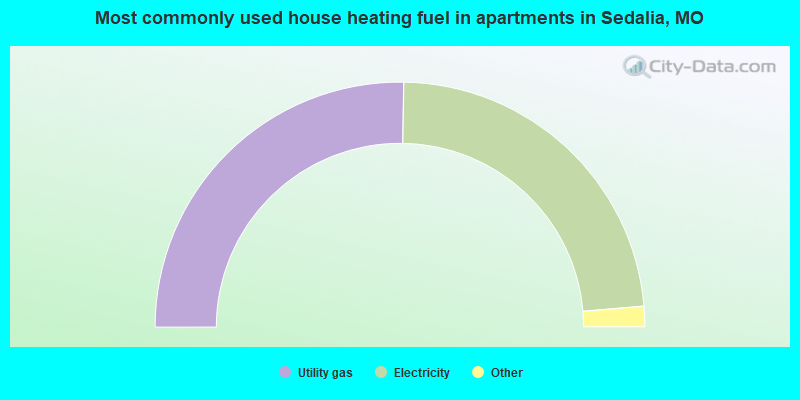
- 50.5%Utility gas
- 46.8%Electricity
- 1.6%No fuel used
- 1.0%Wood
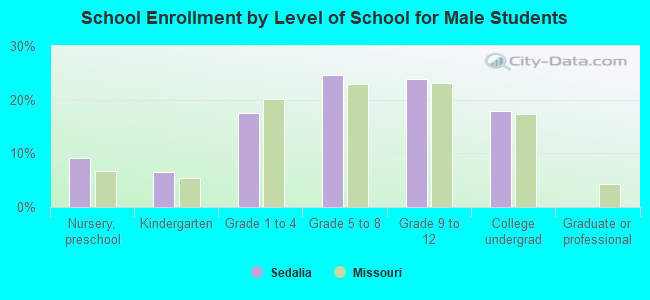
Private vs. public school enrollment:
| Here: | 17.6% |
| Missouri: | 15.4% |
| Here: | 15.0% |
| Missouri: | 13.9% |
| Here: | 11.4% |
| Missouri: | 22.6% |