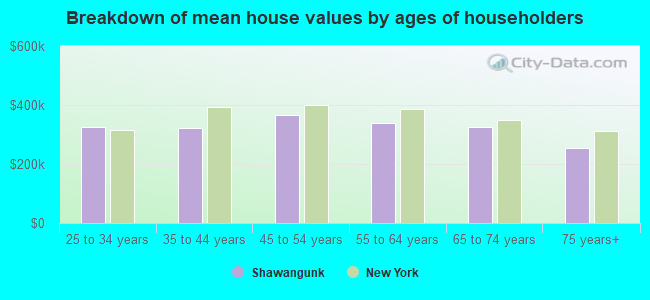
Median price asked for vacant for-sale houses and condos in 2022 in this county: $213,181.
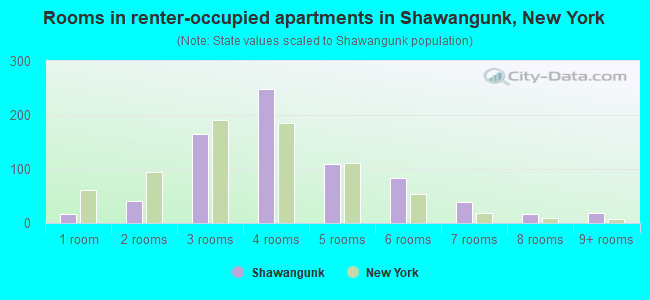
Median contract rent in 2022: $1,353 (lower quartile is $1,040, upper quartile is $1,854)
Median rent asked for vacant for-rent units in 2022: $1,324
Median gross rent in Shawangunk, NY in 2022: $1,689
Housing units in Shawangunk with a mortgage: 1,602 (114 second mortgage, 255 home equity loan, 0 both second mortgage and home equity loan) Houses without a mortgage: 473
In family households: 136,249 (29,006 male householders, 15,373 female householders)
32,679 spouses, 46,411 children (43,288 natural, 1,072 adopted, 2,051 stepchildren), 2,688 grandchildren, 1,308 brothers or sisters, 1,585 parents, foster children, 1,522 other relatives, 4,657 non-relatives
In nonfamily households: 34,471 (12,699 male householders (9,405 living alone)), 13,971 female householders (11,227 living alone)), 7,801 nonrelatives
In group quarters: 11,773 (4,349 institutionalized population)
27,635 married couples with children.
9,974 single-parent households (2,588 men, 7,386 women).
91.7% of residents of Shawangunk speak English at home.
3.8% of residents speak Spanish at home (75% speak English very well, 12% speak English well, 13% speak English not well).
3.7% of residents speak other Indo-European language at home (66% speak English very well, 29% speak English well, 5% speak English not well).
0.6% of residents speak Asian or Pacific Island language at home (59% speak English very well, 10% speak English well, 31% speak English not well).
0.2% of residents speak other language at home (56% speak English very well, 44% speak English well).
Foreign born population: 832 (6.7%)
(49.6% of them are naturalized citizens)
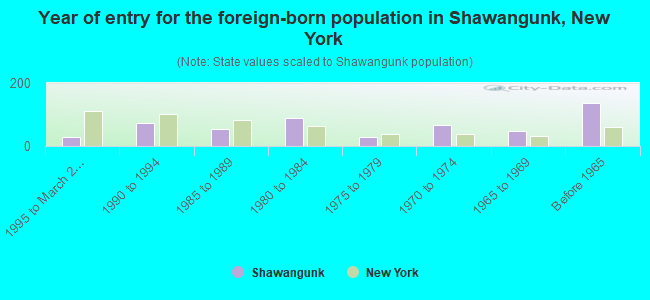
Year of entry for the foreign-born population in Shawangunk, New York
301995 to March 2000
741990 to 1994
531985 to 1989
901980 to 1984
301975 to 1979
661970 to 1974
491965 to 1969
136Before 1965
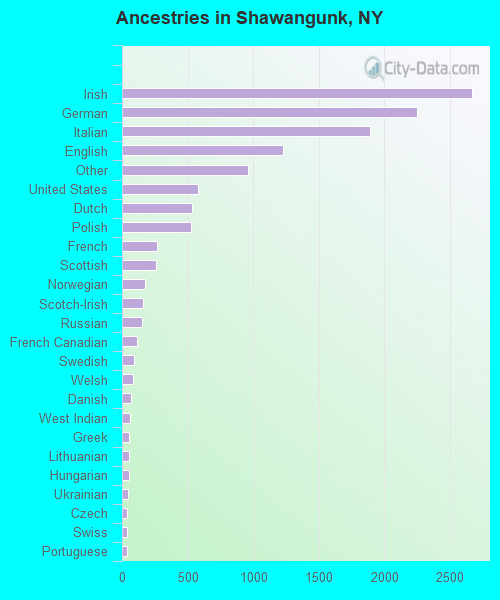
First ancestries reported:
Irish: 2,665 (21.4%)
German: 2,249 (18.1%)
Italian: 1,892 (15.2%)
English: 1,225 (9.8%)
Other: 963 (7.7%)
United States: 578 (4.6%)
Dutch: 534 (4.3%)
Polish: 526 (4.2%)
French: 269 (2.2%)
Scottish: 258 (2.1%)
Norwegian: 178 (1.4%)
Scotch-Irish: 159 (1.3%)
Russian: 152 (1.2%)
French Canadian: 117 (0.9%)
Swedish: 91 (0.7%)
Welsh: 83 (0.7%)
Danish: 66 (0.5%)
West Indian: 59 (0.5%)
Greek: 54 (0.4%)
Lithuanian: 54 (0.4%)
Hungarian: 51 (0.4%)
Ukrainian: 42 (0.3%)
Czech: 41 (0.3%)
Swiss: 40 (0.3%)
Portuguese: 37 (0.3%)
Arab: 29 (0.2%)
Slovak: 29 (0.2%)
Most common places of birth for foreign-born residents (%):
Jamaica
Shawangunk:
15.9% (84)
New York:
5.9% (226,470)
China, excluding Hong Kong and Taiwan
Shawangunk:
9.8% (52)
New York:
6.0% (233,766)
Dominican Republic
Shawangunk:
9.3% (49)
New York:
10.5% (408,086)
Germany
Shawangunk:
8.9% (47)
New York:
1.8% (69,327)
Yugoslavia
Shawangunk:
8.9% (47)
New York:
0.7% (25,688)
Canada
Shawangunk:
6.6% (35)
New York:
1.4% (54,876)
Italy
Shawangunk:
4.7% (25)
New York:
3.8% (147,729)
Mexico
Shawangunk:
4.0% (21)
New York:
4.2% (161,189)
Ireland
Shawangunk:
3.4% (18)
New York:
1.1% (41,934)
Other Eastern Europe
Shawangunk:
2.5% (13)
New York:
1.4% (53,825)
Guatemala
Shawangunk:
2.5% (13)
New York:
0.9% (33,208)
Romania
Shawangunk:
2.3% (12)
New York:
0.6% (25,059)
Iran
Shawangunk:
2.3% (12)
New York:
0.4% (17,323)
Panama
Shawangunk:
2.1% (11)
New York:
0.7% (26,202)
Cuba
Shawangunk:
1.9% (10)
New York:
0.9% (36,642)
United Kingdom
Shawangunk:
1.5% (8)
New York:
1.6% (62,237)
Australia
Shawangunk:
1.5% (8)
New York:
0.2% (5,813)
Place of birth for U.S.-born residents:
This state: 9,097
Other state: 2,189
Northeast: 1,552
Midwest: 217
South: 325
West: 95
56% of Shawangunk residents lived in the same house 5 years ago. Out of people who lived in different houses, 30% lived in this county. Out of people who lived in different counties, 70% lived in New York.
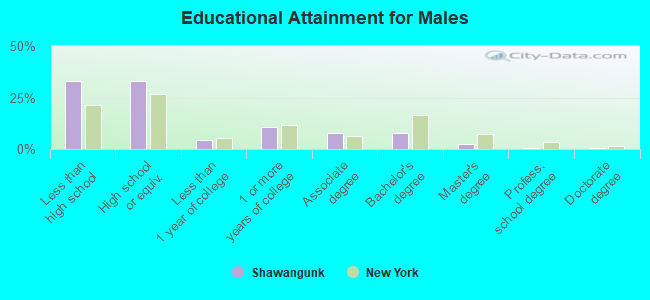
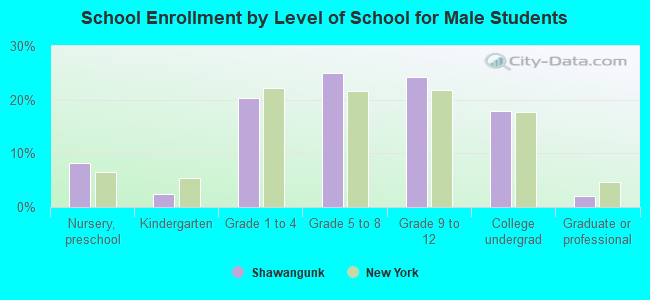
Education attainment for males 25 years and older:
No schooling: 128
Nursery to 4th grade: 22
5th and 6th grade: 40
7th and 8th grade: 278
9th grade: 233
10th grade: 296
11th grade: 322
12th grade, no diploma: 269
High school graduate (or equivalency): 1,577
Less than 1 year of college: 219
Some college more than 1 year, no degree: 508
Associate degree: 364
Bachelor's degree: 377
Master's degree: 113
Professional school degree: 33
Doctorate degree: 21
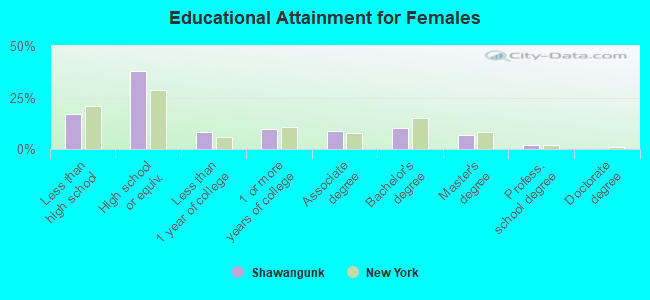
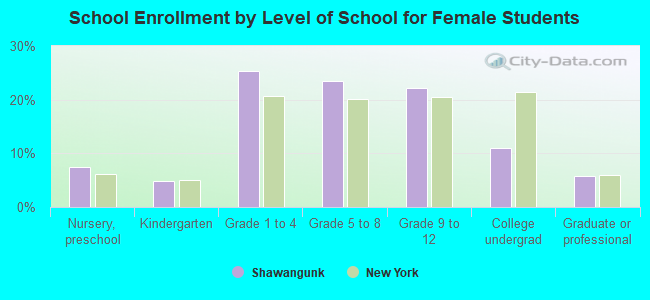
Education attainment for females 25 years and older:
No schooling: 39
Nursery to 4th grade: 0
5th and 6th grade: 0
7th and 8th grade: 85
9th grade: 6
10th grade: 90
11th grade: 139
12th grade, no diploma: 246
High school graduate (or equivalency): 1,348
Less than 1 year of college: 297
Some college more than 1 year, no degree: 340
Associate degree: 306
Bachelor's degree: 362
Master's degree: 249
Professional school degree: 63
Doctorate degree: 0
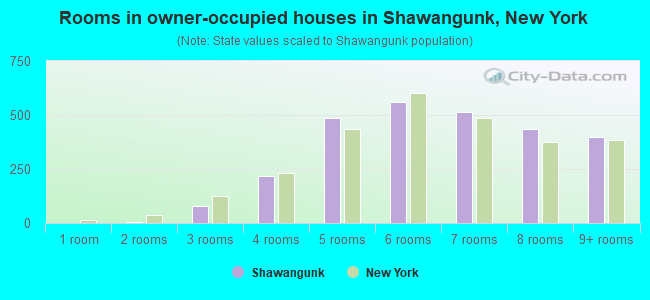
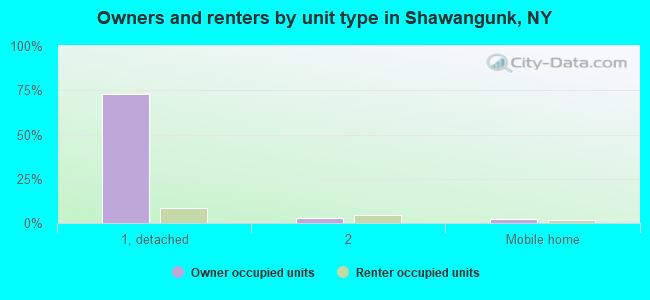
Housing units in structures:
One, detached: 3,052
One, attached: 42
Two: 248
3 or 4: 165
5 to 9: 72
Mobile homes: 164
Boats, RVs, vans, etc.: 8
Median worth of mobile homes: $129,795
Housing units lacking complete plumbing facilities: 1.0%
Housing units lacking complete kitchen facilities: 1.3%