Shelbyville, IN (Indiana) Houses and Residents
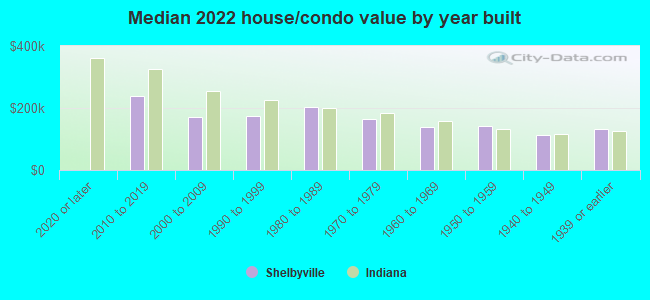
| Shelbyville: | $153,570 |
| Indiana: | $208,700 |
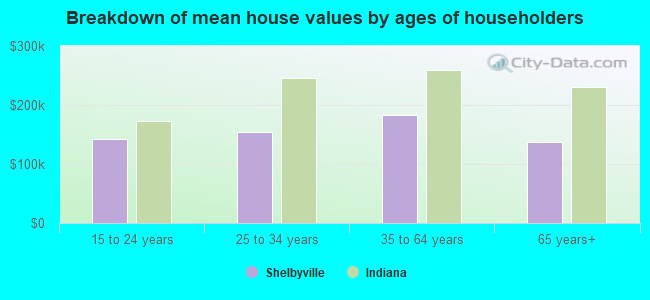
Mean price in 2022:
Detached houses: $195,117
Here: $195,117 State: $257,916 Townhouses or other attached units: $187,463
Here: $187,463 State: $224,114 In 2-unit structures: $143,476
Here: $143,476 State: $175,375 Mobile homes: $17,055
Here: $17,055 State: $67,116
Total population: 19,163 (Urban population: 17,383 (all inside urban clusters), Rural population: 311 (all nonfarm))
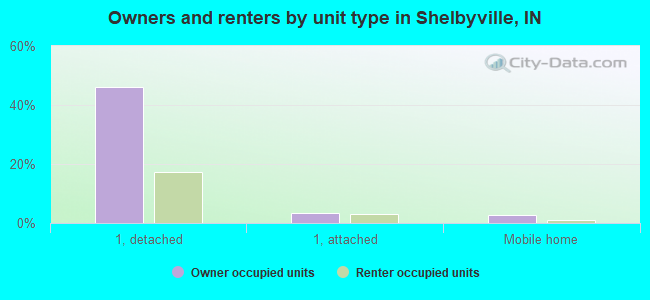
Houses: 9,290 (8,386 occupied: 4,758 owner occupied, 3,726 renter occupied)
| % of renters here: | 44% |
| State: | 29% |
Housing density: 1,047 houses/condos per square mile
Median price asked for vacant for-sale houses and condos in 2022: $871,123.
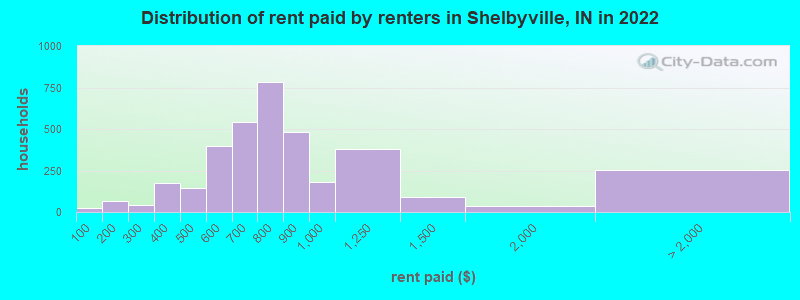
Median contract rent in 2022: $744 (lower quartile is $601, upper quartile is $907)
Median rent asked for vacant for-rent units in 2022: $1,039
Median gross rent in Shelbyville, IN in 2022: $915
Housing units in Shelbyville with a mortgage: 3,065 (373 second mortgage, 0 home equity loan, 321 both second mortgage and home equity loan)
Houses without a mortgage: 127
Median household income for houses/condos with a mortgage: $79,387
Median household income for apartments without a mortgage: $47,599
Median monthly housing costs: $891
Compare current foreclosures in Shelbyville, IN:
| Photo | Address | Area | Beds / Baths | Price | Details |
|---|---|---|---|---|---|

|
#1
Western Ct
Shelbyville, IN 46176
|
1,626 sq. feet
|
2 baths 3 beds |
show details | |

|
#2
Hillcrest Dr
Shelbyville, IN 46176
|
2,341 sq. feet
|
2 baths 5 beds |
show details | |

|
#3
W Boggstown Rd
Shelbyville, IN 46176
|
1,755 sq. feet
|
2 baths 3 beds |
show details | |

|
#4
S Tompkins St
Shelbyville, IN 46176
|
1,056 sq. feet
|
1 baths 3 beds |
show details | |

|
#5
E 100 N
Shelbyville, IN 46176
|
876 sq. feet
|
1 baths 2 beds |
show details | |

|
#6
W Mechanic St
Shelbyville, IN 46176
|
1,188 sq. feet
|
1 baths 3 beds |
show details | |

|
#7
Morris Ave
Shelbyville, IN 46176
|
2,536 sq. feet
|
2 baths 4 beds |
show details | |

|
#8
Westpointe Dr
Shelbyville, IN 46176
|
1,661 sq. feet
|
2 baths 3 beds |
show details | |

|
#9
Berwick Dr
Shelbyville, IN 46176
|
1,429 sq. feet
|
2 baths 3 beds |
show details | |

|
#10
Shelby St
Shelbyville, IN 46176
|
1,838 sq. feet
|
1 baths 3 beds |
show details |
| Photo | Address | Area | Beds / Baths | Price | Details |
|---|---|---|---|---|---|

|
#11
Blanchard St
Shelbyville, IN 46176
|
1,664 sq. feet
|
1 baths 2 beds |
show details | |

|
#12
N 500 E
Shelbyville, IN 46176
|
2,935 sq. feet
|
1 baths 3 beds |
show details | |

|
#13
W Washington St
Shelbyville, IN 46176
|
1,836 sq. feet
|
1 baths 3 beds |
show details | |

|
#14
W Jackson St
Shelbyville, IN 46176
|
1,320 sq. feet
|
2 baths 2 beds |
show details | |

|
#15
Springway Dr
Shelbyville, IN 46176
|
1,919 sq. feet
|
2 baths 3 beds |
show details | |

|
#16
Foxborough Run
Shelbyville, IN 46176
|
3,710 sq. feet
|
2 baths 3 beds |
show details | |

|
#17
Valdosta Ct
Shelbyville, IN 46176
|
2,908 sq. feet
|
2 baths 3 beds |
show details | |

|
#18
W 250 S
Shelbyville, IN 46176
|
1,123 sq. feet
|
2 baths 3 beds |
show details | |

|
#19
Edgehill Rd
Shelbyville, IN 46176
|
1,080 sq. feet
|
1 baths 3 beds |
show details | |

|
#20
S Columbus Rd
Shelbyville, IN 46176
|
2,100 sq. feet
|
1 baths 3 beds |
show details |
| Photo | Address | Area | Beds / Baths | Price | Details |
|---|---|---|---|---|---|

|
#21
W Franklin St Apt 1
Shelbyville, IN 46176
|
- sq. feet
|
- baths - beds |
show details | |

|
#22
Berkeley Dr
Shelbyville, IN 46176
|
- sq. feet
|
- baths - beds |
show details | |

|
#23
S Pike St
Shelbyville, IN 46176
|
- sq. feet
|
- baths - beds |
show details | |

|
#24
Howard St
Shelbyville, IN 46176
|
- sq. feet
|
- baths - beds |
show details | |

|
#25
Meridian St
Shelbyville, IN 46176
|
- sq. feet
|
- baths - beds |
show details | |

|
#26
E Washington St Apt 2
Shelbyville, IN 46176
|
- sq. feet
|
- baths - beds |
show details | |

|
#27
Flatrock Dr Apt E
Shelbyville, IN 46176
|
- sq. feet
|
- baths - beds |
show details | |

|
#28
Chestnut St, Trlr 63
Shelbyville, IN 46176
|
- sq. feet
|
- baths - beds |
show details | |

|
#29
E Pennsylvania St
Shelbyville, IN 46176
|
- sq. feet
|
- baths - beds |
show details | |

|
#30
E Locust St
Shelbyville, IN 46176
|
- sq. feet
|
- baths - beds |
show details |
| Photo | Address | Area | Beds / Baths | Price | Details |
|---|---|---|---|---|---|

|
#31
N Morristown Rd # 7
Shelbyville, IN 46176
|
- sq. feet
|
- baths - beds |
show details | |

|
#32
Delacorte North Dr
Shelbyville, IN 46176
|
- sq. feet
|
- baths - beds |
show details | |

|
#33
N Michigan Rd
Shelbyville, IN 46176
|
- sq. feet
|
- baths - beds |
show details | |

|
#34
Murdock St
Shelbyville, IN 46176
|
- sq. feet
|
- baths - beds |
show details | |

|
#35
Eastpointe Dr
Shelbyville, IN 46176
|
- sq. feet
|
- baths - beds |
show details | |

|
#36
2nd St Apt 202
Shelbyville, IN 46176
|
- sq. feet
|
- baths - beds |
show details | |

|
#37
S 25 E
Shelbyville, IN 46176
|
- sq. feet
|
- baths - beds |
show details | |

|
#38
Allen Ct
Shelbyville, IN 46176
|
- sq. feet
|
- baths - beds |
show details | |

|
#39
E Franklin St
Shelbyville, IN 46176
|
- sq. feet
|
- baths - beds |
show details | |

|
#40
Hale Rd Lot 24
Shelbyville, IN 46176
|
- sq. feet
|
- baths - beds |
show details |
| Photo | Address | Area | Beds / Baths | Price | Details |
|---|---|---|---|---|---|

|
#41
N Knightstown Rd Apt 32
Shelbyville, IN 46176
|
- sq. feet
|
- baths - beds |
show details | |

|
#42
Roanoke Ln
Shelbyville, IN 46176
|
- sq. feet
|
- baths - beds |
show details | |

|
#43
Washington Ave
Shelbyville, IN 46176
|
- sq. feet
|
- baths - beds |
show details | |

|
Check over 1 million property listings on Foreclosure.com!
|
browse all offers | |||

Latest news about housing in Shelbyville, IN collected exclusively by city-data.com from local newspapers, TV, and radio stations

 | Where would I look for housing rentals in Shelbyville, Indiana (4 replies) |
| Columbus, IN rental homes? (3 replies) |
| Shelbyville, Rushville ? (3 replies) |
| Is my impression of Indianapolis accurate? (167 replies) |
| Someone please talk to me about Muncie. (22 replies) |
| Thoughts on Wabash, Indiana? (17 replies) |

Median year apartment built: 1980
Household type by relationship:
Households: 19,819- Male householders: 4,166 (1,371 living alone), Female householders: 4,150 (1,494 living alone)
3,739 spouses (3,699 opposite-sex spouses), 664 unmarried partners, (569 opposite-sex unmarried partners), 5,329 children (4,589 natural, 92 adopted, 647 stepchildren), 315 grandchildren, 184 brothers or sisters, 154 parents, 0 foster children, 26 other relatives, 528 non-relatives
- In group quarters: 558
Size of family households: 2,293 2-persons, 962 3-persons, 976 4-persons, 429 5-persons, 97 6-persons, 180 7-or-more-persons.
Size of nonfamily households: 2,938 1-person, 584 2-persons, 20 3-persons.
3,228 married couples with children.
1,188 single-parent households (264 men, 924 women).
89.6% of residents of Shelbyville speak English at home.
7.1% of residents speak Spanish at home (52% speak English very well, 28% speak English well, 19% speak English not well, 1% don't speak English at all).
0.9% of residents speak other Indo-European language at home (93% speak English very well, 6% speak English well, 1% don't speak English at all).
1.3% of residents speak Asian or Pacific Island language at home (24% speak English very well, 30% speak English well, 46% speak English not well).
0.7% of residents speak other language at home (100% speak English well).
Foreign born population: 1,415 (7.1%)
(23.7% of them are naturalized citizens)
| Here: | 6.2 |
| State: | 6.6 |
| Here: | 4.3 |
| State: | 4.3 |
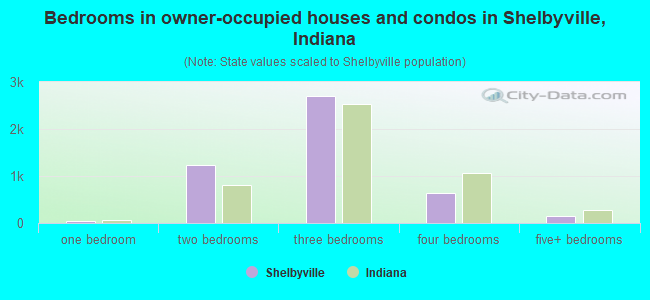
- Bedrooms in owner-occupied houses and condos in Shelbyville, Indiana
- 0no bedroom
- 441 bedroom
- 1,2252 bedrooms
- 2,7013 bedrooms
- 6424 bedrooms
- 1465+ bedrooms
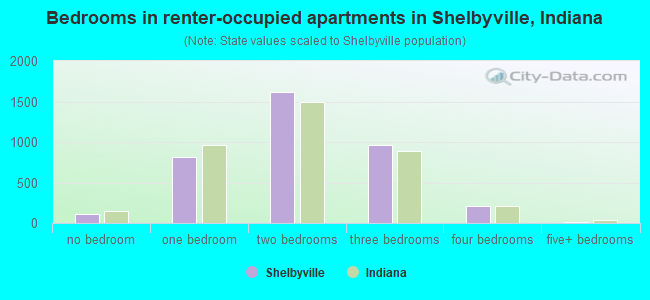
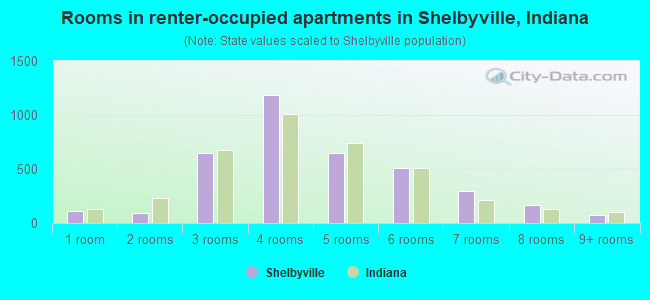
- Bedrooms in renter-occupied apartments in Shelbyville, Indiana
- 110no bedroom
- 8121 bedroom
- 1,6122 bedrooms
- 9683 bedrooms
- 2084 bedrooms
- 175+ bedrooms
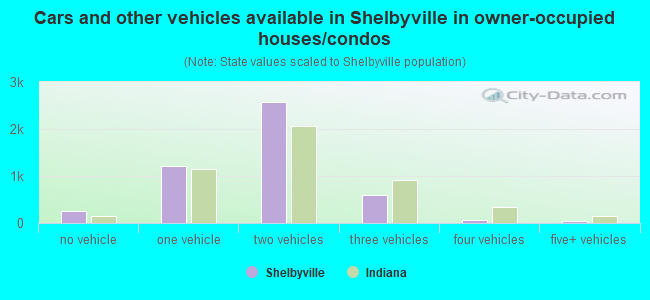
- Cars and other vehicles available in Shelbyville in owner-occupied houses/condos
- 262no vehicle
- 1,2151 vehicle
- 2,5772 vehicles
- 6063 vehicles
- 644 vehicles
- 345+ vehicles
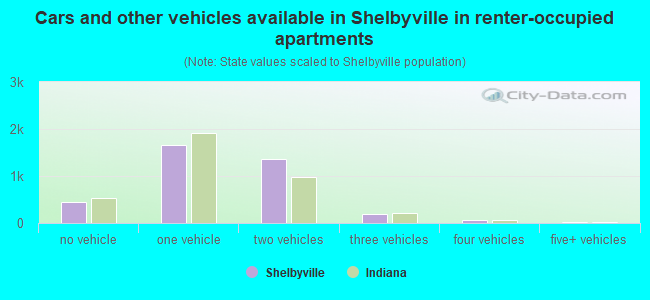
- Cars and other vehicles available in Shelbyville in renter-occupied apartments
- 445no vehicle
- 1,6571 vehicle
- 1,3582 vehicles
- 1843 vehicles
- 654 vehicles
- 175+ vehicles
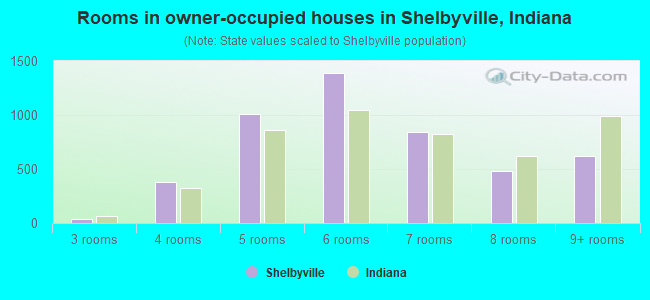
- Rooms in owner-occupied houses in Shelbyville, Indiana
- 01 room
- 02 rooms
- 363 rooms
- 3794 rooms
- 1,0115 rooms
- 1,3906 rooms
- 8387 rooms
- 4798 rooms
- 6259+ rooms
- Rooms in renter-occupied apartments in Shelbyville, Indiana
- 1101 room
- 932 rooms
- 6473 rooms
- 1,1884 rooms
- 6465 rooms
- 5096 rooms
- 2977 rooms
- 1658 rooms
- 719+ rooms
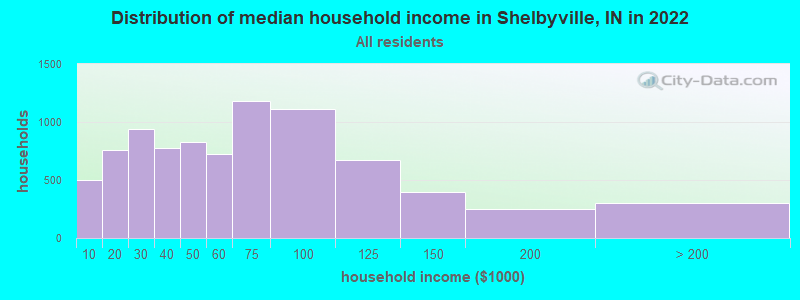
Shelbyville, IN household income distribution

- 504Less than $10,000
- 761$10,000 to $19,999
- 938$20,000 to $29,999
- 776$30,000 to $39,999
- 825$40,000 to $49,999
- 728$50,000 to $59,999
- 1,183$60,000 to $74,999
- 1,112$75,000 to $99,999
- 676$100,000 to $124,999
- 400$125,000 to $149,999
- 249$150,000 to $199,999
- 306$200,000 or more
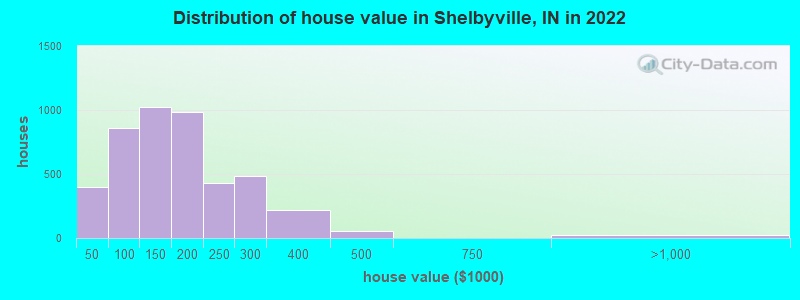
Home value of owner - occupied houses in 2022 in Shelbyville, IN
-
- 76Less than $10,000
- 57$10,000 to $14,999
- 34$15,000 to $19,999
- 145$20,000 to $24,999
- 25$25,000 to $29,999
- 5$35,000 to $39,999
- 52$40,000 to $49,999
- 104$50,000 to $59,999
- 53$60,000 to $69,999
- 165$70,000 to $79,999
- 194$80,000 to $89,999
- 285$90,000 to $99,999
- 623$100,000 to $124,999
- 397$125,000 to $149,999
- 869$150,000 to $174,999
- 113$175,000 to $199,999
- 426$200,000 to $249,999
- 488$250,000 to $299,999
- 217$300,000 to $399,999
- 52$400,000 to $499,999
- 25$750,000 to $999,999
Rent paid by renters in 2022 in Shelbyville, IN
-
- 22Less than $100
- 33$100 to $149
- 32$150 to $199
- 34$200 to $249
- 6$250 to $299
- 22$300 to $349
- 152$350 to $399
- 19$400 to $449
- 126$450 to $499
- 233$500 to $549
- 163$550 to $599
- 392$600 to $649
- 151$650 to $699
- 380$700 to $749
- 404$750 to $799
- 479$800 to $899
- 178$900 to $999
- 378$1,000 to $1,249
- 89$1,250 to $1,499
- 35$1,500 to $1,999
- 11$2,000 to $2,499
- 30$2,500 to $2,999
- 214No cash rent
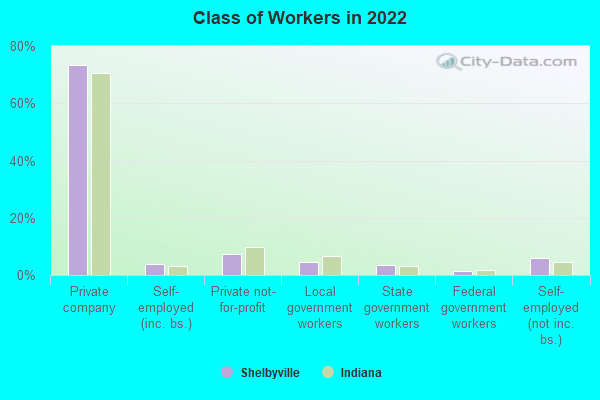
Percentage of workers working in this county: 69.3%
Number of people working at home: 844 (9.0% of all workers)
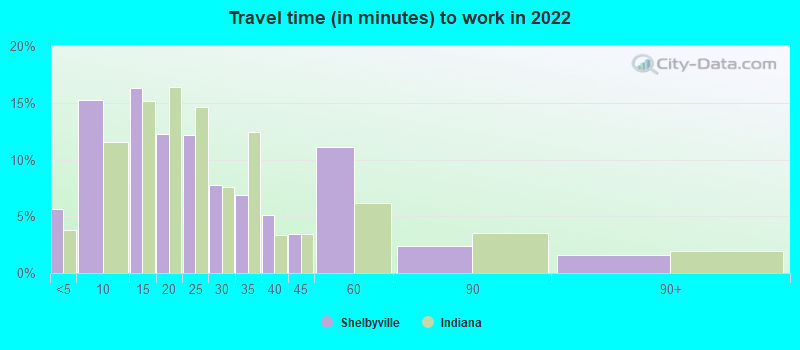
Travel time to work (commute)
- Less than 5 minutes: 710
- 5 to 9 minutes: 1,670
- 10 to 14 minutes: 1,467
- 15 to 19 minutes: 849
- 20 to 24 minutes: 660
- 25 to 29 minutes: 380
- 30 to 34 minutes: 719
- 35 to 39 minutes: 321
- 40 to 44 minutes: 624
- 45 to 59 minutes: 697
- 60 to 89 minutes: 337
- 90 or more minutes: 46
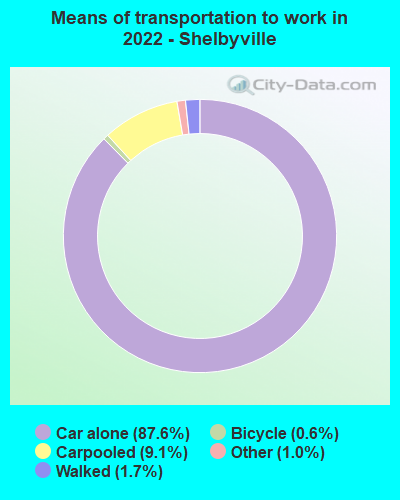
Means of transportation to work:
- Drove a car alone: 10,763 (80.1%)
- Carpooled: 1,239 (9.2%)
- Taxi: 149 (1.1%)
- Bicycle: 81 (0.6%)
- Walked: 210 (1.6%)
- Worked at home: 844 (6.3%)
- Unemployment by race in 2022
- Unemployment rate for White non-Hispanic residents
- 2.3%Males
- 2.3%Females
- Unemployment rate for two or more race residents
- 15.8%Females
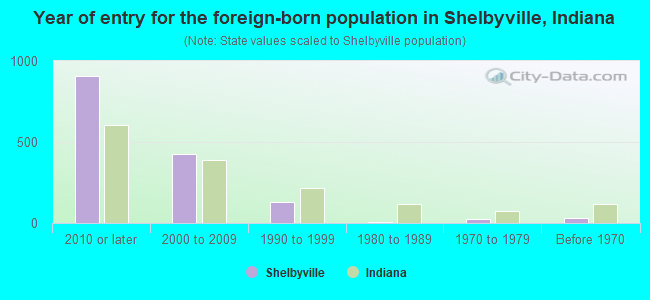
- Year of entry for the foreign-born population in Shelbyville, Indiana
- 9062010 or later
- 4242000 to 2009
- 1291990 to 1999
- 91980 to 1989
- 241970 to 1979
- 30Before 1970
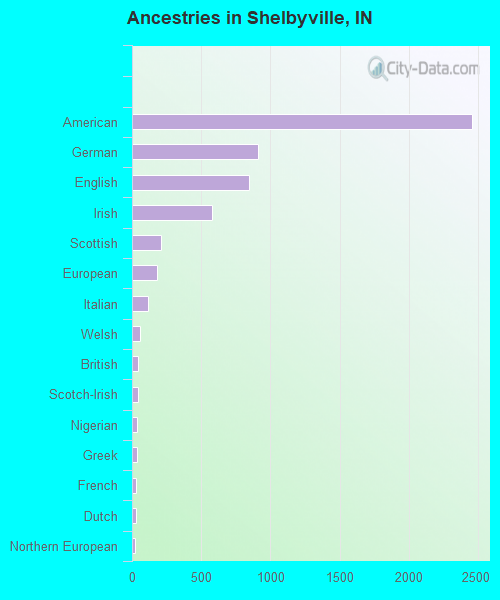
First ancestries reported:
- American: 2,455 (29.3%)
- German: 911 (10.9%)
- English: 845 (10.1%)
- Irish: 575 (6.9%)
- Scottish: 206 (2.5%)
- European: 177 (2.1%)
- Italian: 115 (1.4%)
- Welsh: 58 (0.7%)
- British: 45 (0.5%)
- Scotch-Irish: 40 (0.5%)
- Nigerian: 39 (0.5%)
- Greek: 38 (0.5%)
- French: 31 (0.4%)
- Dutch: 28 (0.3%)
- Northern European: 24 (0.3%)
- Polish: 17 (0.2%)
- African: 14 (0.2%)
- Swedish: 10 (0.1%)
- Eastern European: 7 (0.08%)
Most common places of birth for foreign-born residents (%):
| Shelbyville: | 48.6% (688) |
| Indiana: | 27.0% (101,996) |
| Shelbyville: | 16.7% (236) |
| Indiana: | 1.2% (4,520) |
| Shelbyville: | 13.0% (184) |
| Indiana: | 0.4% (1,469) |
| Shelbyville: | 6.6% (94) |
| Indiana: | 0.3% (977) |
| Shelbyville: | 4.0% (57) |
| Indiana: | 0.3% (1,221) |
| Shelbyville: | 3.0% (43) |
| Indiana: | 0.5% (1,962) |
| Shelbyville: | 2.2% (31) |
| Indiana: | 1.7% (6,439) |
| Shelbyville: | 2.0% (29) |
| Indiana: | 5.3% (19,877) |
| Shelbyville: | 1.6% (23) |
| Indiana: | 0.2% (832) |
Place of birth for U.S.-born residents:
- This state: 14,732
- Other state: 3,539
- Northeast: 204
- Midwest: 1,474
- South: 1,475
- West: 368
81.7% of Shelbyville residents lived in the same house 1 years ago.
Out of people who lived in different houses, 34.9% lived in this county.
Out of people who lived in different counties, 52.3% lived in Indiana.
| Shelbyville: | 81.7% |
| State average: | 87.1% |
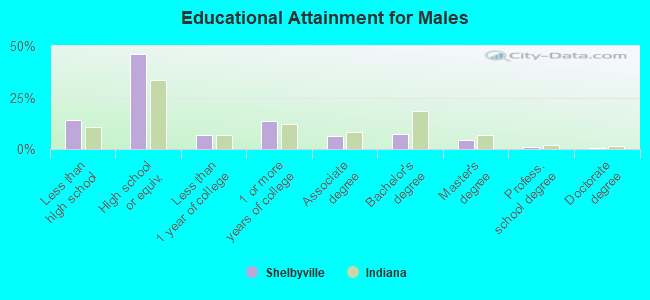
Education attainment for males 25 years and older:
- No schooling: 130
- Nursery to 4th grade: 33
- 5th and 6th grade: 84
- 7th and 8th grade: 51
- 9th grade: 132
- 10th grade: 100
- 11th grade: 178
- 12th grade, no diploma: 209
- High school graduate (or equivalency): 3,046
- Less than 1 year of college: 448
- Some college more than 1 year, no degree: 888
- Associate degree: 424
- Bachelor's degree: 488
- Master's degree: 288
- Professional school degree: 58
- Doctorate degree: 46
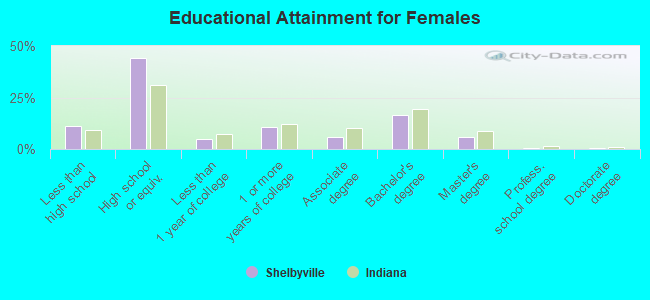
Education attainment for females 25 years and older:
- No schooling: 121
- Nursery to 4th grade: 18
- 5th and 6th grade: 69
- 7th and 8th grade: 168
- 9th grade: 90
- 10th grade: 126
- 11th grade: 70
- 12th grade, no diploma: 140
- High school graduate (or equivalency): 3,104
- Less than 1 year of college: 336
- Some college more than 1 year, no degree: 753
- Associate degree: 411
- Bachelor's degree: 1,175
- Master's degree: 394
- Professional school degree: 33
- Doctorate degree: 40


Housing units in structures:
- One, detached: 5,816
- One, attached: 377
- Two: 237
- 3 or 4: 690
- 5 to 9: 666
- 10 to 19: 511
- 20 to 49: 297
- 50 or more: 112
- Mobile homes: 579
Median worth of mobile homes: $26,596
Housing units lacking complete kitchen facilities in 2022: 1.3%
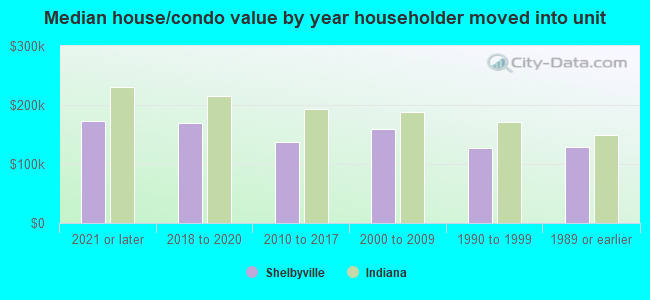
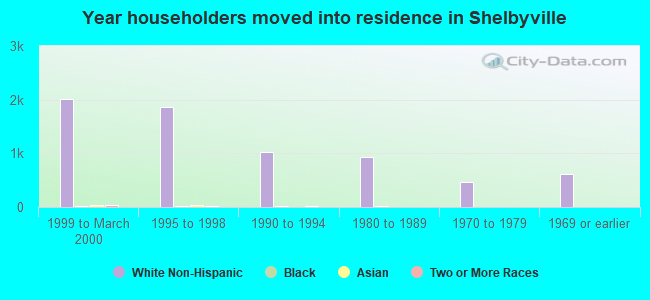
House/condo owner moved in on average 8 years ago
Renter moved in on average 4 years ago
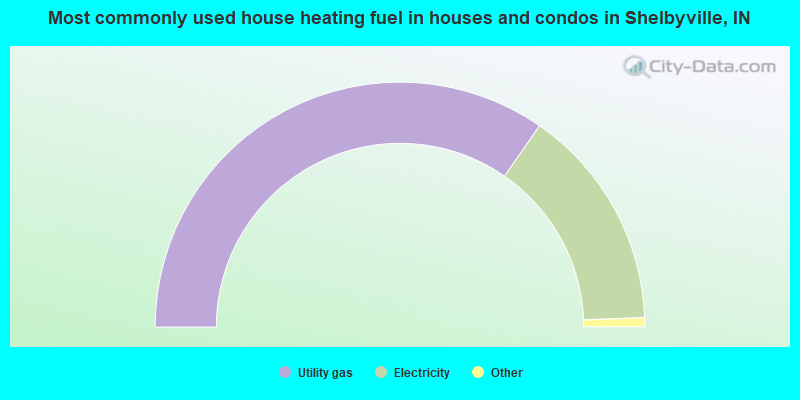
- 69.3%Utility gas
- 29.5%Electricity
- 0.7%Bottled, tank, or LP gas
- 0.4%Fuel oil, kerosene, etc.
- 0.1%Wood
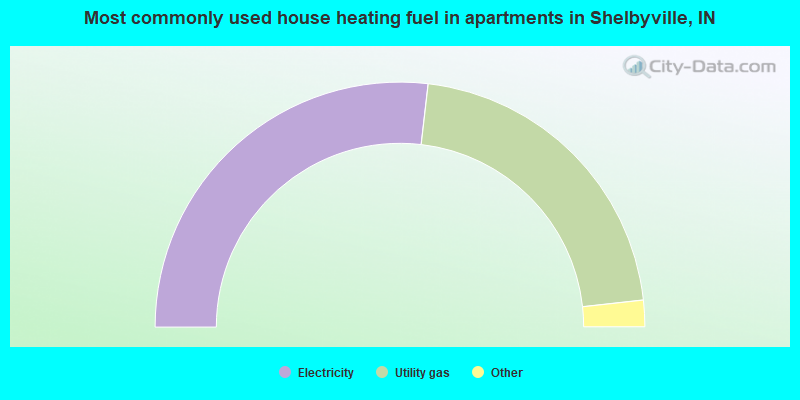
- 53.7%Electricity
- 42.8%Utility gas
- 1.9%Bottled, tank, or LP gas
- 1.0%Other fuel
- 0.5%No fuel used
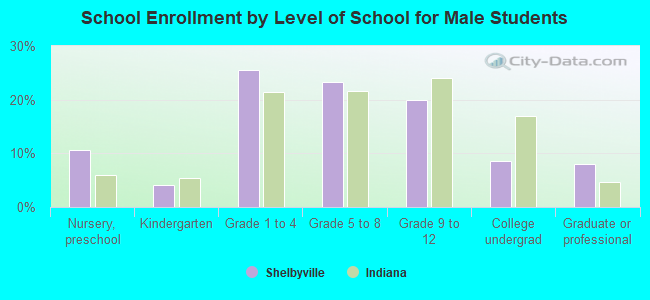
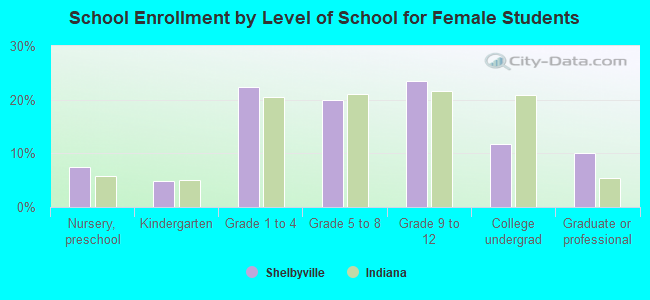
Private vs. public school enrollment:
| Here: | 11.1% |
| Indiana: | 14.9% |
| Here: | 2.4% |
| Indiana: | 11.4% |
| Here: | 20.3% |
| Indiana: | 22.3% |