Shoreline, WA (Washington) Houses and Residents
Estimated median house or condo value in 2022: $805,588 (it was $200,500 in 2000 )
Shoreline:
$805,588Washington:
$569,500
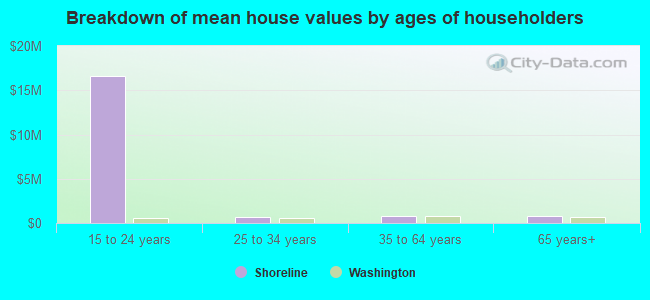
Lower value quartile - upper value quartile: $637,901 - $1,045,173Mean price in 2022: Detached houses: $1,007,033 Here:
$1,007,033State:
$734,307
Townhouses or other attached units: $668,639 Here:
$668,639State:
$657,697
In 2-unit structures: $862,047 Here:
$862,047State:
$534,634
In 3-to-4-unit structures: $476,323 Here:
$476,323State:
$510,239
In 5-or-more-unit structures: $380,980 Here:
$380,980State:
$503,183
Mobile homes: $402,414 Here:
$402,414State:
$218,362
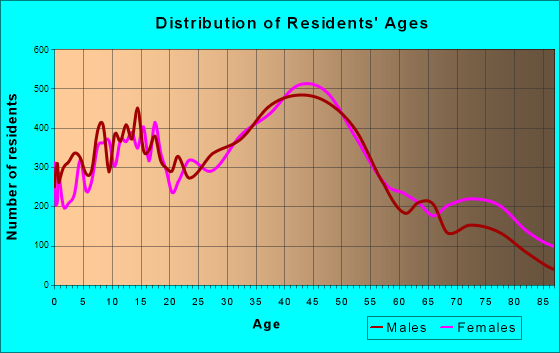
Total population: 55,174 (Urban population: 52,954, Rural population: 0)
Houses: 24,276 (23,451 occupied: 15,578 owner occupied, 7,840 renter occupied )
% of renters here:
33%State:
36%
Housing density: 2,081 houses/condos per square mile
Median price asked for vacant for-sale houses and condos in 2022: $603,008.
Median contract rent in 2022: $1,696 (lower quartile is $1,278, upper quartile is over $2,000)
Median rent asked for vacant for-rent units in 2022: $2,218
Median gross rent in Shoreline, WA in 2022: $1,821
Housing units in Shoreline with a mortgage: 10,526 (1,094 second mortgage, 11 home equity loan, 951 both second mortgage and home equity loan )Houses without a mortgage: 300
Median household income for houses/condos with a mortgage: $165,458
Median household income for apartments without a mortgage: $93,062
Median monthly housing costs: $2,071
Data:
Median house or condo value ($)
Median house or condo value ($ change since 2000)
Median house or condo value ($) - White
Median house or condo value ($) - Black or African American
Median house or condo value ($) - Asian
Median house or condo value ($) - Hispanic or Latino
Median house or condo value ($) - American Indian and Alaska Native
Median house or condo value ($) - Multirace
Median house or condo value ($) - Other Race
Median price asked for mobile homes ($)
Household density (households per square mile)
Mean house or condo value by units in structure - 1, detached ($)
Mean house or condo value by units in structure - 1, attached ($)
Mean house or condo value by units in structure - 2 ($)
Mean house or condo value by units in structure by units in structure - 3 or 4 ($)
Mean house or condo value by units in structure - 5 or more ($)
Mean house or condo value by units in structure - Boat, RV, van, etc. ($)
Mean house or condo value by units in structure - Mobile home ($)
Median contract rent ($)
Median contract rent - Lower quartile ($)
Median contract rent - Upper quartile ($)
Median gross rent ($)
Urban houses (%)
Rural houses (%)
Houses occupied (%)
Houses occupied (% change since 2000)
Houses owner occupied (%)
Houses owner occupied (% change since 2000)
Houses renter occupied (%)
Houses renter occupied (% change since 2000)
Vacant housing units - For rent (%)
Vacant housing units - For rent (% change since 2000)
Vacant housing units - For sale only (%)
Vacant housing units - For sale only (% change since 2000)
Vacant housing units - Rented or sold, not occupied (%)
Vacant housing units - Rented or sold, not occupied (% change since 2000)
Vacant housing units - For seasonal, recreational, or occasional use (%)
Vacant housing units - For seasonal, recreational, or occasional use (% change since 2000)
Vacant housing units - For migrant workers (%)
Vacant housing units - For migrant workers (% change since 2000)
Vacant housing units - Other vacant (%)
Vacant housing units - Other vacant (% change since 2000)
Median monthly housing costs ($)
Median household income for houses/condos with a mortgage ($)
Median household income for houses/condos without a mortgage ($)
Median household income ($)
Median household income ($) - White
Median household income ($) - Black or African American
Median household income ($) - Asian
Median household income ($) - Hispanic or Latino
Median household income ($) - American Indian and Alaska Native
Median household income ($) - Multirace
Median household income ($) - Other Race
Mortgage status - with mortgage (%)
Mortgage status - with second mortgage (%)
Mortgage status - with home equity loan (%)
Mortgage status - with both second mortgage and home equity loan (%)
Mortgage status - without a mortgage (%)
Median year house/condo built
Median year apartment built
Household type by relationship - Male householder living alone (%)
Household type by relationship - Male householder not living alone (%)
Household type by relationship - Female householder living alone (%)
Household type by relationship - Female householder not living alone (%)
Household type by relationship - Opposite-Sex spouse (%)
Household type by relationship - Same-Sex spouse (%)
Household type by relationship - Opposite-Sex unmarried partner (%)
Household type by relationship - Same-Sex unmarried partner (%)
Household type by relationship - In group quarters (%)
Size of family households - 2-person household (%)
Size of family households - 3-person household (%)
Size of family households - 4-person household (%)
Size of family households - 5-person household (%)
Size of family households - 6-person household (%)
Size of family households - 7-or-more-person household (%)
Size of nonfamily households - 1-person household (%)
Size of nonfamily households - 2-person household (%)
Size of nonfamily households - 3-person household (%)
Size of nonfamily households - 4-person household (%)
Size of nonfamily households - 5-person household (%)
Size of nonfamily households - 6-person household (%)
Size of nonfamily households - 7-or-moreperson household (%)
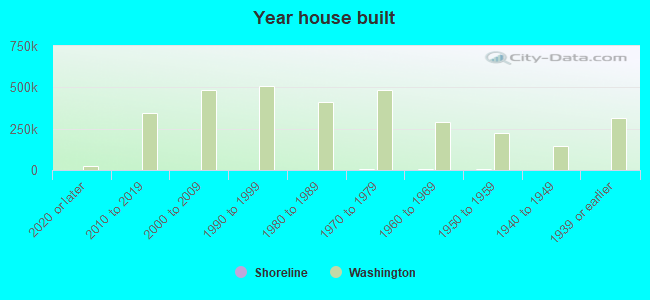
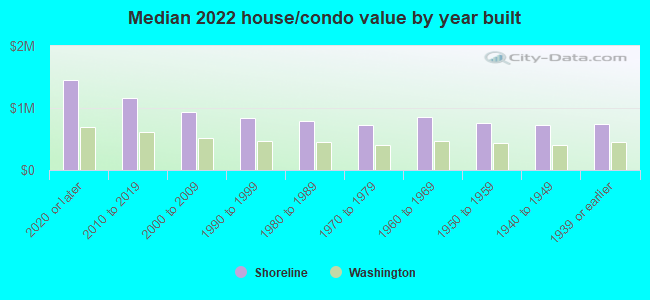
Year house built - Built 2010 or later (%)
Year house built - Built 2000 to 2009 (%)
Year house built - Built 1990 to 1999 (%)
Year house built - Built 1980 to 1989 (%)
Year house built - Built 1970 to 1979 (%)
Year house built - Built 1960 to 1969 (%)
Year house built - Built 1950 to 1959 (%)
Year house built - Built 1940 to 1949 (%)
Year house built - Built 1939 or earlier (%)
Median number of rooms in houses and condos
Median number of rooms in apartments
Median number of bedrooms in owner occupied houses
Mean number of bedrooms in owner occupied houses
Median number of bedrooms in renter occupied houses
Mean number of bedrooms in renter occupied houses
Median number of vehichles in owner occupied houses
Mean number of vehichles in owner occupied houses
Median number of vehichles in renter occupied houses
Mean number of vehichles in renter occupied houses
Rooms in owner-occupied houses - 1 room (%)
Rooms in owner-occupied houses - 2 rooms (%)
Rooms in owner-occupied houses - 3 rooms (%)
Rooms in owner-occupied houses - 4 rooms (%)
Rooms in owner-occupied houses - 5 rooms (%)
Rooms in owner-occupied houses - 6 rooms (%)
Rooms in owner-occupied houses - 7 rooms (%)
Rooms in owner-occupied houses - 8 rooms (%)
Rooms in owner-occupied houses - 9+ rooms (%)
Rooms in renter-occupied houses - 1 room (%)
Rooms in renter-occupied houses - 2 rooms (%)
Rooms in renter-occupied houses - 3 rooms (%)
Rooms in renter-occupied houses - 4 rooms (%)
Rooms in renter-occupied houses - 5 rooms (%)
Rooms in renter-occupied houses - 6 rooms (%)
Rooms in renter-occupied houses - 7 rooms (%)
Rooms in renter-occupied houses - 8 rooms (%)
Rooms in renter-occupied houses - 9+ rooms (%)
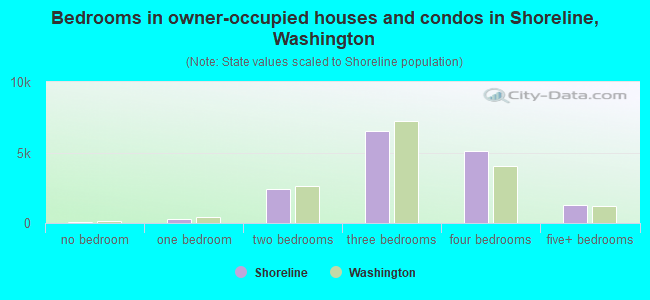
Bedrooms in owner-occupied houses - no bedrooms (%)
Bedrooms in owner-occupied houses - 1 bedroom (%)
Bedrooms in owner-occupied houses - 2 bedrooms (%)
Bedrooms in owner-occupied houses - 3 bedrooms (%)
Bedrooms in owner-occupied houses - 4 bedrooms (%)
Bedrooms in owner-occupied houses - 5+ bedrooms (%)
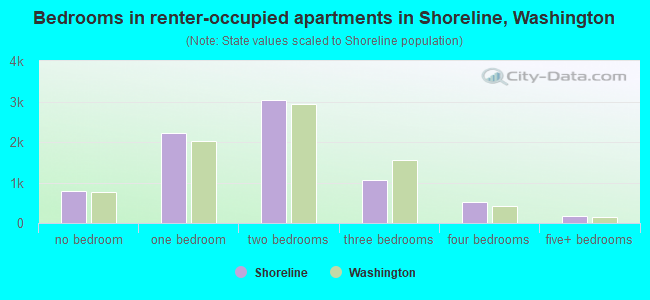
Bedrooms in renter-occupied houses - no bedrooms (%)
Bedrooms in renter-occupied houses - 1 bedroom (%)
Bedrooms in renter-occupied houses - 2 bedrooms (%)
Bedrooms in renter-occupied houses - 3 bedrooms (%)
Bedrooms in renter-occupied houses - 4 bedrooms (%)
Bedrooms in renter-occupied houses - 5+ bedrooms (%)
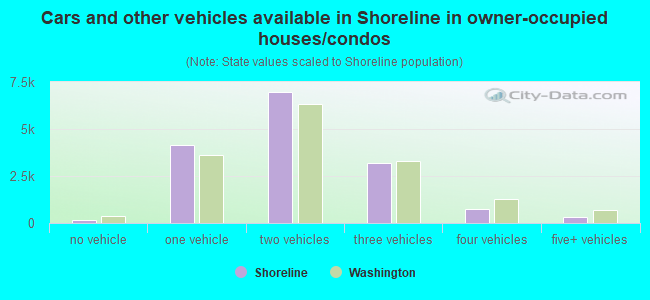
Vehicles available in owner-occupied houses - no vehicle available (%)
Vehicles available in owner-occupied houses - 1 vehicle available(%)
Vehicles available in owner-occupied houses - 2 Vehicles available (%)
Vehicles available in owner-occupied houses - 3 Vehicles available (%)
Vehicles available in owner-occupied houses - 4 Vehicles available (%)
Vehicles available in owner-occupied houses - 5+ Vehicles available (%)
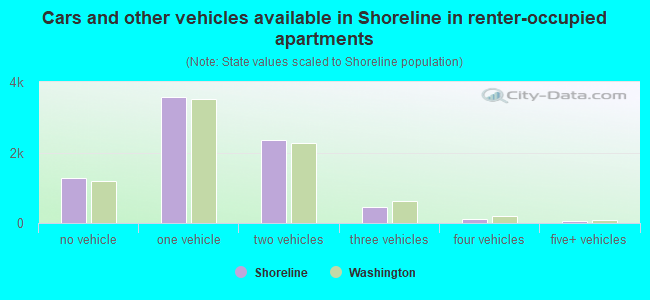
Vehicles available in renter-occupied houses - no vehicle available (%)
Vehicles available in renter-occupied houses - 1 vehicle available (%)
Vehicles available in renter-occupied houses - 2 Vehicles available (%)
Vehicles available in renter-occupied houses - 3 Vehicles available (%)
Vehicles available in renter-occupied houses - 4 Vehicles available (%)
Vehicles available in renter-occupied houses - 5+ Vehicles available (%)
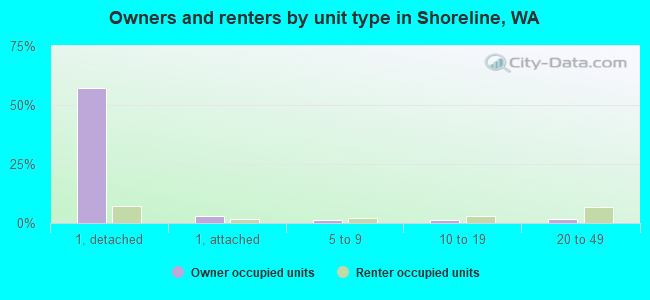
Housing units in structures - 1, detached (%)
Housing units in structures - 1, attached (%)
Housing units in structures - 2 (%)
Housing units in structures - 3 or 4 (%)
Housing units in structures - 5 to 9 (%)
Housing units in structures - 10 to 19 (%)
Housing units in structures - 20 to 49 (%)
Housing units in structures - 50 or more (%)
Housing units in structures - Mobile home (%)
Housing units in structures - Boat, RV, van, etc. (%)
Housing units in structures - Owners - 1, detached (%)
Housing units in structures - Owners - 1, attached (%)
Housing units in structures - Owners - 2 (%)
Housing units in structures - Owners - 3 or 4 (%)
Housing units in structures - Owners - 5 to 9 (%)
Housing units in structures - Owners - 10 to 19 (%)
Housing units in structures - Owners - 20 to 49 (%)
Housing units in structures - Owners - 50 or more (%)
Housing units in structures - Owners - Mobile home (%)
Housing units in structures - Owners - Boat, RV, van, etc. (%)
Housing units in structures - Renters - 1, detached (%)
Housing units in structures - Renters - 1, attached (%)
Housing units in structures - Renters - 2 (%)
Housing units in structures - Renters - 3 or 4 (%)
Housing units in structures - Renters - 5 to 9 (%)
Housing units in structures - Renters - 10 to 19 (%)
Housing units in structures - Renters - 20 to 49 (%)
Housing units in structures - Renters - 50 or more (%)
Housing units in structures - Renters - Mobile home (%)
Housing units in structures - Renters - Boat, RV, van, etc. (%)
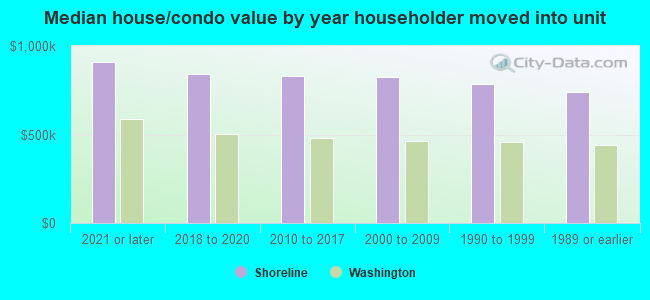
House/condo owner moved in on average (years ago)
Renter moved in on average (years ago)
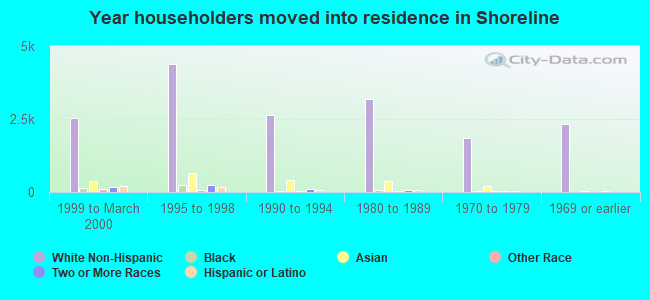
Year householder moved into unit - Moved in 1999 to March 2000 (%)
Year householder moved into unit - Moved in 1999 to March 2000 (%) - White
Year householder moved into unit - Moved in 1999 to March 2000 (%) - Black or African American
Year householder moved into unit - Moved in 1999 to March 2000 (%) - Asian
Year householder moved into unit - Moved in 1999 to March 2000 (%) - Hispanic or Latino
Year householder moved into unit - Moved in 1999 to March 2000 (%) - American Indian and Alaska Native
Year householder moved into unit - Moved in 1999 to March 2000 (%) - Multirace
Year householder moved into unit - Moved in 1999 to March 2000 (%) - Other Race
Year householder moved into unit - Moved in 1995 to 1998 (%)
Year householder moved into unit - Moved in 1995 to 1998 (%) - White
Year householder moved into unit - Moved in 1995 to 1998 (%) - Black or African American
Year householder moved into unit - Moved in 1995 to 1998 (%) - Asian
Year householder moved into unit - Moved in 1995 to 1998 (%) - Hispanic or Latino
Year householder moved into unit - Moved in 1995 to 1998 (%) - American Indian and Alaska Native
Year householder moved into unit - Moved in 1995 to 1998 (%) - Multirace
Year householder moved into unit - Moved in 1995 to 1998 (%) - Other Race
Year householder moved into unit - Moved in 1990 to 1994 (%)
Year householder moved into unit - Moved in 1990 to 1994 (%) - White
Year householder moved into unit - Moved in 1990 to 1994 (%) - Black or African American
Year householder moved into unit - Moved in 1990 to 1994 (%) - Asian
Year householder moved into unit - Moved in 1990 to 1994 (%) - Hispanic or Latino
Year householder moved into unit - Moved in 1990 to 1994 (%) - American Indian and Alaska Native
Year householder moved into unit - Moved in 1990 to 1994 (%) - Multirace
Year householder moved into unit - Moved in 1990 to 1994 (%) - Other Race
Year householder moved into unit - Moved in 1980 to 1989 (%)
Year householder moved into unit - Moved in 1980 to 1989 (%) - White
Year householder moved into unit - Moved in 1980 to 1989 (%) - Black or African American
Year householder moved into unit - Moved in 1980 to 1989 (%) - Asian
Year householder moved into unit - Moved in 1980 to 1989 (%) - Hispanic or Latino
Year householder moved into unit - Moved in 1980 to 1989 (%) - American Indian and Alaska Native
Year householder moved into unit - Moved in 1980 to 1989 (%) - Multirace
Year householder moved into unit - Moved in 1980 to 1989 (%) - Other Race
Year householder moved into unit - Moved in 1970 to 1979 (%)
Year householder moved into unit - Moved in 1970 to 1979 (%) - White
Year householder moved into unit - Moved in 1970 to 1979 (%) - Black or African American
Year householder moved into unit - Moved in 1970 to 1979 (%) - Asian
Year householder moved into unit - Moved in 1970 to 1979 (%) - Hispanic or Latino
Year householder moved into unit - Moved in 1970 to 1979 (%) - American Indian and Alaska Native
Year householder moved into unit - Moved in 1970 to 1979 (%) - Multirace
Year householder moved into unit - Moved in 1970 to 1979 (%) - Other Race
Year householder moved into unit - Moved in 1969 or earlier (%)
Year householder moved into unit - Moved in 1969 or earlier (%) - White
Year householder moved into unit - Moved in 1969 or earlier (%) - Black or African American
Year householder moved into unit - Moved in 1969 or earlier (%) - Asian
Year householder moved into unit - Moved in 1969 or earlier (%) - Hispanic or Latino
Year householder moved into unit - Moved in 1969 or earlier (%) - American Indian and Alaska Native
Year householder moved into unit - Moved in 1969 or earlier (%) - Multirace
Year householder moved into unit - Moved in 1969 or earlier (%) - Other Race
Housing units lacking complete plumbing facilities (%)
Housing units lacking complete kitchen facilities (%)
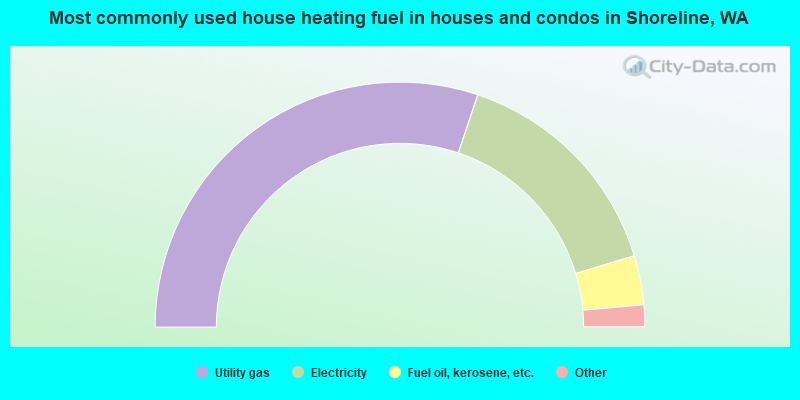
House heating fuel used in houses and condos - Utility gas (%)
House heating fuel used in houses and condos - Bottled, tank, or LP gas (%)
House heating fuel used in houses and condos - Electricity (%)
House heating fuel used in houses and condos - Fuel oil, kerosene, etc. (%)
House heating fuel used in houses and condos - Coal or coke (%)
House heating fuel used in houses and condos - Wood (%)
House heating fuel used in houses and condos - Solar energy (%)
House heating fuel used in houses and condos - Other fuel (%)
House heating fuel used in houses and condos - No fuel used (%)
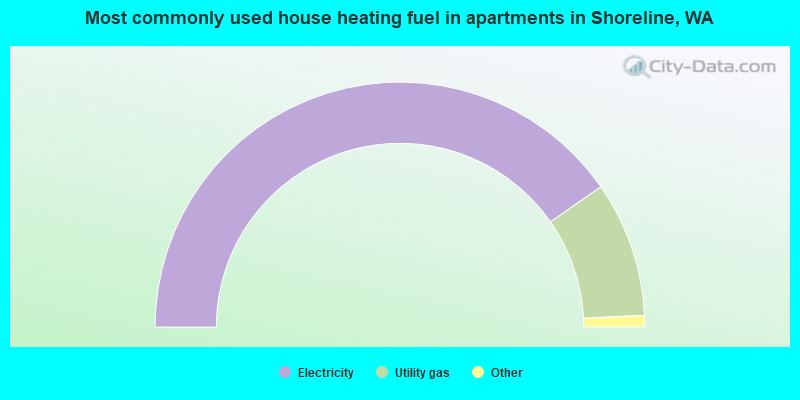
House heating fuel used in apartments - Utility gas (%)
House heating fuel used in apartments - Bottled, tank, or LP gas (%)
House heating fuel used in apartments - Electricity (%)
House heating fuel used in apartments - Fuel oil, kerosene, etc. (%)
House heating fuel used in apartments - Coal or coke (%)
House heating fuel used in apartments - Wood (%)
House heating fuel used in apartments - Solar energy (%)
House heating fuel used in apartments - Other fuel (%)
House heating fuel used in apartments - No fuel used (%)
Latest news about housing in Shoreline, WA collected exclusively by city-data.com from local newspapers, TV, and radio stations
Median year house/condo built: 1962Median year apartment built: 1983Household type by relationship:
Households: 58,996
Male householders: 11,638 (2,967 living alone ), Female householders: 11,192 (3,191 living alone )12,016 spouses (11,864 opposite-sex spouses ), 1,488 unmarried partners , (1,360 opposite-sex unmarried partners ), 15,216 children (14,477 natural , 517 adopted , 221 stepchildren ), 560 grandchildren , 659 brothers or sisters , 950 parents , 24 foster children , 780 other relatives , 2,517 non-relatives In group quarters: 1,951
Size of family households: 6,560 2-persons , 3,741 3-persons , 3,112 4-persons , 788 5-persons , 353 6-persons , 135 7-or-more-persons .
Size of nonfamily households: 6,622 1-person , 1,629 2-persons , 202 3-persons , 60 4-persons , 28 5-persons , 72 6-persons , 4 7-or-more-persons .
8,038 married couples with children. single-parent households (640 men , 1,491 women ).
72.4% of residents of Shoreline speak English at home. of residents speak Spanish at home (73% speak English very well , 15% speak English well , 8% speak English not well , 4% don't speak English at all ).of residents speak other Indo-European language at home (75% speak English very well , 16% speak English well , 9% speak English not well ).of residents speak Asian or Pacific Island language at home (57% speak English very well , 24% speak English well , 18% speak English not well , 1% don't speak English at all ).of residents speak other language at home (65% speak English very well , 21% speak English well , 12% speak English not well , 2% don't speak English at all ).
Foreign born population: 13,614 (23.1%)of them are naturalized citizens )
Median number of rooms in houses and condos:
Median number of rooms in apartments
Owner-occupied Renter-occupied
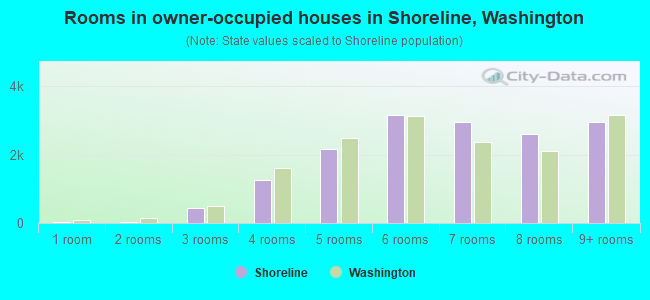
Rooms in owner-occupied houses in Shoreline, Washington
36 1 room 30 2 rooms 430 3 rooms 1,258 4 rooms 2,159 5 rooms 3,157 6 rooms 2,956 7 rooms 2,600 8 rooms 2,952 9+ rooms
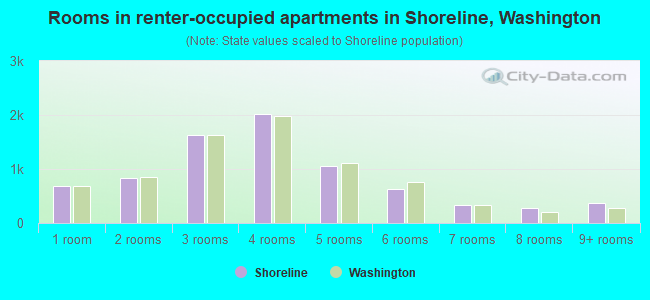
Rooms in renter-occupied apartments in Shoreline, Washington
678 1 room 836 2 rooms 1,636 3 rooms 2,010 4 rooms 1,051 5 rooms 636 6 rooms 341 7 rooms 276 8 rooms 375 9+ rooms
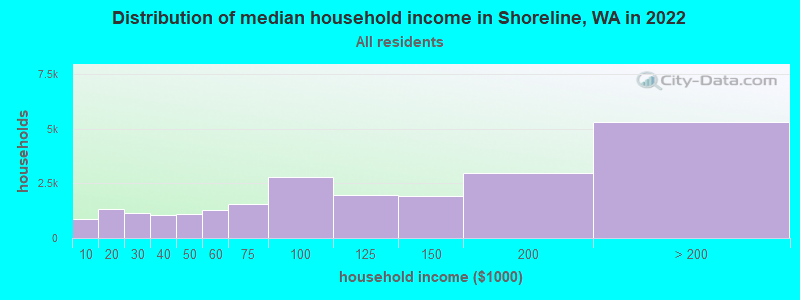
Shoreline, WA household income distribution 865 Less than $10,0001,311 $10,000 to $19,9991,151 $20,000 to $29,9991,050 $30,000 to $39,9991,106 $40,000 to $49,9991,263 $50,000 to $59,9991,541 $60,000 to $74,9992,788 $75,000 to $99,9991,949 $100,000 to $124,9991,921 $125,000 to $149,9992,996 $150,000 to $199,9995,314 $200,000 or more
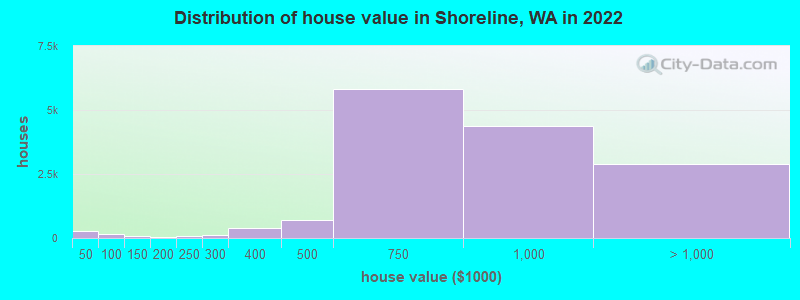
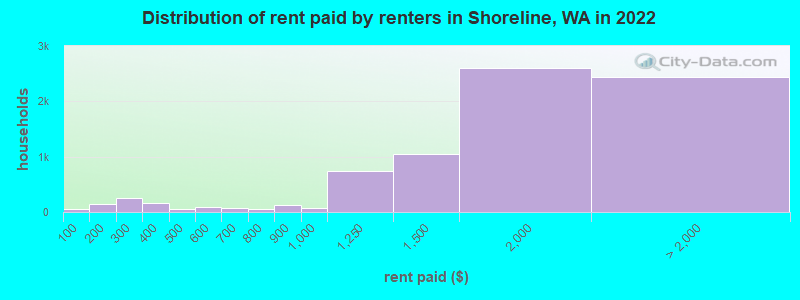
Home value of owner - occupied houses in 2022 in Shoreline, WA 216 Less than $10,0005 $10,000 to $14,9992 $25,000 to $29,99911 $35,000 to $39,99917 $40,000 to $49,99937 $50,000 to $59,99936 $60,000 to $69,99934 $70,000 to $79,99922 $80,000 to $89,99914 $90,000 to $99,99981 $100,000 to $124,99910 $125,000 to $149,99927 $150,000 to $174,99912 $175,000 to $199,99975 $200,000 to $249,999135 $250,000 to $299,999400 $300,000 to $399,999706 $400,000 to $499,9995,826 $500,000 to $749,9994,378 $750,000 to $999,9991,737 $1,000,000 to $1,499,999453 $1,500,000 to $1,999,999714 $2,000,000 or moreRent paid by renters in 2022 in Shoreline, WA 55 Less than $10057 $100 to $14995 $150 to $199164 $200 to $24985 $250 to $29940 $300 to $349122 $350 to $39933 $400 to $44918 $450 to $49975 $500 to $54919 $550 to $59963 $650 to $69939 $700 to $7496 $750 to $799127 $800 to $89979 $900 to $999741 $1,000 to $1,2491,053 $1,250 to $1,4992,600 $1,500 to $1,9991,202 $2,000 to $2,499567 $2,500 to $2,999359 $3,000 to $3,499157 $3,500 or more149 No cash rent
Percentage of workers working in this county: 86.1%Number of people working at home: 8,051 (26.2% of all workers )
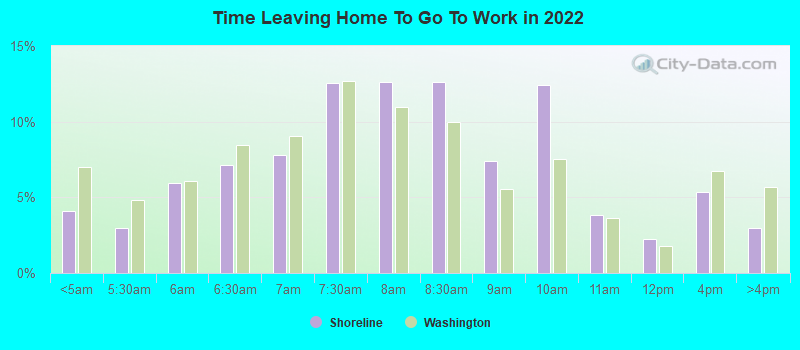
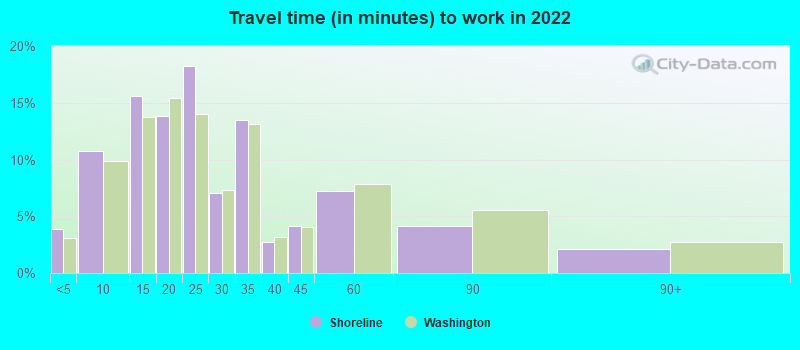
Travel time to work (commute)
Less than 5 minutes: 5555 to 9 minutes: 1,40010 to 14 minutes: 2,42615 to 19 minutes: 3,14420 to 24 minutes: 3,01525 to 29 minutes: 2,10330 to 34 minutes: 3,83135 to 39 minutes: 71740 to 44 minutes: 1,15645 to 59 minutes: 2,26160 to 89 minutes: 1,33490 or more minutes: 290
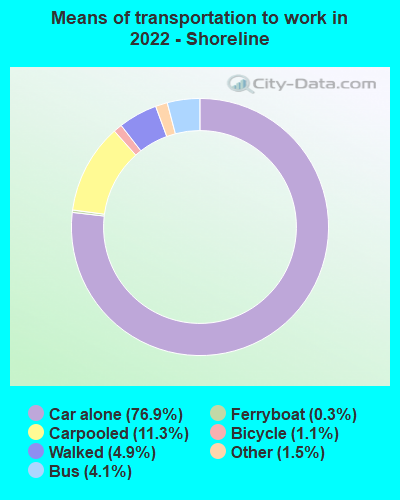
Means of transportation to work:
Drove a car alone: 11,825 (54.0%)Carpooled: 1,662 (7.6%)Bus : 387 (1.8%)Subway or elevated rail : 8 (0.0%)Ferryboat: 35 (0.2%)Taxi: 202 (0.9%)Bicycle: 149 (0.7%)Walked: 668 (3.0%)Worked at home: 8,051 (36.7%)
Unemployment by race in 2022
Unemployment rate for White non-Hispanic residents 3.9% Males4.0% FemalesUnemployment rate for Black residents 2.1% Males0.7% FemalesUnemployment rate for Asian residents 2.9% Males2.0% FemalesUnemployment rate for other race residents 0.9% MalesUnemployment rate for two or more race residents 2.7% Males2.9% FemalesUnemployment rate for Hispanic or Latino residents 4.0% Males3.8% Females
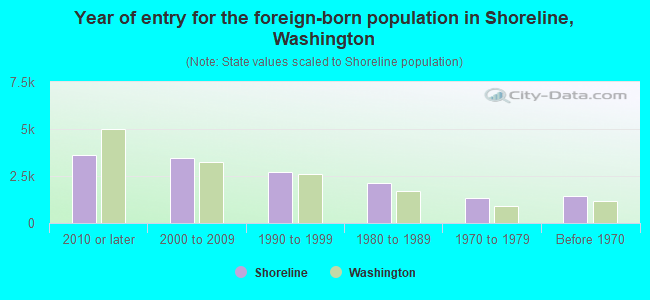
Year of entry for the foreign-born population in Shoreline, Washington
3,624 2010 or later 3,449 2000 to 2009 2,687 1990 to 1999 2,153 1980 to 1989 1,304 1970 to 1979 1,419 Before 1970
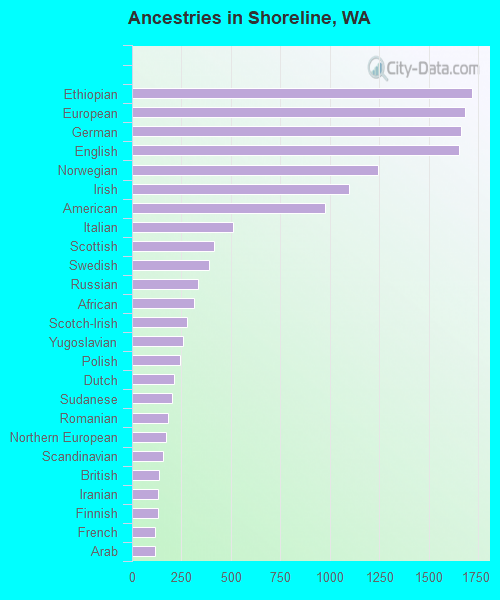
First ancestries reported:
Ethiopian: 1,719 (6.0%)
European: 1,682 (5.9%)
German: 1,662 (5.8%)
English: 1,655 (5.8%)
Norwegian: 1,246 (4.3%)
Irish: 1,097 (3.8%)
American: 974 (3.4%)
Italian: 513 (1.8%)
Scottish: 414 (1.4%)
Swedish: 388 (1.4%)
Russian: 334 (1.2%)
African: 313 (1.1%)
Scotch-Irish: 276 (1.0%)
Yugoslavian: 256 (0.9%)
Polish: 243 (0.8%)
Dutch: 212 (0.7%)
Sudanese: 203 (0.7%)
Romanian: 182 (0.6%)
Northern European: 174 (0.6%)
Scandinavian: 156 (0.5%)
British: 138 (0.5%)
Iranian: 132 (0.5%)
Finnish: 130 (0.5%)
French: 118 (0.4%)
Arab: 118 (0.4%)
Kenyan: 97 (0.3%)
Welsh: 86 (0.3%)
Greek: 79 (0.3%)
Eastern European: 79 (0.3%)
Nigerian: 78 (0.3%)
Egyptian: 77 (0.3%)
Palestinian: 74 (0.3%)
Swiss: 66 (0.2%)
Latvian: 57 (0.2%)
Danish: 51 (0.2%)
Ugandan: 48 (0.2%)
French Canadian: 47 (0.2%)
Albanian: 42 (0.1%)
Ghanaian: 35 (0.1%)
Ukrainian: 30 (0.1%)
Canadian: 27 (0.09%)
Hungarian: 26 (0.09%)
Brazilian: 26 (0.09%)
Australian: 22 (0.08%)
Jamaican: 17 (0.06%)
Portuguese: 16 (0.06%)
New Zealander: 16 (0.06%)
Lebanese: 14 (0.05%)
Somali: 12 (0.04%)
Macedonian: 11 (0.04%)
Slovak: 10 (0.03%)
South African: 9 (0.03%)
Basque: 8 (0.03%)
Slavic: 5 (0.02%)
Lithuanian: 3 (0.01%)
Most common places of birth for foreign-born residents (%): China, excluding Hong Kong and Taiwan Shoreline:
10.1% (1,369)Washington:
7.4% (84,470)
Ethiopia Shoreline:
7.7% (1,055)Washington:
1.6% (17,938)
Korea Shoreline:
7.7% (1,052)Washington:
4.3% (48,886)
Philippines Shoreline:
7.2% (982)Washington:
6.3% (71,661)
Mexico Shoreline:
5.9% (809)Washington:
21.1% (241,655)
Vietnam Shoreline:
5.7% (775)Washington:
5.4% (62,003)
Eritrea Shoreline:
4.6% (632)Washington:
0.4% (4,688)
India Shoreline:
4.6% (620)Washington:
8.9% (101,353)
Canada Shoreline:
4.4% (595)Washington:
4.1% (47,238)
Russia Shoreline:
3.7% (506)Washington:
1.9% (21,540)
Hong Kong Shoreline:
2.4% (321)Washington:
0.8% (8,785)
Bosnia and Herzegovina Shoreline:
2.1% (292)Washington:
0.3% (3,825)
Other Eastern Africa Shoreline:
2.0% (271)Washington:
0.1% (1,599)
Germany Shoreline:
1.8% (251)Washington:
1.6% (17,761)
England Shoreline:
1.7% (232)Washington:
0.8% (9,457)
Taiwan Shoreline:
1.7% (228)Washington:
1.5% (16,607)
Place of birth for U.S.-born residents:
This state: 25,246Other state: 18,820Northeast: 2,740Midwest: 5,187South: 3,504West: 7,420 87.5% of Shoreline residents lived in the same house 1 years ago.
Out of people who lived in different houses, 39.8% lived in this county.
Out of people who lived in different counties, 46.6% lived in Washington.
Shoreline:
87.5%State average:
85.2%
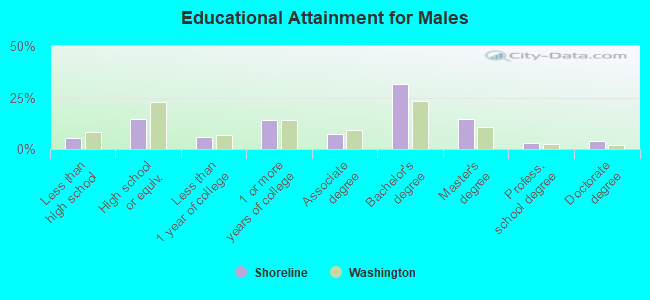
Education attainment for males 25 years and older:
No schooling: 228Nursery to 4th grade: 65th and 6th grade: 167th and 8th grade: 709th grade: 10110th grade: 21811th grade: 9812th grade, no diploma: 456High school graduate (or equivalency): 3,228Less than 1 year of college: 1,247Some college more than 1 year, no degree: 3,096Associate degree: 1,662Bachelor's degree: 6,917Master's degree: 3,269Professional school degree: 599Doctorate degree: 876
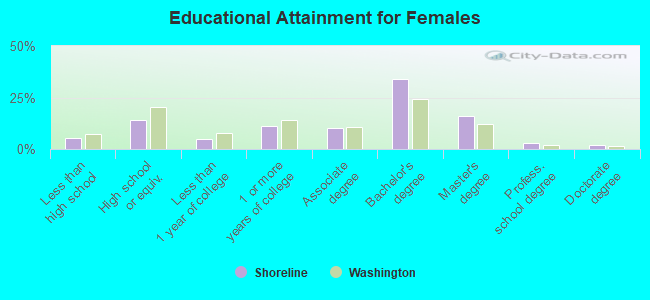
Education attainment for females 25 years and older:
No schooling: 307Nursery to 4th grade: 205th and 6th grade: 357th and 8th grade: 709th grade: 2710th grade: 9111th grade: 9412th grade, no diploma: 529High school graduate (or equivalency): 3,140Less than 1 year of college: 1,116Some college more than 1 year, no degree: 2,476Associate degree: 2,261Bachelor's degree: 7,675Master's degree: 3,597Professional school degree: 631Doctorate degree: 441
Housing units in structures:
One, detached: 16,020One, attached: 1,089Two: 3853 or 4: 6975 to 9: 82410 to 19: 1,01720 to 49: 2,08150 or more: 2,048Mobile homes: 112Housing units lacking complete plumbing facilities in 2022: 0.2%Housing units lacking complete kitchen facilities in 2022: 1.1%House/condo owner moved in on average 15 years ago
Renter moved in on average 4 years ago
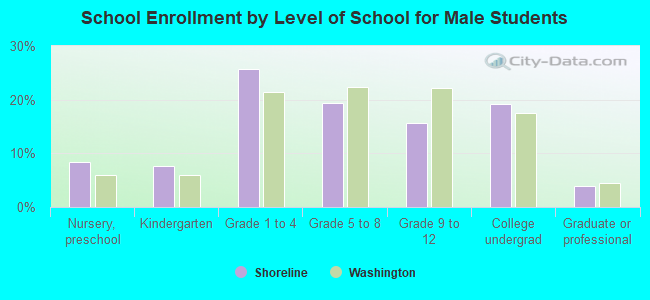
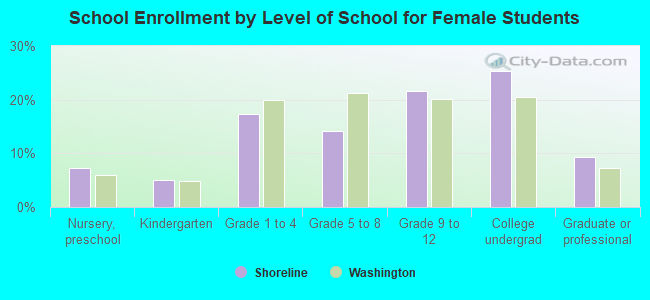
Private vs. public school enrollment:
Students in private schools in grades 1 to 8 (elementary and middle school): 603 Here:
13.0%Washington:
12.4%
Students in private schools in grades 9 to 12 (high school): 302 Here:
13.0%Washington:
9.2%
Students in private undergraduate colleges: 507 Here:
18.3%Washington:
16.5%