Simpsonville, SC (South Carolina) Houses and Residents
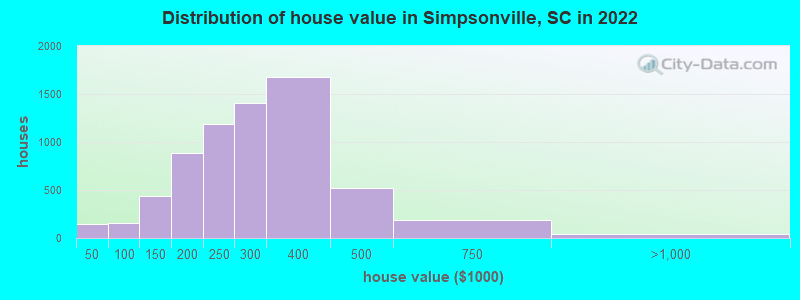
Estimated median house or condo value in 2022: $278,570 (it was $101,800 in 2000 )
Simpsonville:
$278,570South Carolina:
$254,600
Lower value quartile - upper value quartile: $211,568 - $355,569Mean price in 2022: Detached houses: $257,616 Here:
$257,616State:
$368,255
Townhouses or other attached units: $206,039 Here:
$206,039State:
$292,023
In 5-or-more-unit structures: $214,113 Here:
$214,113State:
$326,361
Mobile homes: $39,453 Here:
$39,453State:
$102,531
Total population: 20,125 (Urban population: 14,367, Rural population: 0)
Houses: 10,321 (9,736 occupied: 6,831 owner occupied, 2,938 renter occupied )
% of renters here:
30%State:
28%
Housing density: 1,658 houses/condos per square mile
Median price asked for vacant for-sale houses and condos in 2022: $465,639.
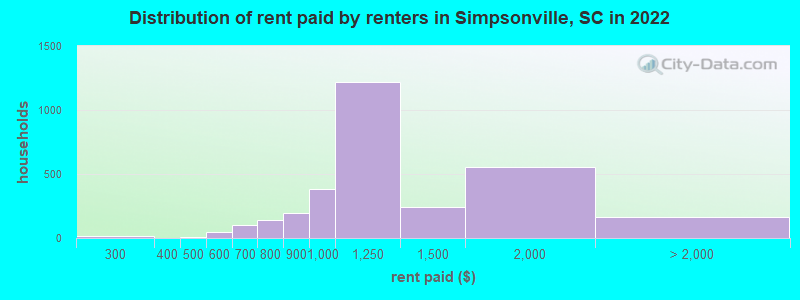
Median contract rent in 2022: $1,154 (lower quartile is $1,007, upper quartile is $1,359)
Median rent asked for vacant for-rent units in 2022: $1,598
Median gross rent in Simpsonville, SC in 2022: $1,224
Housing units in Simpsonville with a mortgage: 4,856 (268 second mortgage, 3 home equity loan, 188 both second mortgage and home equity loan )Houses without a mortgage: 95
Median household income for houses/condos with a mortgage: $103,204
Median household income for apartments without a mortgage: $74,695
Median monthly housing costs: $1,168
Data:
Median house or condo value ($)
Median house or condo value ($ change since 2000)
Median house or condo value ($) - White
Median house or condo value ($) - Black or African American
Median house or condo value ($) - Asian
Median house or condo value ($) - Hispanic or Latino
Median house or condo value ($) - American Indian and Alaska Native
Median house or condo value ($) - Multirace
Median house or condo value ($) - Other Race
Median price asked for mobile homes ($)
Household density (households per square mile)
Mean house or condo value by units in structure - 1, detached ($)
Mean house or condo value by units in structure - 1, attached ($)
Mean house or condo value by units in structure - 2 ($)
Mean house or condo value by units in structure by units in structure - 3 or 4 ($)
Mean house or condo value by units in structure - 5 or more ($)
Mean house or condo value by units in structure - Boat, RV, van, etc. ($)
Mean house or condo value by units in structure - Mobile home ($)
Median contract rent ($)
Median contract rent - Lower quartile ($)
Median contract rent - Upper quartile ($)
Median gross rent ($)
Urban houses (%)
Rural houses (%)
Houses occupied (%)
Houses occupied (% change since 2000)
Houses owner occupied (%)
Houses owner occupied (% change since 2000)
Houses renter occupied (%)
Houses renter occupied (% change since 2000)
Vacant housing units - For rent (%)
Vacant housing units - For rent (% change since 2000)
Vacant housing units - For sale only (%)
Vacant housing units - For sale only (% change since 2000)
Vacant housing units - Rented or sold, not occupied (%)
Vacant housing units - Rented or sold, not occupied (% change since 2000)
Vacant housing units - For seasonal, recreational, or occasional use (%)
Vacant housing units - For seasonal, recreational, or occasional use (% change since 2000)
Vacant housing units - For migrant workers (%)
Vacant housing units - For migrant workers (% change since 2000)
Vacant housing units - Other vacant (%)
Vacant housing units - Other vacant (% change since 2000)
Median monthly housing costs ($)
Median household income for houses/condos with a mortgage ($)
Median household income for houses/condos without a mortgage ($)
Median household income ($)
Median household income ($) - White
Median household income ($) - Black or African American
Median household income ($) - Asian
Median household income ($) - Hispanic or Latino
Median household income ($) - American Indian and Alaska Native
Median household income ($) - Multirace
Median household income ($) - Other Race
Mortgage status - with mortgage (%)
Mortgage status - with second mortgage (%)
Mortgage status - with home equity loan (%)
Mortgage status - with both second mortgage and home equity loan (%)
Mortgage status - without a mortgage (%)
Median year house/condo built
Median year apartment built
Household type by relationship - Male householder living alone (%)
Household type by relationship - Male householder not living alone (%)
Household type by relationship - Female householder living alone (%)
Household type by relationship - Female householder not living alone (%)
Household type by relationship - Opposite-Sex spouse (%)
Household type by relationship - Same-Sex spouse (%)
Household type by relationship - Opposite-Sex unmarried partner (%)
Household type by relationship - Same-Sex unmarried partner (%)
Household type by relationship - In group quarters (%)
Size of family households - 2-person household (%)
Size of family households - 3-person household (%)
Size of family households - 4-person household (%)
Size of family households - 5-person household (%)
Size of family households - 6-person household (%)
Size of family households - 7-or-more-person household (%)
Size of nonfamily households - 1-person household (%)
Size of nonfamily households - 2-person household (%)
Size of nonfamily households - 3-person household (%)
Size of nonfamily households - 4-person household (%)
Size of nonfamily households - 5-person household (%)
Size of nonfamily households - 6-person household (%)
Size of nonfamily households - 7-or-moreperson household (%)
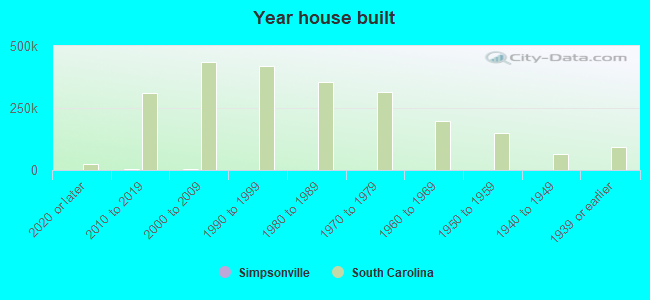
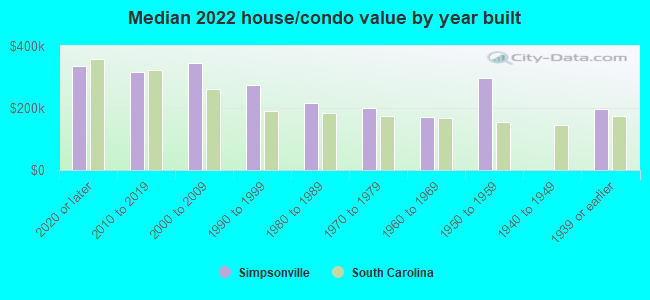
Year house built - Built 2010 or later (%)
Year house built - Built 2000 to 2009 (%)
Year house built - Built 1990 to 1999 (%)
Year house built - Built 1980 to 1989 (%)
Year house built - Built 1970 to 1979 (%)
Year house built - Built 1960 to 1969 (%)
Year house built - Built 1950 to 1959 (%)
Year house built - Built 1940 to 1949 (%)
Year house built - Built 1939 or earlier (%)
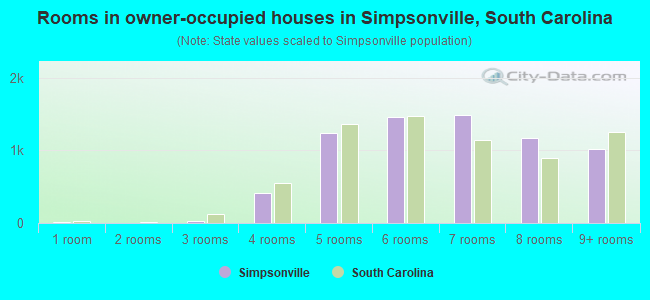
Median number of rooms in houses and condos
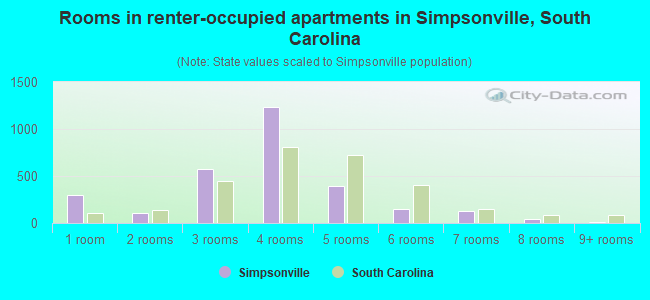
Median number of rooms in apartments
Median number of bedrooms in owner occupied houses
Mean number of bedrooms in owner occupied houses
Median number of bedrooms in renter occupied houses
Mean number of bedrooms in renter occupied houses
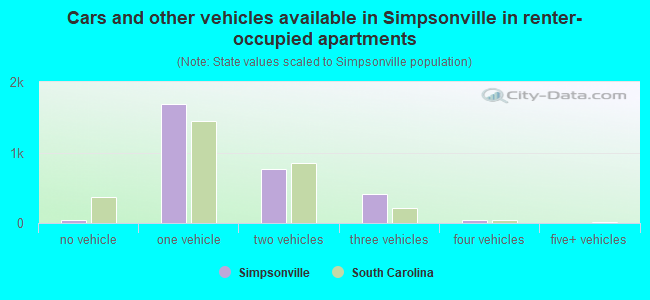
Median number of vehichles in owner occupied houses
Mean number of vehichles in owner occupied houses
Median number of vehichles in renter occupied houses
Mean number of vehichles in renter occupied houses
Rooms in owner-occupied houses - 1 room (%)
Rooms in owner-occupied houses - 2 rooms (%)
Rooms in owner-occupied houses - 3 rooms (%)
Rooms in owner-occupied houses - 4 rooms (%)
Rooms in owner-occupied houses - 5 rooms (%)
Rooms in owner-occupied houses - 6 rooms (%)
Rooms in owner-occupied houses - 7 rooms (%)
Rooms in owner-occupied houses - 8 rooms (%)
Rooms in owner-occupied houses - 9+ rooms (%)
Rooms in renter-occupied houses - 1 room (%)
Rooms in renter-occupied houses - 2 rooms (%)
Rooms in renter-occupied houses - 3 rooms (%)
Rooms in renter-occupied houses - 4 rooms (%)
Rooms in renter-occupied houses - 5 rooms (%)
Rooms in renter-occupied houses - 6 rooms (%)
Rooms in renter-occupied houses - 7 rooms (%)
Rooms in renter-occupied houses - 8 rooms (%)
Rooms in renter-occupied houses - 9+ rooms (%)
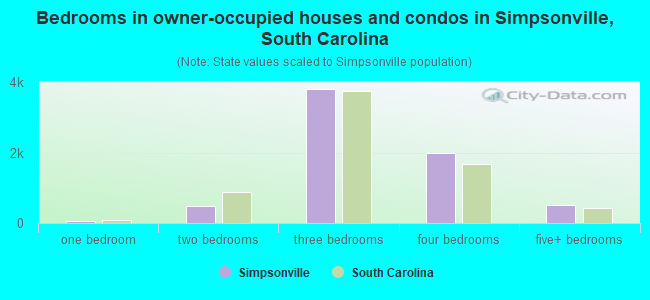
Bedrooms in owner-occupied houses - no bedrooms (%)
Bedrooms in owner-occupied houses - 1 bedroom (%)
Bedrooms in owner-occupied houses - 2 bedrooms (%)
Bedrooms in owner-occupied houses - 3 bedrooms (%)
Bedrooms in owner-occupied houses - 4 bedrooms (%)
Bedrooms in owner-occupied houses - 5+ bedrooms (%)
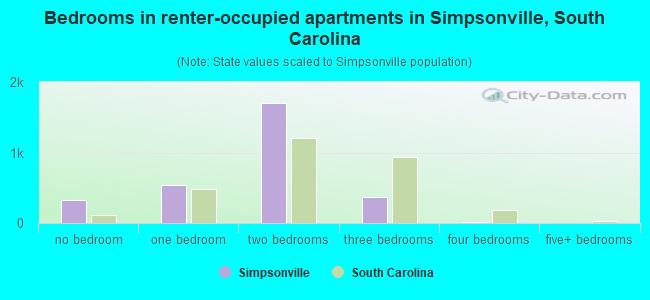
Bedrooms in renter-occupied houses - no bedrooms (%)
Bedrooms in renter-occupied houses - 1 bedroom (%)
Bedrooms in renter-occupied houses - 2 bedrooms (%)
Bedrooms in renter-occupied houses - 3 bedrooms (%)
Bedrooms in renter-occupied houses - 4 bedrooms (%)
Bedrooms in renter-occupied houses - 5+ bedrooms (%)
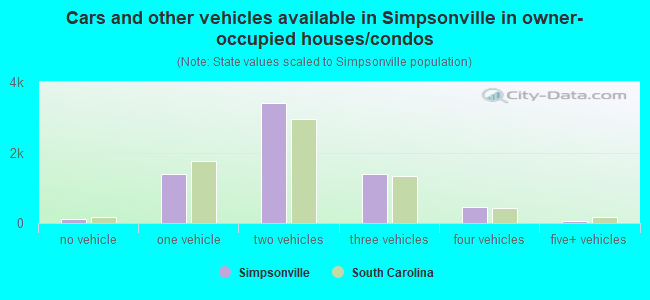
Vehicles available in owner-occupied houses - no vehicle available (%)
Vehicles available in owner-occupied houses - 1 vehicle available(%)
Vehicles available in owner-occupied houses - 2 Vehicles available (%)
Vehicles available in owner-occupied houses - 3 Vehicles available (%)
Vehicles available in owner-occupied houses - 4 Vehicles available (%)
Vehicles available in owner-occupied houses - 5+ Vehicles available (%)
Vehicles available in renter-occupied houses - no vehicle available (%)
Vehicles available in renter-occupied houses - 1 vehicle available (%)
Vehicles available in renter-occupied houses - 2 Vehicles available (%)
Vehicles available in renter-occupied houses - 3 Vehicles available (%)
Vehicles available in renter-occupied houses - 4 Vehicles available (%)
Vehicles available in renter-occupied houses - 5+ Vehicles available (%)
Housing units in structures - 1, detached (%)
Housing units in structures - 1, attached (%)
Housing units in structures - 2 (%)
Housing units in structures - 3 or 4 (%)
Housing units in structures - 5 to 9 (%)
Housing units in structures - 10 to 19 (%)
Housing units in structures - 20 to 49 (%)
Housing units in structures - 50 or more (%)
Housing units in structures - Mobile home (%)
Housing units in structures - Boat, RV, van, etc. (%)
Housing units in structures - Owners - 1, detached (%)
Housing units in structures - Owners - 1, attached (%)
Housing units in structures - Owners - 2 (%)
Housing units in structures - Owners - 3 or 4 (%)
Housing units in structures - Owners - 5 to 9 (%)
Housing units in structures - Owners - 10 to 19 (%)
Housing units in structures - Owners - 20 to 49 (%)
Housing units in structures - Owners - 50 or more (%)
Housing units in structures - Owners - Mobile home (%)
Housing units in structures - Owners - Boat, RV, van, etc. (%)
Housing units in structures - Renters - 1, detached (%)
Housing units in structures - Renters - 1, attached (%)
Housing units in structures - Renters - 2 (%)
Housing units in structures - Renters - 3 or 4 (%)
Housing units in structures - Renters - 5 to 9 (%)
Housing units in structures - Renters - 10 to 19 (%)
Housing units in structures - Renters - 20 to 49 (%)
Housing units in structures - Renters - 50 or more (%)
Housing units in structures - Renters - Mobile home (%)
Housing units in structures - Renters - Boat, RV, van, etc. (%)
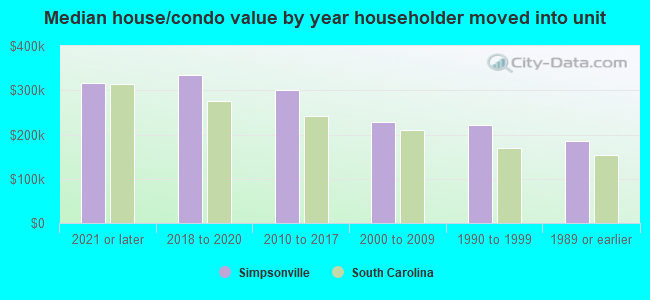
House/condo owner moved in on average (years ago)
Renter moved in on average (years ago)
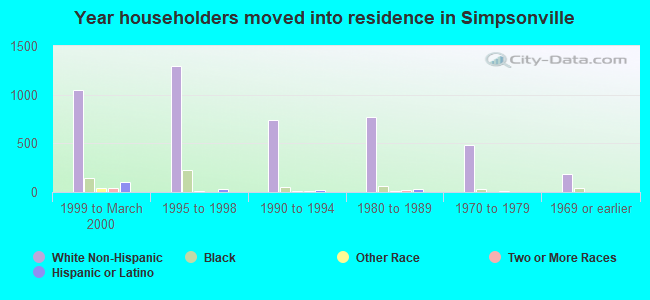
Year householder moved into unit - Moved in 1999 to March 2000 (%)
Year householder moved into unit - Moved in 1999 to March 2000 (%) - White
Year householder moved into unit - Moved in 1999 to March 2000 (%) - Black or African American
Year householder moved into unit - Moved in 1999 to March 2000 (%) - Asian
Year householder moved into unit - Moved in 1999 to March 2000 (%) - Hispanic or Latino
Year householder moved into unit - Moved in 1999 to March 2000 (%) - American Indian and Alaska Native
Year householder moved into unit - Moved in 1999 to March 2000 (%) - Multirace
Year householder moved into unit - Moved in 1999 to March 2000 (%) - Other Race
Year householder moved into unit - Moved in 1995 to 1998 (%)
Year householder moved into unit - Moved in 1995 to 1998 (%) - White
Year householder moved into unit - Moved in 1995 to 1998 (%) - Black or African American
Year householder moved into unit - Moved in 1995 to 1998 (%) - Asian
Year householder moved into unit - Moved in 1995 to 1998 (%) - Hispanic or Latino
Year householder moved into unit - Moved in 1995 to 1998 (%) - American Indian and Alaska Native
Year householder moved into unit - Moved in 1995 to 1998 (%) - Multirace
Year householder moved into unit - Moved in 1995 to 1998 (%) - Other Race
Year householder moved into unit - Moved in 1990 to 1994 (%)
Year householder moved into unit - Moved in 1990 to 1994 (%) - White
Year householder moved into unit - Moved in 1990 to 1994 (%) - Black or African American
Year householder moved into unit - Moved in 1990 to 1994 (%) - Asian
Year householder moved into unit - Moved in 1990 to 1994 (%) - Hispanic or Latino
Year householder moved into unit - Moved in 1990 to 1994 (%) - American Indian and Alaska Native
Year householder moved into unit - Moved in 1990 to 1994 (%) - Multirace
Year householder moved into unit - Moved in 1990 to 1994 (%) - Other Race
Year householder moved into unit - Moved in 1980 to 1989 (%)
Year householder moved into unit - Moved in 1980 to 1989 (%) - White
Year householder moved into unit - Moved in 1980 to 1989 (%) - Black or African American
Year householder moved into unit - Moved in 1980 to 1989 (%) - Asian
Year householder moved into unit - Moved in 1980 to 1989 (%) - Hispanic or Latino
Year householder moved into unit - Moved in 1980 to 1989 (%) - American Indian and Alaska Native
Year householder moved into unit - Moved in 1980 to 1989 (%) - Multirace
Year householder moved into unit - Moved in 1980 to 1989 (%) - Other Race
Year householder moved into unit - Moved in 1970 to 1979 (%)
Year householder moved into unit - Moved in 1970 to 1979 (%) - White
Year householder moved into unit - Moved in 1970 to 1979 (%) - Black or African American
Year householder moved into unit - Moved in 1970 to 1979 (%) - Asian
Year householder moved into unit - Moved in 1970 to 1979 (%) - Hispanic or Latino
Year householder moved into unit - Moved in 1970 to 1979 (%) - American Indian and Alaska Native
Year householder moved into unit - Moved in 1970 to 1979 (%) - Multirace
Year householder moved into unit - Moved in 1970 to 1979 (%) - Other Race
Year householder moved into unit - Moved in 1969 or earlier (%)
Year householder moved into unit - Moved in 1969 or earlier (%) - White
Year householder moved into unit - Moved in 1969 or earlier (%) - Black or African American
Year householder moved into unit - Moved in 1969 or earlier (%) - Asian
Year householder moved into unit - Moved in 1969 or earlier (%) - Hispanic or Latino
Year householder moved into unit - Moved in 1969 or earlier (%) - American Indian and Alaska Native
Year householder moved into unit - Moved in 1969 or earlier (%) - Multirace
Year householder moved into unit - Moved in 1969 or earlier (%) - Other Race
Housing units lacking complete plumbing facilities (%)
Housing units lacking complete kitchen facilities (%)
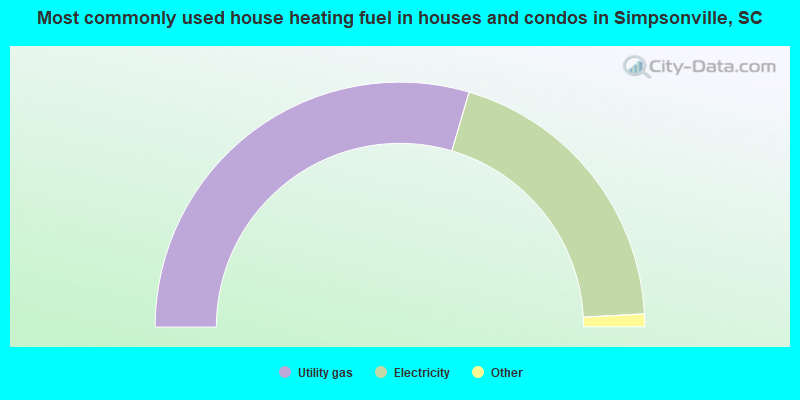
House heating fuel used in houses and condos - Utility gas (%)
House heating fuel used in houses and condos - Bottled, tank, or LP gas (%)
House heating fuel used in houses and condos - Electricity (%)
House heating fuel used in houses and condos - Fuel oil, kerosene, etc. (%)
House heating fuel used in houses and condos - Coal or coke (%)
House heating fuel used in houses and condos - Wood (%)
House heating fuel used in houses and condos - Solar energy (%)
House heating fuel used in houses and condos - Other fuel (%)
House heating fuel used in houses and condos - No fuel used (%)
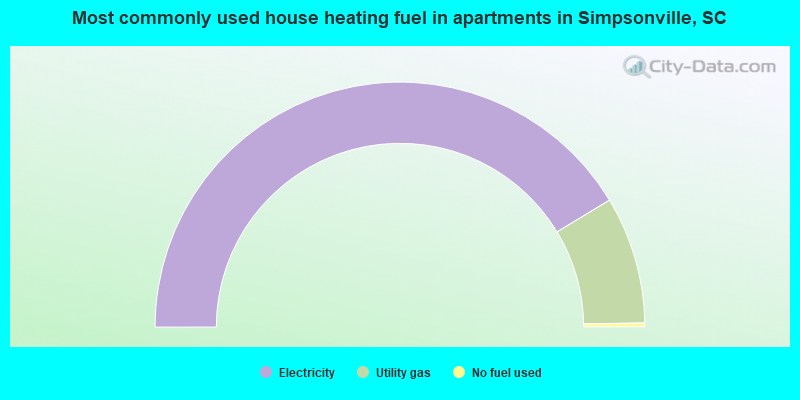
House heating fuel used in apartments - Utility gas (%)
House heating fuel used in apartments - Bottled, tank, or LP gas (%)
House heating fuel used in apartments - Electricity (%)
House heating fuel used in apartments - Fuel oil, kerosene, etc. (%)
House heating fuel used in apartments - Coal or coke (%)
House heating fuel used in apartments - Wood (%)
House heating fuel used in apartments - Solar energy (%)
House heating fuel used in apartments - Other fuel (%)
House heating fuel used in apartments - No fuel used (%)
Latest news about housing in Simpsonville, SC collected exclusively by city-data.com from local newspapers, TV, and radio stations
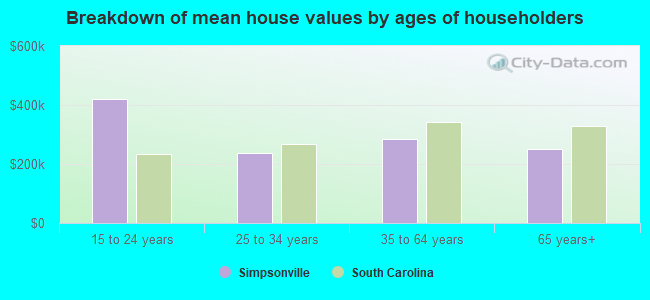
Median year house/condo built: 1998Median year apartment built: 1993Household type by relationship:
Households: 25,032
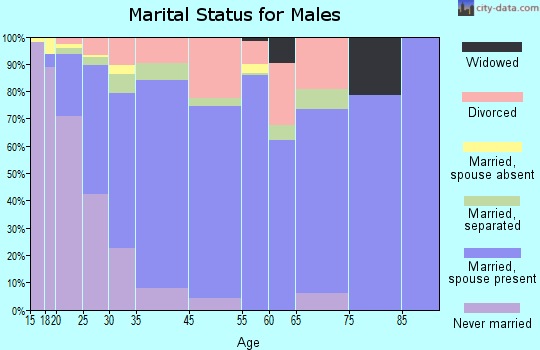
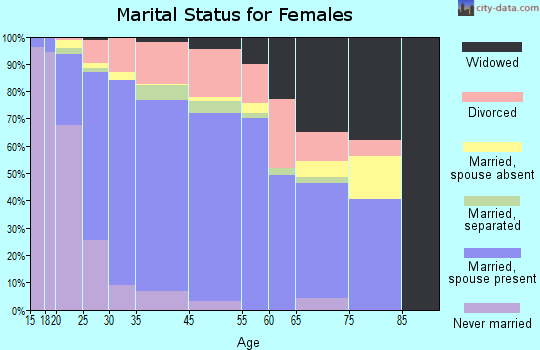
Male householders: 5,297 (1,264 living alone ), Female householders: 4,304 (1,299 living alone )5,091 spouses (5,014 opposite-sex spouses ), 410 unmarried partners , (352 opposite-sex unmarried partners ), 7,990 children (7,577 natural , 206 adopted , 206 stepchildren ), 498 grandchildren , 291 brothers or sisters , 277 parents , 14 foster children , 125 other relatives , 509 non-relatives In group quarters: 220
Size of family households: 2,993 2-persons , 1,509 3-persons , 1,070 4-persons , 928 5-persons , 144 6-persons , 202 7-or-more-persons .
Size of nonfamily households: 2,601 1-person , 327 2-persons , 29 3-persons , 21 5-persons .
4,744 married couples with children. single-parent households (453 men , 522 women ).
89.1% of residents of Simpsonville speak English at home. of residents speak Spanish at home (67% speak English very well , 21% speak English well , 9% speak English not well , 4% don't speak English at all ).of residents speak other Indo-European language at home (54% speak English very well , 35% speak English well , 11% speak English not well ).of residents speak Asian or Pacific Island language at home (94% speak English very well , 6% speak English well ).of residents speak other language at home (90% speak English very well , 10% speak English not well ).
Foreign born population: 1,775 (7.1%)of them are naturalized citizens )
Median number of rooms in houses and condos:
Median number of rooms in apartments
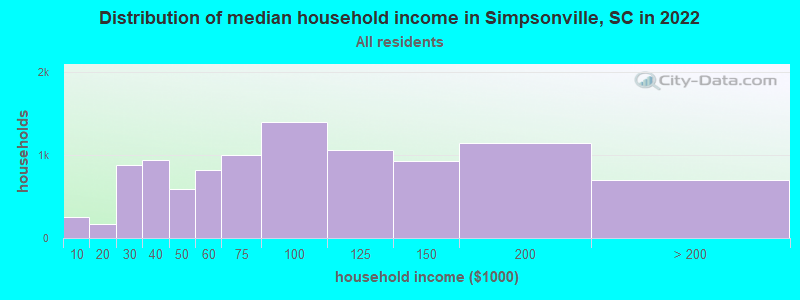
Simpsonville, SC household income distribution 258 Less than $10,000174 $10,000 to $19,999884 $20,000 to $29,999945 $30,000 to $39,999585 $40,000 to $49,999826 $50,000 to $59,999998 $60,000 to $74,9991,399 $75,000 to $99,9991,061 $100,000 to $124,999924 $125,000 to $149,9991,148 $150,000 to $199,999703 $200,000 or more
Home value of owner - occupied houses in 2022 in Simpsonville, SC 23 Less than $10,00047 $10,000 to $14,99953 $25,000 to $29,99921 $35,000 to $39,99914 $60,000 to $69,99926 $70,000 to $79,99935 $80,000 to $89,99977 $90,000 to $99,999222 $100,000 to $124,999218 $125,000 to $149,999458 $150,000 to $174,999422 $175,000 to $199,9991,188 $200,000 to $249,9991,402 $250,000 to $299,9991,676 $300,000 to $399,999522 $400,000 to $499,999187 $500,000 to $749,99926 $750,000 to $999,99914 $1,000,000 to $1,499,999Rent paid by renters in 2022 in Simpsonville, SC 18 $200 to $2491 $300 to $3498 $450 to $49943 $550 to $59960 $600 to $64942 $650 to $69925 $700 to $749118 $750 to $799193 $800 to $899380 $900 to $9991,214 $1,000 to $1,249240 $1,250 to $1,499551 $1,500 to $1,99983 $2,000 to $2,49978 No cash rent
Percentage of workers working in this county: 82.2%Number of people working at home: 2,114 (16.1% of all workers )
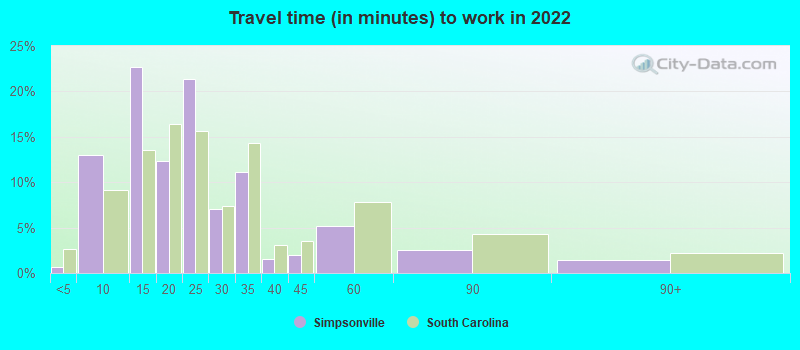
Travel time to work (commute)
Less than 5 minutes: 1985 to 9 minutes: 1,11110 to 14 minutes: 1,39715 to 19 minutes: 1,72120 to 24 minutes: 2,06425 to 29 minutes: 1,09930 to 34 minutes: 1,81035 to 39 minutes: 35440 to 44 minutes: 44345 to 59 minutes: 53960 to 89 minutes: 24990 or more minutes: 67
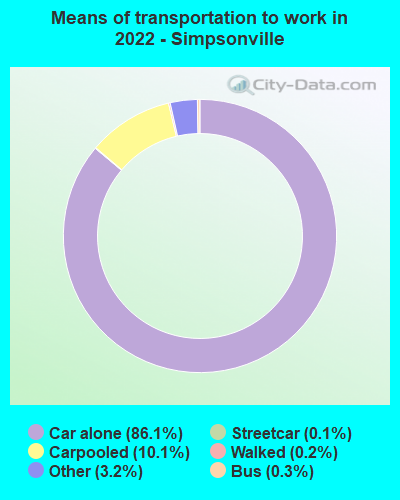
Means of transportation to work:
Drove a car alone: 7,336 (71.2%)Carpooled: 804 (7.8%)Bus : 28 (0.3%)Subway or elevated rail : 12 (0.1%)Taxi: 172 (1.7%)Walked: 12 (0.1%)Worked at home: 2,114 (20.5%)
Unemployment by race in 2022
Unemployment rate for White non-Hispanic residents 2.0% Males2.2% FemalesUnemployment rate for Black residents 12.7% Males0.9% FemalesUnemployment rate for two or more race residents 0.6% Males1.4% FemalesUnemployment rate for Hispanic or Latino residents 2.5% Males
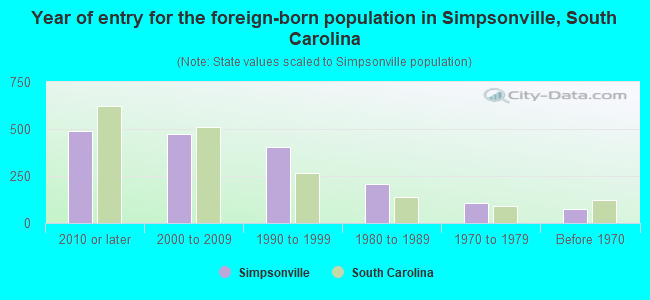
Year of entry for the foreign-born population in Simpsonville, South Carolina
492 2010 or later 472 2000 to 2009 403 1990 to 1999 208 1980 to 1989 107 1970 to 1979 73 Before 1970
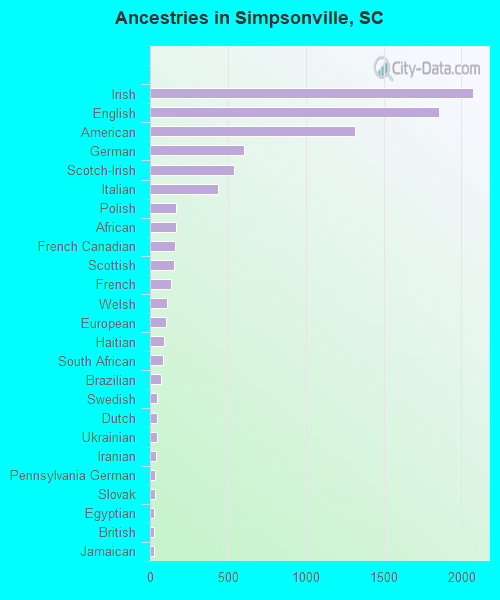
First ancestries reported:
Irish: 2,074 (16.8%)
English: 1,854 (15.0%)
American: 1,315 (10.6%)
German: 605 (4.9%)
Scotch-Irish: 540 (4.4%)
Italian: 439 (3.6%)
Polish: 170 (1.4%)
African: 164 (1.3%)
French Canadian: 160 (1.3%)
Scottish: 155 (1.3%)
French: 135 (1.1%)
Welsh: 112 (0.9%)
European: 101 (0.8%)
Haitian: 92 (0.7%)
South African: 81 (0.7%)
Brazilian: 69 (0.6%)
Swedish: 46 (0.4%)
Dutch: 43 (0.3%)
Ukrainian: 42 (0.3%)
Iranian: 36 (0.3%)
Pennsylvania German: 35 (0.3%)
Slovak: 30 (0.2%)
Egyptian: 28 (0.2%)
British: 28 (0.2%)
Jamaican: 27 (0.2%)
Eastern European: 24 (0.2%)
Romanian: 22 (0.2%)
Greek: 18 (0.1%)
Russian: 17 (0.1%)
Hungarian: 11 (0.09%)
Northern European: 11 (0.09%)
Armenian: 7 (0.06%)
Norwegian: 6 (0.05%) Most common places of birth for foreign-born residents (%): Colombia Simpsonville:
31.8% (603)South Carolina:
4.3% (11,533)
Mexico Simpsonville:
9.5% (180)South Carolina:
22.5% (60,774)
Brazil Simpsonville:
8.1% (154)South Carolina:
2.0% (5,344)
India Simpsonville:
5.4% (102)South Carolina:
6.8% (18,307)
Haiti Simpsonville:
4.9% (92)South Carolina:
0.3% (921)
Cuba Simpsonville:
4.3% (82)South Carolina:
1.5% (3,987)
South Africa Simpsonville:
4.0% (75)South Carolina:
0.4% (1,091)
Canada Simpsonville:
2.9% (55)South Carolina:
3.0% (8,193)
Ireland Simpsonville:
2.7% (51)South Carolina:
0.4% (1,080)
Egypt Simpsonville:
2.7% (51)South Carolina:
0.4% (1,208)
Kazakhstan Simpsonville:
2.5% (47)South Carolina:
0.2% (579)
China, excluding Hong Kong and Taiwan Simpsonville:
2.3% (44)South Carolina:
3.2% (8,721)
Romania Simpsonville:
2.3% (44)South Carolina:
0.6% (1,507)
Iran Simpsonville:
2.3% (43)South Carolina:
0.5% (1,270)
El Salvador Simpsonville:
2.2% (41)South Carolina:
1.1% (2,998)
France Simpsonville:
1.6% (31)South Carolina:
0.7% (1,940)
United Arab Emirates Simpsonville:
1.5% (29)South Carolina:
0.0% (131)
Place of birth for U.S.-born residents:
This state: 12,990Other state: 10,100Northeast: 2,388Midwest: 2,017South: 4,590West: 1,081 84.8% of Simpsonville residents lived in the same house 1 years ago.
Out of people who lived in different houses, 34.8% lived in this county.
Out of people who lived in different counties, 32.8% lived in South Carolina.
Simpsonville:
84.8%State average:
86.5%
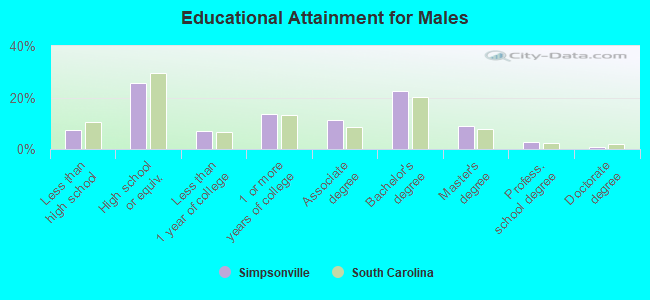
Education attainment for males 25 years and older:
No schooling: 173Nursery to 4th grade: 05th and 6th grade: 607th and 8th grade: 109th grade: 310th grade: 3211th grade: 13412th grade, no diploma: 205High school graduate (or equivalency): 2,160Less than 1 year of college: 580Some college more than 1 year, no degree: 1,147Associate degree: 942Bachelor's degree: 1,891Master's degree: 749Professional school degree: 222Doctorate degree: 80
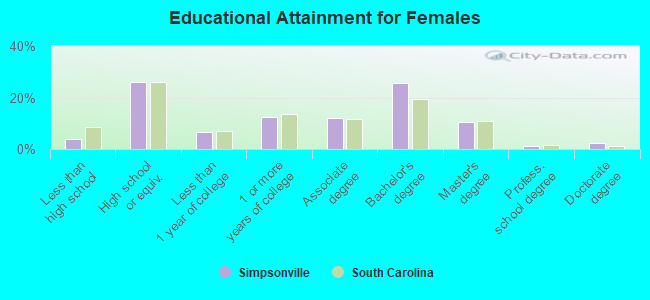
Education attainment for females 25 years and older:
No schooling: 32Nursery to 4th grade: 05th and 6th grade: 177th and 8th grade: 129th grade: 1810th grade: 6211th grade: 15612th grade, no diploma: 29High school graduate (or equivalency): 2,241Less than 1 year of college: 566Some college more than 1 year, no degree: 1,063Associate degree: 1,037Bachelor's degree: 2,214Master's degree: 916Professional school degree: 110Doctorate degree: 200
Housing units in structures:
One, detached: 7,230One, attached: 295Two: 2983 or 4: 5145 to 9: 78310 to 19: 27220 to 49: 44850 or more: 286Mobile homes: 192Median worth of mobile homes: $34,345
Housing units lacking complete plumbing facilities in 2022: 0.6%Housing units lacking complete kitchen facilities in 2022: 2.3%House/condo owner moved in on average 7 years ago
Renter moved in on average 3 years ago
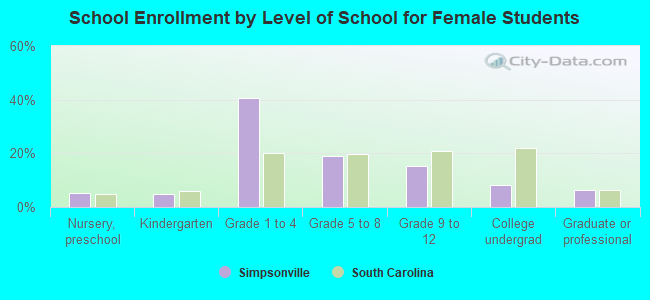
Private vs. public school enrollment:
Students in private schools in grades 1 to 8 (elementary and middle school): 399 Here:
12.4%South Carolina:
14.4%
Students in private schools in grades 9 to 12 (high school): 221 Here:
26.3%South Carolina:
11.1%
Students in private undergraduate colleges: 169 Here:
34.9%South Carolina:
21.9%