Sioux Falls, SD (South Dakota) Houses and Residents
Estimated median house or condo value in 2022: $274,600 (it was $97,300 in 2000 )
Sioux Falls:
$274,600South Dakota:
$245,000
Lower value quartile - upper value quartile: $196,700 - $393,900Mean price in 2022: Detached houses: $338,578 Here:
$338,578State:
$303,134
Townhouses or other attached units: $283,136 Here:
$283,136State:
$292,182
In 2-unit structures: $175,258 Here:
$175,258State:
$202,885
In 3-to-4-unit structures: $234,252 Here:
$234,252State:
$310,946
In 5-or-more-unit structures: $158,522 Here:
$158,522State:
$177,195
Mobile homes: $38,583 Here:
$38,583State:
$82,732
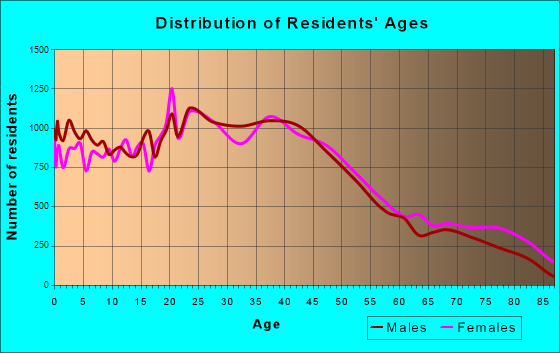
Total population: 168,586 (Urban population: 123,414, Rural population: 682 (all nonfarm) )
Houses: 89,528 (86,565 occupied: 53,913 owner occupied, 32,652 renter occupied )
% of renters here:
38%State:
30%
Housing density: 1,590 houses/condos per square mile
Median price asked for vacant for-sale houses and condos in 2022: $177,161.
Median contract rent in 2022: $866 (lower quartile is $701, upper quartile is $1,077)
Median rent asked for vacant for-rent units in 2022: $1,343
Median gross rent in Sioux Falls, SD in 2022: $966
Housing units in Sioux Falls with a mortgage: 36,281 (3,379 second mortgage, 231 home equity loan, 3,043 both second mortgage and home equity loan )Houses without a mortgage: 260
Median household income for houses/condos with a mortgage: $103,969
Median household income for apartments without a mortgage: $80,741
Median monthly housing costs: $1,106
Data:
Median house or condo value ($)
Median house or condo value ($ change since 2000)
Median house or condo value ($) - White
Median house or condo value ($) - Black or African American
Median house or condo value ($) - Asian
Median house or condo value ($) - Hispanic or Latino
Median house or condo value ($) - American Indian and Alaska Native
Median house or condo value ($) - Multirace
Median house or condo value ($) - Other Race
Median price asked for mobile homes ($)
Household density (households per square mile)
Mean house or condo value by units in structure - 1, detached ($)
Mean house or condo value by units in structure - 1, attached ($)
Mean house or condo value by units in structure - 2 ($)
Mean house or condo value by units in structure by units in structure - 3 or 4 ($)
Mean house or condo value by units in structure - 5 or more ($)
Mean house or condo value by units in structure - Boat, RV, van, etc. ($)
Mean house or condo value by units in structure - Mobile home ($)
Median contract rent ($)
Median contract rent - Lower quartile ($)
Median contract rent - Upper quartile ($)
Median gross rent ($)
Urban houses (%)
Rural houses (%)
Houses occupied (%)
Houses occupied (% change since 2000)
Houses owner occupied (%)
Houses owner occupied (% change since 2000)
Houses renter occupied (%)
Houses renter occupied (% change since 2000)
Vacant housing units - For rent (%)
Vacant housing units - For rent (% change since 2000)
Vacant housing units - For sale only (%)
Vacant housing units - For sale only (% change since 2000)
Vacant housing units - Rented or sold, not occupied (%)
Vacant housing units - Rented or sold, not occupied (% change since 2000)
Vacant housing units - For seasonal, recreational, or occasional use (%)
Vacant housing units - For seasonal, recreational, or occasional use (% change since 2000)
Vacant housing units - For migrant workers (%)
Vacant housing units - For migrant workers (% change since 2000)
Vacant housing units - Other vacant (%)
Vacant housing units - Other vacant (% change since 2000)
Median monthly housing costs ($)
Median household income for houses/condos with a mortgage ($)
Median household income for houses/condos without a mortgage ($)
Median household income ($)
Median household income ($) - White
Median household income ($) - Black or African American
Median household income ($) - Asian
Median household income ($) - Hispanic or Latino
Median household income ($) - American Indian and Alaska Native
Median household income ($) - Multirace
Median household income ($) - Other Race
Mortgage status - with mortgage (%)
Mortgage status - with second mortgage (%)
Mortgage status - with home equity loan (%)
Mortgage status - with both second mortgage and home equity loan (%)
Mortgage status - without a mortgage (%)
Median year house/condo built
Median year apartment built
Household type by relationship - Male householder living alone (%)
Household type by relationship - Male householder not living alone (%)
Household type by relationship - Female householder living alone (%)
Household type by relationship - Female householder not living alone (%)
Household type by relationship - Opposite-Sex spouse (%)
Household type by relationship - Same-Sex spouse (%)
Household type by relationship - Opposite-Sex unmarried partner (%)
Household type by relationship - Same-Sex unmarried partner (%)
Household type by relationship - In group quarters (%)
Size of family households - 2-person household (%)
Size of family households - 3-person household (%)
Size of family households - 4-person household (%)
Size of family households - 5-person household (%)
Size of family households - 6-person household (%)
Size of family households - 7-or-more-person household (%)
Size of nonfamily households - 1-person household (%)
Size of nonfamily households - 2-person household (%)
Size of nonfamily households - 3-person household (%)
Size of nonfamily households - 4-person household (%)
Size of nonfamily households - 5-person household (%)
Size of nonfamily households - 6-person household (%)
Size of nonfamily households - 7-or-moreperson household (%)
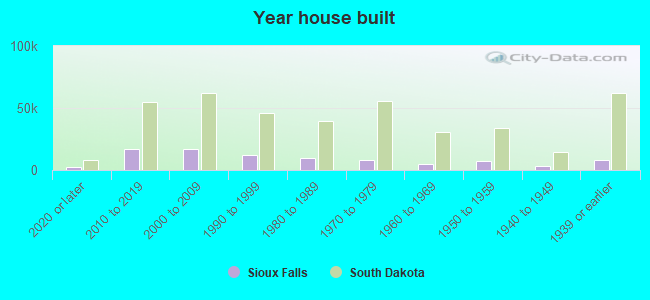
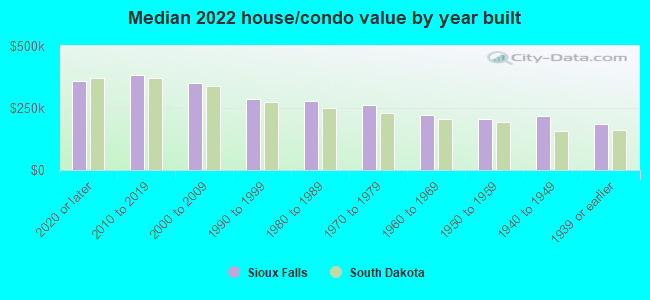
Year house built - Built 2010 or later (%)
Year house built - Built 2000 to 2009 (%)
Year house built - Built 1990 to 1999 (%)
Year house built - Built 1980 to 1989 (%)
Year house built - Built 1970 to 1979 (%)
Year house built - Built 1960 to 1969 (%)
Year house built - Built 1950 to 1959 (%)
Year house built - Built 1940 to 1949 (%)
Year house built - Built 1939 or earlier (%)
Median number of rooms in houses and condos
Median number of rooms in apartments
Median number of bedrooms in owner occupied houses
Mean number of bedrooms in owner occupied houses
Median number of bedrooms in renter occupied houses
Mean number of bedrooms in renter occupied houses
Median number of vehichles in owner occupied houses
Mean number of vehichles in owner occupied houses
Median number of vehichles in renter occupied houses
Mean number of vehichles in renter occupied houses
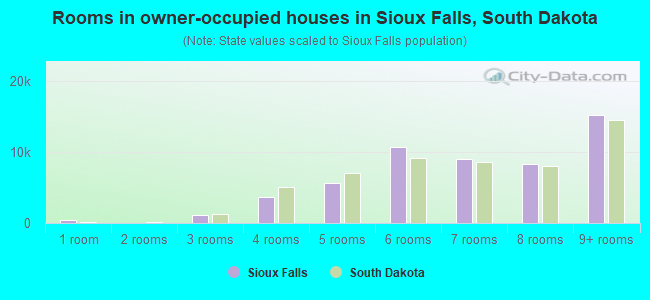
Rooms in owner-occupied houses - 1 room (%)
Rooms in owner-occupied houses - 2 rooms (%)
Rooms in owner-occupied houses - 3 rooms (%)
Rooms in owner-occupied houses - 4 rooms (%)
Rooms in owner-occupied houses - 5 rooms (%)
Rooms in owner-occupied houses - 6 rooms (%)
Rooms in owner-occupied houses - 7 rooms (%)
Rooms in owner-occupied houses - 8 rooms (%)
Rooms in owner-occupied houses - 9+ rooms (%)
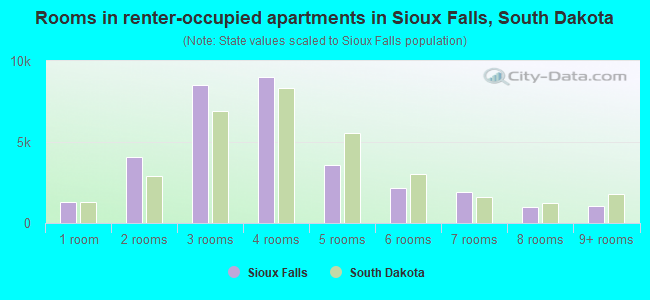
Rooms in renter-occupied houses - 1 room (%)
Rooms in renter-occupied houses - 2 rooms (%)
Rooms in renter-occupied houses - 3 rooms (%)
Rooms in renter-occupied houses - 4 rooms (%)
Rooms in renter-occupied houses - 5 rooms (%)
Rooms in renter-occupied houses - 6 rooms (%)
Rooms in renter-occupied houses - 7 rooms (%)
Rooms in renter-occupied houses - 8 rooms (%)
Rooms in renter-occupied houses - 9+ rooms (%)
Bedrooms in owner-occupied houses - no bedrooms (%)
Bedrooms in owner-occupied houses - 1 bedroom (%)
Bedrooms in owner-occupied houses - 2 bedrooms (%)
Bedrooms in owner-occupied houses - 3 bedrooms (%)
Bedrooms in owner-occupied houses - 4 bedrooms (%)
Bedrooms in owner-occupied houses - 5+ bedrooms (%)
Bedrooms in renter-occupied houses - no bedrooms (%)
Bedrooms in renter-occupied houses - 1 bedroom (%)
Bedrooms in renter-occupied houses - 2 bedrooms (%)
Bedrooms in renter-occupied houses - 3 bedrooms (%)
Bedrooms in renter-occupied houses - 4 bedrooms (%)
Bedrooms in renter-occupied houses - 5+ bedrooms (%)
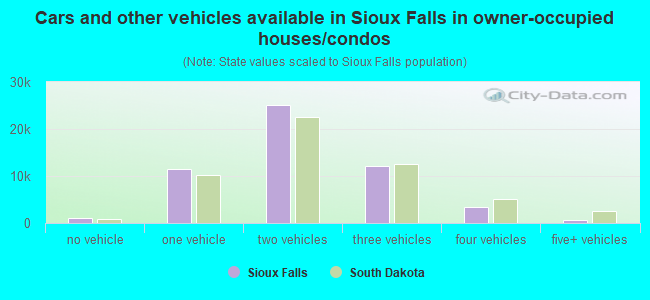
Vehicles available in owner-occupied houses - no vehicle available (%)
Vehicles available in owner-occupied houses - 1 vehicle available(%)
Vehicles available in owner-occupied houses - 2 Vehicles available (%)
Vehicles available in owner-occupied houses - 3 Vehicles available (%)
Vehicles available in owner-occupied houses - 4 Vehicles available (%)
Vehicles available in owner-occupied houses - 5+ Vehicles available (%)
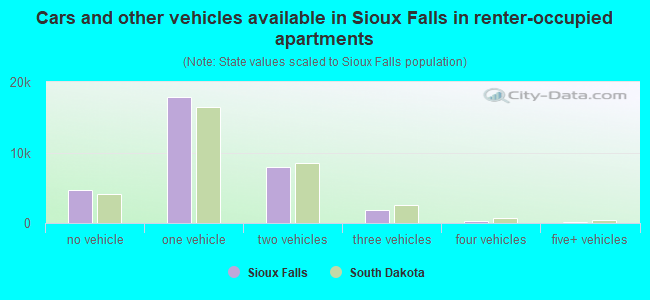
Vehicles available in renter-occupied houses - no vehicle available (%)
Vehicles available in renter-occupied houses - 1 vehicle available (%)
Vehicles available in renter-occupied houses - 2 Vehicles available (%)
Vehicles available in renter-occupied houses - 3 Vehicles available (%)
Vehicles available in renter-occupied houses - 4 Vehicles available (%)
Vehicles available in renter-occupied houses - 5+ Vehicles available (%)
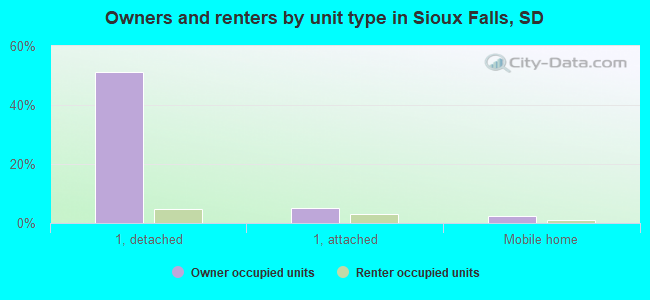
Housing units in structures - 1, detached (%)
Housing units in structures - 1, attached (%)
Housing units in structures - 2 (%)
Housing units in structures - 3 or 4 (%)
Housing units in structures - 5 to 9 (%)
Housing units in structures - 10 to 19 (%)
Housing units in structures - 20 to 49 (%)
Housing units in structures - 50 or more (%)
Housing units in structures - Mobile home (%)
Housing units in structures - Boat, RV, van, etc. (%)
Housing units in structures - Owners - 1, detached (%)
Housing units in structures - Owners - 1, attached (%)
Housing units in structures - Owners - 2 (%)
Housing units in structures - Owners - 3 or 4 (%)
Housing units in structures - Owners - 5 to 9 (%)
Housing units in structures - Owners - 10 to 19 (%)
Housing units in structures - Owners - 20 to 49 (%)
Housing units in structures - Owners - 50 or more (%)
Housing units in structures - Owners - Mobile home (%)
Housing units in structures - Owners - Boat, RV, van, etc. (%)
Housing units in structures - Renters - 1, detached (%)
Housing units in structures - Renters - 1, attached (%)
Housing units in structures - Renters - 2 (%)
Housing units in structures - Renters - 3 or 4 (%)
Housing units in structures - Renters - 5 to 9 (%)
Housing units in structures - Renters - 10 to 19 (%)
Housing units in structures - Renters - 20 to 49 (%)
Housing units in structures - Renters - 50 or more (%)
Housing units in structures - Renters - Mobile home (%)
Housing units in structures - Renters - Boat, RV, van, etc. (%)
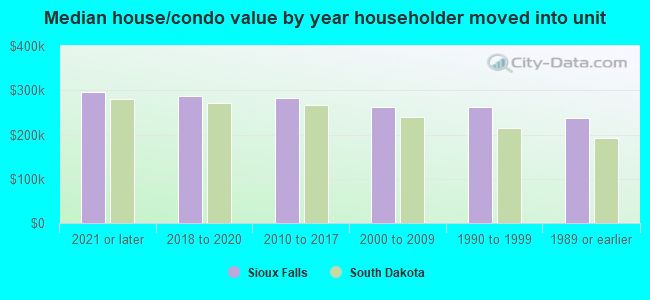
House/condo owner moved in on average (years ago)
Renter moved in on average (years ago)
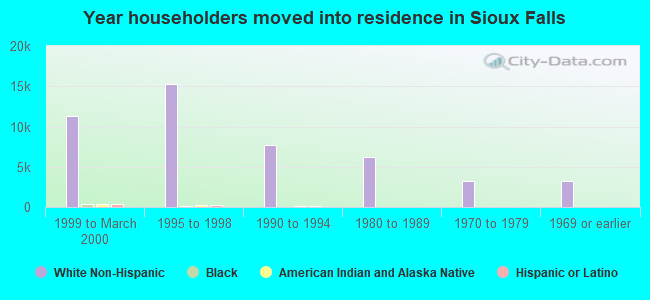
Year householder moved into unit - Moved in 1999 to March 2000 (%)
Year householder moved into unit - Moved in 1999 to March 2000 (%) - White
Year householder moved into unit - Moved in 1999 to March 2000 (%) - Black or African American
Year householder moved into unit - Moved in 1999 to March 2000 (%) - Asian
Year householder moved into unit - Moved in 1999 to March 2000 (%) - Hispanic or Latino
Year householder moved into unit - Moved in 1999 to March 2000 (%) - American Indian and Alaska Native
Year householder moved into unit - Moved in 1999 to March 2000 (%) - Multirace
Year householder moved into unit - Moved in 1999 to March 2000 (%) - Other Race
Year householder moved into unit - Moved in 1995 to 1998 (%)
Year householder moved into unit - Moved in 1995 to 1998 (%) - White
Year householder moved into unit - Moved in 1995 to 1998 (%) - Black or African American
Year householder moved into unit - Moved in 1995 to 1998 (%) - Asian
Year householder moved into unit - Moved in 1995 to 1998 (%) - Hispanic or Latino
Year householder moved into unit - Moved in 1995 to 1998 (%) - American Indian and Alaska Native
Year householder moved into unit - Moved in 1995 to 1998 (%) - Multirace
Year householder moved into unit - Moved in 1995 to 1998 (%) - Other Race
Year householder moved into unit - Moved in 1990 to 1994 (%)
Year householder moved into unit - Moved in 1990 to 1994 (%) - White
Year householder moved into unit - Moved in 1990 to 1994 (%) - Black or African American
Year householder moved into unit - Moved in 1990 to 1994 (%) - Asian
Year householder moved into unit - Moved in 1990 to 1994 (%) - Hispanic or Latino
Year householder moved into unit - Moved in 1990 to 1994 (%) - American Indian and Alaska Native
Year householder moved into unit - Moved in 1990 to 1994 (%) - Multirace
Year householder moved into unit - Moved in 1990 to 1994 (%) - Other Race
Year householder moved into unit - Moved in 1980 to 1989 (%)
Year householder moved into unit - Moved in 1980 to 1989 (%) - White
Year householder moved into unit - Moved in 1980 to 1989 (%) - Black or African American
Year householder moved into unit - Moved in 1980 to 1989 (%) - Asian
Year householder moved into unit - Moved in 1980 to 1989 (%) - Hispanic or Latino
Year householder moved into unit - Moved in 1980 to 1989 (%) - American Indian and Alaska Native
Year householder moved into unit - Moved in 1980 to 1989 (%) - Multirace
Year householder moved into unit - Moved in 1980 to 1989 (%) - Other Race
Year householder moved into unit - Moved in 1970 to 1979 (%)
Year householder moved into unit - Moved in 1970 to 1979 (%) - White
Year householder moved into unit - Moved in 1970 to 1979 (%) - Black or African American
Year householder moved into unit - Moved in 1970 to 1979 (%) - Asian
Year householder moved into unit - Moved in 1970 to 1979 (%) - Hispanic or Latino
Year householder moved into unit - Moved in 1970 to 1979 (%) - American Indian and Alaska Native
Year householder moved into unit - Moved in 1970 to 1979 (%) - Multirace
Year householder moved into unit - Moved in 1970 to 1979 (%) - Other Race
Year householder moved into unit - Moved in 1969 or earlier (%)
Year householder moved into unit - Moved in 1969 or earlier (%) - White
Year householder moved into unit - Moved in 1969 or earlier (%) - Black or African American
Year householder moved into unit - Moved in 1969 or earlier (%) - Asian
Year householder moved into unit - Moved in 1969 or earlier (%) - Hispanic or Latino
Year householder moved into unit - Moved in 1969 or earlier (%) - American Indian and Alaska Native
Year householder moved into unit - Moved in 1969 or earlier (%) - Multirace
Year householder moved into unit - Moved in 1969 or earlier (%) - Other Race
Housing units lacking complete plumbing facilities (%)
Housing units lacking complete kitchen facilities (%)
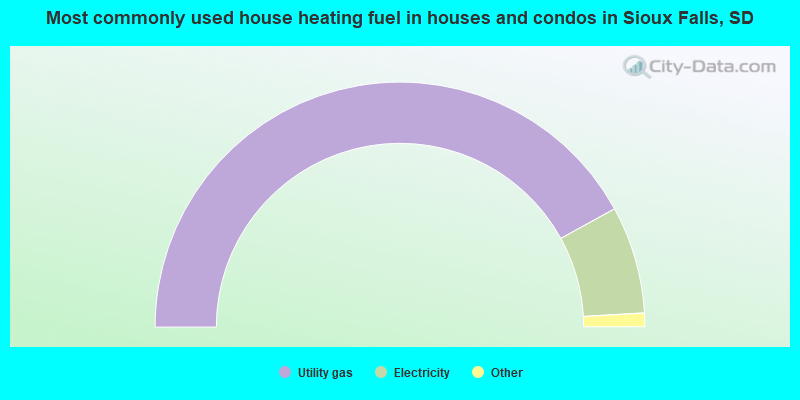
House heating fuel used in houses and condos - Utility gas (%)
House heating fuel used in houses and condos - Bottled, tank, or LP gas (%)
House heating fuel used in houses and condos - Electricity (%)
House heating fuel used in houses and condos - Fuel oil, kerosene, etc. (%)
House heating fuel used in houses and condos - Coal or coke (%)
House heating fuel used in houses and condos - Wood (%)
House heating fuel used in houses and condos - Solar energy (%)
House heating fuel used in houses and condos - Other fuel (%)
House heating fuel used in houses and condos - No fuel used (%)
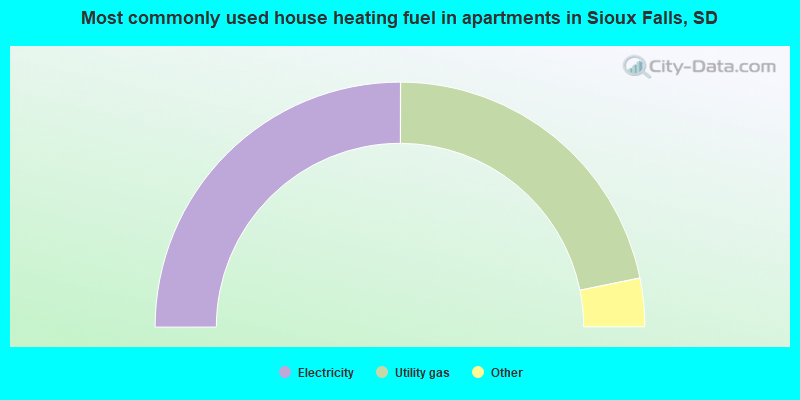
House heating fuel used in apartments - Utility gas (%)
House heating fuel used in apartments - Bottled, tank, or LP gas (%)
House heating fuel used in apartments - Electricity (%)
House heating fuel used in apartments - Fuel oil, kerosene, etc. (%)
House heating fuel used in apartments - Coal or coke (%)
House heating fuel used in apartments - Wood (%)
House heating fuel used in apartments - Solar energy (%)
House heating fuel used in apartments - Other fuel (%)
House heating fuel used in apartments - No fuel used (%)
Median year house/condo built: 1993Median year apartment built: 1995Household type by relationship:
Households: 202,090
Male householders: 44,364 (12,524 living alone ), Female householders: 42,201 (18,017 living alone )38,530 spouses (38,157 opposite-sex spouses ), 7,200 unmarried partners , (6,937 opposite-sex unmarried partners ), 54,553 children (51,020 natural , 803 adopted , 2,730 stepchildren ), 1,488 grandchildren , 1,000 brothers or sisters , 1,624 parents , 51 foster children , 2,007 other relatives , 4,790 non-relatives In group quarters: 4,282
Size of family households: 21,266 2-persons , 9,224 3-persons , 8,435 4-persons , 5,924 5-persons , 1,546 6-persons , 1,664 7-or-more-persons .
Size of nonfamily households: 30,541 1-person , 6,889 2-persons , 819 3-persons , 87 4-persons , 170 5-persons .
33,386 married couples with children. single-parent households (4,569 men , 8,061 women ).
88.4% of residents of Sioux Falls speak English at home. of residents speak Spanish at home (62% speak English very well , 19% speak English well , 17% speak English not well , 3% don't speak English at all ).of residents speak other Indo-European language at home (75% speak English very well , 17% speak English well , 7% speak English not well , 1% don't speak English at all ).of residents speak Asian or Pacific Island language at home (55% speak English very well , 29% speak English well , 11% speak English not well , 5% don't speak English at all ).of residents speak other language at home (73% speak English very well , 20% speak English well , 5% speak English not well , 3% don't speak English at all ).
Foreign born population: 15,041 (7.4%)of them are naturalized citizens )
Median number of rooms in houses and condos:
Median number of rooms in apartments
Owner-occupied Renter-occupied
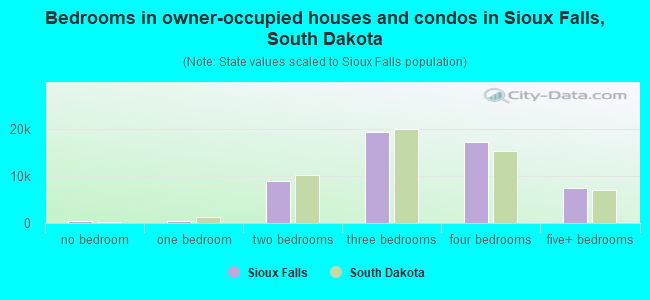
Bedrooms in owner-occupied houses and condos in Sioux Falls, South Dakota
462 no bedroom 446 1 bedroom 8,830 2 bedrooms 19,410 3 bedrooms 17,244 4 bedrooms 7,521 5+ bedrooms
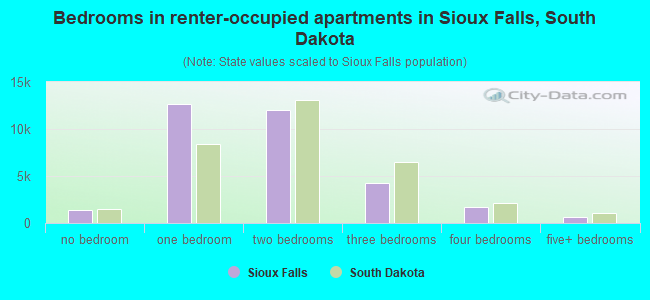
Bedrooms in renter-occupied apartments in Sioux Falls, South Dakota
1,425 no bedroom 12,607 1 bedroom 12,015 2 bedrooms 4,214 3 bedrooms 1,724 4 bedrooms 667 5+ bedrooms
Owner-occupied Renter-occupied
Rooms in owner-occupied houses in Sioux Falls, South Dakota
462 1 room 0 2 rooms 1,067 3 rooms 3,631 4 rooms 5,629 5 rooms 10,668 6 rooms 9,013 7 rooms 8,273 8 rooms 15,170 9+ rooms
Rooms in renter-occupied apartments in Sioux Falls, South Dakota
1,311 1 room 4,088 2 rooms 8,528 3 rooms 9,024 4 rooms 3,562 5 rooms 2,168 6 rooms 1,918 7 rooms 1,003 8 rooms 1,050 9+ rooms
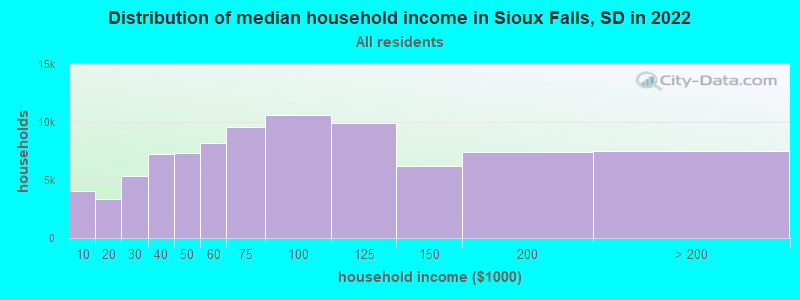
Sioux Falls, SD household income distribution 4,020 Less than $10,0003,355 $10,000 to $19,9995,338 $20,000 to $29,9997,205 $30,000 to $39,9997,291 $40,000 to $49,9998,190 $50,000 to $59,9999,604 $60,000 to $74,99910,627 $75,000 to $99,9999,875 $100,000 to $124,9996,168 $125,000 to $149,9997,371 $150,000 to $199,9997,521 $200,000 or more
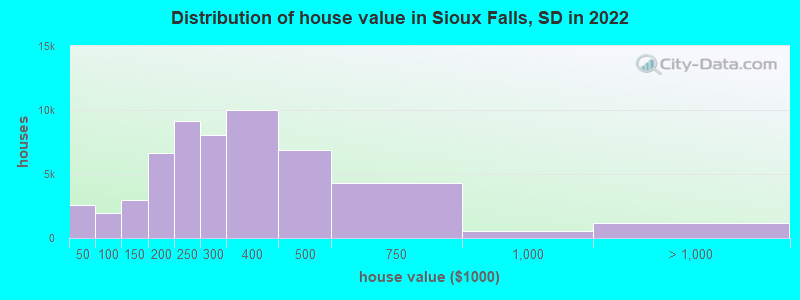
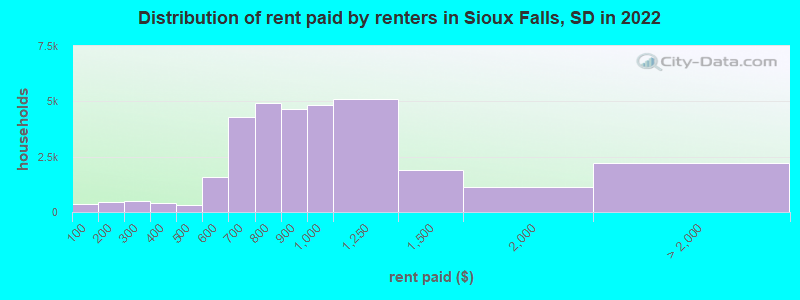
Home value of owner - occupied houses in 2022 in Sioux Falls, SD 269 Less than $10,000166 $10,000 to $14,999491 $15,000 to $19,999541 $20,000 to $24,999214 $25,000 to $29,999394 $30,000 to $34,999161 $35,000 to $39,999319 $40,000 to $49,99950 $50,000 to $59,999350 $60,000 to $69,999348 $70,000 to $79,999496 $80,000 to $89,999426 $90,000 to $99,9991,312 $100,000 to $124,9991,631 $125,000 to $149,9993,986 $150,000 to $174,9992,678 $175,000 to $199,9999,178 $200,000 to $249,9998,018 $250,000 to $299,99910,015 $300,000 to $399,9996,867 $400,000 to $499,9994,264 $500,000 to $749,999578 $750,000 to $999,999518 $1,000,000 to $1,499,999643 $2,000,000 or moreRent paid by renters in 2022 in Sioux Falls, SD 344 Less than $100248 $100 to $149225 $150 to $199324 $200 to $249186 $250 to $29924 $300 to $349367 $350 to $399181 $400 to $449137 $450 to $499783 $500 to $549780 $550 to $5991,975 $600 to $6492,335 $650 to $6992,710 $700 to $7492,212 $750 to $7994,669 $800 to $8994,812 $900 to $9995,121 $1,000 to $1,2491,881 $1,250 to $1,4991,146 $1,500 to $1,999513 $2,000 to $2,499110 $2,500 to $2,999208 $3,000 to $3,499572 $3,500 or more789 No cash rent
Percentage of workers working in this county: 79.1%Number of people working at home: 13,282 (11.7% of all workers )
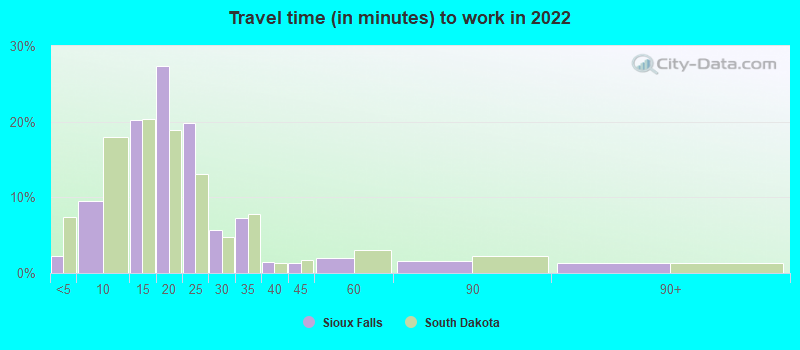
Travel time to work (commute)
Less than 5 minutes: 2,1495 to 9 minutes: 10,64610 to 14 minutes: 23,68915 to 19 minutes: 31,77720 to 24 minutes: 20,02025 to 29 minutes: 4,01330 to 34 minutes: 4,37435 to 39 minutes: 9940 to 44 minutes: 55045 to 59 minutes: 87960 to 89 minutes: 1,22690 or more minutes: 1,106
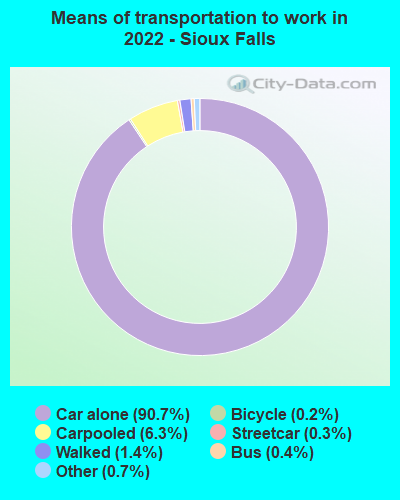
Means of transportation to work:
Drove a car alone: 108,272 (81.6%)Carpooled: 7,517 (5.7%)Bus : 448 (0.3%)Subway or elevated rail : 333 (0.3%)Taxi: 869 (0.7%)Bicycle: 211 (0.2%)Walked: 1,730 (1.3%)Worked at home: 13,282 (10.0%)
Unemployment by race in 2022
Unemployment rate for White non-Hispanic residents 1.8% Males0.7% FemalesUnemployment rate for Black residents 2.8% Males0.8% FemalesUnemployment rate for American Indian and Alaska Native residents 20.3% Males20.3% FemalesUnemployment rate for Asian residents 2.8% Males10.6% FemalesUnemployment rate for other race residents 2.7% Males7.2% FemalesUnemployment rate for two or more race residents 3.2% Males5.6% FemalesUnemployment rate for Hispanic or Latino residents 5.1% Males5.1% Females
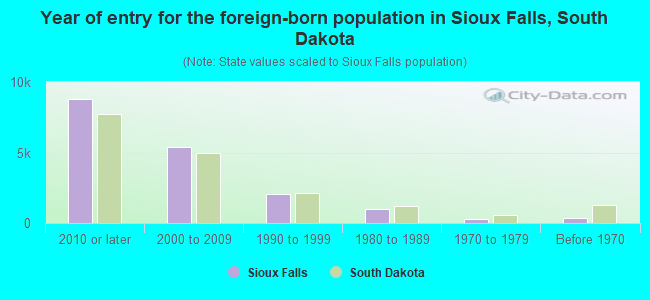
Year of entry for the foreign-born population in Sioux Falls, South Dakota
8,780 2010 or later 5,399 2000 to 2009 2,059 1990 to 1999 996 1980 to 1989 284 1970 to 1979 356 Before 1970
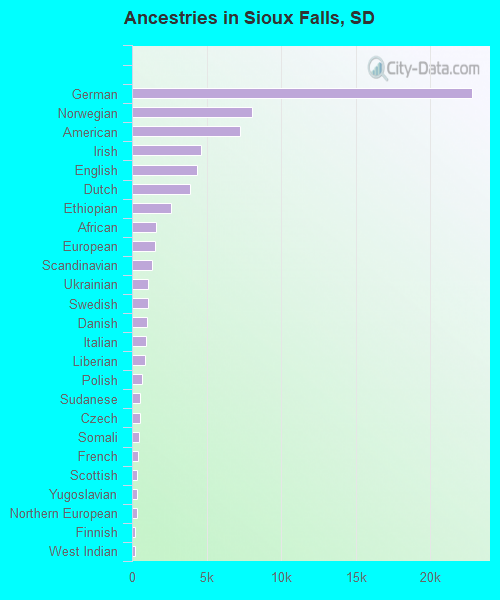
First ancestries reported:
German: 22,796 (25.6%)
Norwegian: 8,061 (9.1%)
American: 7,230 (8.1%)
Irish: 4,622 (5.2%)
English: 4,366 (4.9%)
Dutch: 3,879 (4.4%)
Ethiopian: 2,627 (3.0%)
African: 1,601 (1.8%)
European: 1,560 (1.8%)
Scandinavian: 1,345 (1.5%)
Ukrainian: 1,102 (1.2%)
Swedish: 1,082 (1.2%)
Danish: 1,005 (1.1%)
Italian: 920 (1.0%)
Liberian: 873 (1.0%)
Polish: 683 (0.8%)
Sudanese: 552 (0.6%)
Czech: 522 (0.6%)
Somali: 455 (0.5%)
French: 433 (0.5%)
Scottish: 345 (0.4%)
Yugoslavian: 341 (0.4%)
Northern European: 330 (0.4%)
Finnish: 221 (0.2%)
West Indian: 213 (0.2%)
Afghan: 183 (0.2%)
Russian: 168 (0.2%)
Greek: 153 (0.2%)
Serbian: 126 (0.1%)
Albanian: 118 (0.1%)
Austrian: 110 (0.1%)
Lebanese: 104 (0.1%)
Belgian: 92 (0.1%)
French Canadian: 85 (0.10%)
Iraqi: 84 (0.09%)
Swiss: 72 (0.08%)
Eastern European: 55 (0.06%)
Scotch-Irish: 54 (0.06%)
British: 51 (0.06%)
Welsh: 51 (0.06%)
Czechoslovakian: 47 (0.05%)
Celtic: 47 (0.05%)
Croatian: 42 (0.05%)
Portuguese: 42 (0.05%)
Egyptian: 34 (0.04%)
Canadian: 33 (0.04%)
Pennsylvania German: 31 (0.03%)
Arab: 30 (0.03%)
Hungarian: 30 (0.03%)
Nigerian: 28 (0.03%)
Haitian: 24 (0.03%)
Slovak: 24 (0.03%)
Luxembourger: 22 (0.02%)
Jamaican: 18 (0.02%)
Armenian: 17 (0.02%)
Palestinian: 15 (0.02%)
Iranian: 15 (0.02%)
Basque: 13 (0.01%)
German Russian: 11 (0.01%)
Jordanian: 10 (0.01%)
Maltese: 10 (0.01%)
Ugandan: 9 (0.01%)
Cypriot: 7 (0.01%)
Most common places of birth for foreign-born residents (%): Ethiopia Sioux Falls:
13.3% (2,271)South Dakota:
7.4% (2,512)
Guatemala Sioux Falls:
7.3% (1,254)South Dakota:
7.1% (2,433)
Ukraine Sioux Falls:
7.2% (1,231)South Dakota:
3.6% (1,237)
Nepal Sioux Falls:
6.3% (1,071)South Dakota:
3.5% (1,180)
El Salvador Sioux Falls:
5.9% (1,002)South Dakota:
3.9% (1,337)
Mexico Sioux Falls:
5.7% (979)South Dakota:
10.7% (3,642)
Liberia Sioux Falls:
5.4% (921)South Dakota:
2.9% (978)
Eritrea Sioux Falls:
4.9% (833)South Dakota:
2.9% (975)
India Sioux Falls:
4.8% (822)South Dakota:
4.0% (1,373)
Democratic Republic of Congo (Zaire) Sioux Falls:
3.9% (659)South Dakota:
2.0% (672)
Other Eastern Africa Sioux Falls:
3.3% (558)South Dakota:
1.7% (579)
Congo Sioux Falls:
2.9% (493)South Dakota:
1.2% (405)
Bhutan Sioux Falls:
2.2% (378)South Dakota:
1.2% (417)
Korea Sioux Falls:
2.0% (340)South Dakota:
2.6% (896)
Sudan Sioux Falls:
1.5% (259)South Dakota:
0.8% (257)
Canada Sioux Falls:
1.5% (258)South Dakota:
3.3% (1,125)
Place of birth for U.S.-born residents:
This state: 114,448Other state: 71,266Northeast: 4,214Midwest: 47,219South: 8,379West: 11,454 82.9% of Sioux Falls residents lived in the same house 1 years ago.
Out of people who lived in different houses, 33.1% lived in this county.
Out of people who lived in different counties, 44.6% lived in South Dakota.
Sioux Falls:
82.9%State average:
86.6%
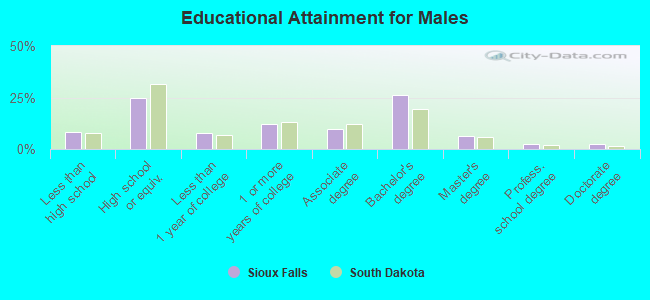
Education attainment for males 25 years and older:
No schooling: 1,734Nursery to 4th grade: 795th and 6th grade: 857th and 8th grade: 4869th grade: 14010th grade: 1,20311th grade: 79312th grade, no diploma: 1,069High school graduate (or equivalency): 16,521Less than 1 year of college: 5,292Some college more than 1 year, no degree: 8,123Associate degree: 6,581Bachelor's degree: 17,568Master's degree: 4,380Professional school degree: 1,559Doctorate degree: 1,574
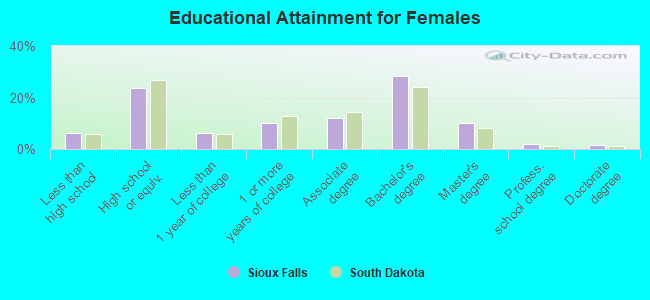
Education attainment for females 25 years and older:
No schooling: 1,311Nursery to 4th grade: 845th and 6th grade: 6307th and 8th grade: 3729th grade: 910th grade: 37311th grade: 57412th grade, no diploma: 940High school graduate (or equivalency): 16,059Less than 1 year of college: 4,224Some college more than 1 year, no degree: 6,929Associate degree: 8,160Bachelor's degree: 19,184Master's degree: 6,770Professional school degree: 1,252Doctorate degree: 919
Housing units in structures:
One, detached: 49,871One, attached: 7,301Two: 1,2073 or 4: 2,4035 to 9: 4,30410 to 19: 6,09820 to 49: 8,53150 or more: 6,805Mobile homes: 2,886Boats, RVs, vans, etc.: 122Median worth of mobile homes: $32,500
Housing units lacking complete plumbing facilities in 2022: 0.2%Housing units lacking complete kitchen facilities in 2022: 0.4%House/condo owner moved in on average 8 years ago
Renter moved in on average 1 years ago
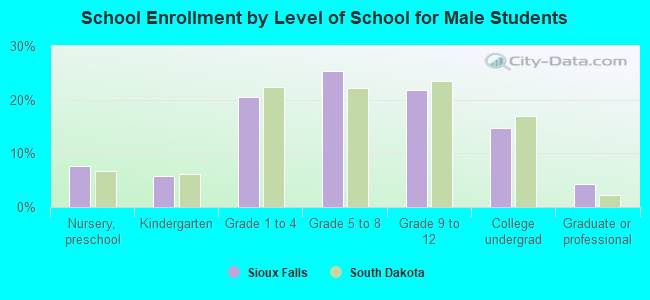
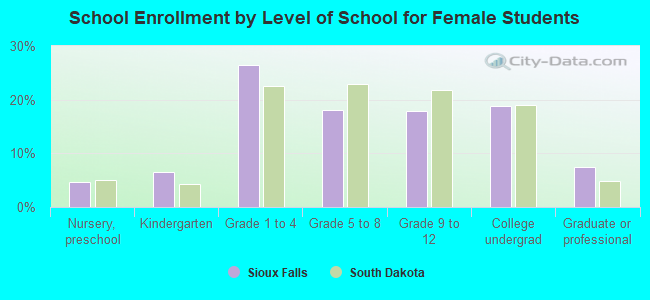
Private vs. public school enrollment:
Students in private schools in grades 1 to 8 (elementary and middle school): 3,796 Here:
17.7%South Dakota:
11.9%
Students in private schools in grades 9 to 12 (high school): 816 Here:
8.6%South Dakota:
7.2%
Students in private undergraduate colleges: 1,222 Here:
15.4%South Dakota:
10.2%