South Bradenton, FL (Florida) Houses and Residents
Estimated median house or condo value in 2022: $160,190 (it was $56,800 in 2000 )
South Bradenton:
$160,190Florida:
$354,100
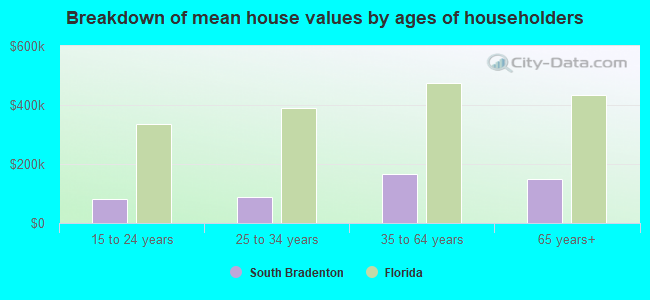
Lower value quartile - upper value quartile: $86,327 - $287,622Mean price in 2022: Detached houses: $265,656 Here:
$265,656State:
$500,941
Townhouses or other attached units: $228,098 Here:
$228,098State:
$370,869
In 2-unit structures: $230,950 Here:
$230,950State:
$423,188
In 3-to-4-unit structures: $142,487 Here:
$142,487State:
$309,944
In 5-or-more-unit structures: $127,767 Here:
$127,767State:
$447,145
Mobile homes: $69,399 Here:
$69,399State:
$113,202
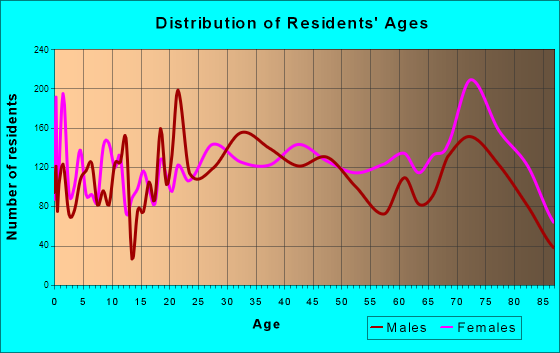
Total population: 22,178 (Urban population: 21,425, Rural population: 0)
Houses: 15,396 (11,596 occupied: 6,549 owner occupied, 5,424 renter occupied )
% of renters here:
45%State:
33%
Housing density: 3,452 houses/condos per square mile
Median price asked for vacant for-sale houses and condos in 2022: $220,673.
Median contract rent in 2022: $1,040 (lower quartile is $856, upper quartile is $1,301)
Median rent asked for vacant for-rent units in 2022: $1,399
Median gross rent in South Bradenton, FL in 2022: $1,206
Housing units in South Bradenton with a mortgage: 2,025 (345 second mortgage, 0 home equity loan, 296 both second mortgage and home equity loan )Houses without a mortgage: 11
Median household income for houses/condos with a mortgage: $76,988
Median household income for apartments without a mortgage: $39,839
Median monthly housing costs: $955
Data:
Median house or condo value ($)
Median house or condo value ($ change since 2000)
Median house or condo value ($) - White
Median house or condo value ($) - Black or African American
Median house or condo value ($) - Asian
Median house or condo value ($) - Hispanic or Latino
Median house or condo value ($) - American Indian and Alaska Native
Median house or condo value ($) - Multirace
Median house or condo value ($) - Other Race
Median price asked for mobile homes ($)
Household density (households per square mile)
Mean house or condo value by units in structure - 1, detached ($)
Mean house or condo value by units in structure - 1, attached ($)
Mean house or condo value by units in structure - 2 ($)
Mean house or condo value by units in structure by units in structure - 3 or 4 ($)
Mean house or condo value by units in structure - 5 or more ($)
Mean house or condo value by units in structure - Boat, RV, van, etc. ($)
Mean house or condo value by units in structure - Mobile home ($)
Median contract rent ($)
Median contract rent - Lower quartile ($)
Median contract rent - Upper quartile ($)
Median gross rent ($)
Urban houses (%)
Rural houses (%)
Houses occupied (%)
Houses occupied (% change since 2000)
Houses owner occupied (%)
Houses owner occupied (% change since 2000)
Houses renter occupied (%)
Houses renter occupied (% change since 2000)
Vacant housing units - For rent (%)
Vacant housing units - For rent (% change since 2000)
Vacant housing units - For sale only (%)
Vacant housing units - For sale only (% change since 2000)
Vacant housing units - Rented or sold, not occupied (%)
Vacant housing units - Rented or sold, not occupied (% change since 2000)
Vacant housing units - For seasonal, recreational, or occasional use (%)
Vacant housing units - For seasonal, recreational, or occasional use (% change since 2000)
Vacant housing units - For migrant workers (%)
Vacant housing units - For migrant workers (% change since 2000)
Vacant housing units - Other vacant (%)
Vacant housing units - Other vacant (% change since 2000)
Median monthly housing costs ($)
Median household income for houses/condos with a mortgage ($)
Median household income for houses/condos without a mortgage ($)
Median household income ($)
Median household income ($) - White
Median household income ($) - Black or African American
Median household income ($) - Asian
Median household income ($) - Hispanic or Latino
Median household income ($) - American Indian and Alaska Native
Median household income ($) - Multirace
Median household income ($) - Other Race
Mortgage status - with mortgage (%)
Mortgage status - with second mortgage (%)
Mortgage status - with home equity loan (%)
Mortgage status - with both second mortgage and home equity loan (%)
Mortgage status - without a mortgage (%)
Median year house/condo built
Median year apartment built
Household type by relationship - Male householder living alone (%)
Household type by relationship - Male householder not living alone (%)
Household type by relationship - Female householder living alone (%)
Household type by relationship - Female householder not living alone (%)
Household type by relationship - Opposite-Sex spouse (%)
Household type by relationship - Same-Sex spouse (%)
Household type by relationship - Opposite-Sex unmarried partner (%)
Household type by relationship - Same-Sex unmarried partner (%)
Household type by relationship - In group quarters (%)
Size of family households - 2-person household (%)
Size of family households - 3-person household (%)
Size of family households - 4-person household (%)
Size of family households - 5-person household (%)
Size of family households - 6-person household (%)
Size of family households - 7-or-more-person household (%)
Size of nonfamily households - 1-person household (%)
Size of nonfamily households - 2-person household (%)
Size of nonfamily households - 3-person household (%)
Size of nonfamily households - 4-person household (%)
Size of nonfamily households - 5-person household (%)
Size of nonfamily households - 6-person household (%)
Size of nonfamily households - 7-or-moreperson household (%)
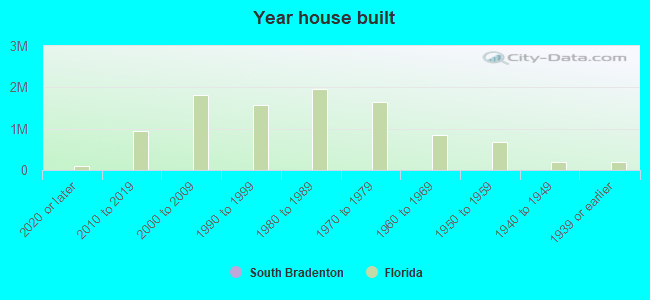
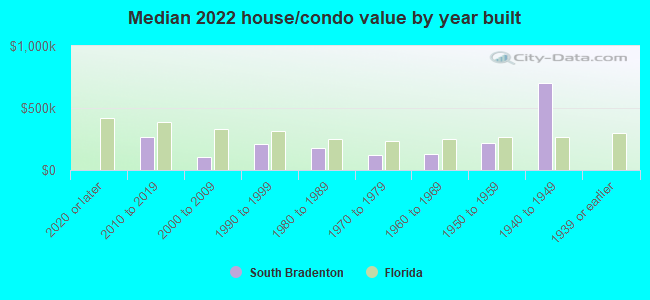
Year house built - Built 2010 or later (%)
Year house built - Built 2000 to 2009 (%)
Year house built - Built 1990 to 1999 (%)
Year house built - Built 1980 to 1989 (%)
Year house built - Built 1970 to 1979 (%)
Year house built - Built 1960 to 1969 (%)
Year house built - Built 1950 to 1959 (%)
Year house built - Built 1940 to 1949 (%)
Year house built - Built 1939 or earlier (%)
Median number of rooms in houses and condos
Median number of rooms in apartments
Median number of bedrooms in owner occupied houses
Mean number of bedrooms in owner occupied houses
Median number of bedrooms in renter occupied houses
Mean number of bedrooms in renter occupied houses
Median number of vehichles in owner occupied houses
Mean number of vehichles in owner occupied houses
Median number of vehichles in renter occupied houses
Mean number of vehichles in renter occupied houses
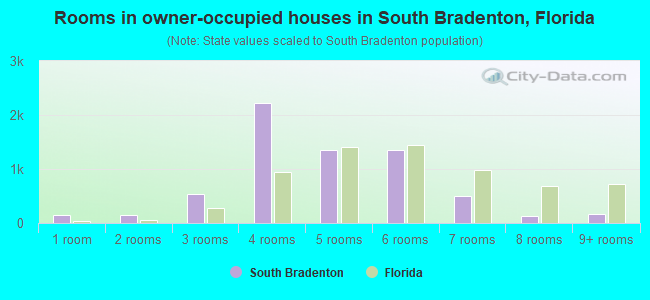
Rooms in owner-occupied houses - 1 room (%)
Rooms in owner-occupied houses - 2 rooms (%)
Rooms in owner-occupied houses - 3 rooms (%)
Rooms in owner-occupied houses - 4 rooms (%)
Rooms in owner-occupied houses - 5 rooms (%)
Rooms in owner-occupied houses - 6 rooms (%)
Rooms in owner-occupied houses - 7 rooms (%)
Rooms in owner-occupied houses - 8 rooms (%)
Rooms in owner-occupied houses - 9+ rooms (%)
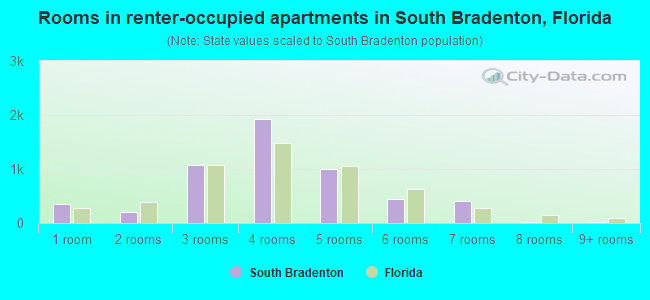
Rooms in renter-occupied houses - 1 room (%)
Rooms in renter-occupied houses - 2 rooms (%)
Rooms in renter-occupied houses - 3 rooms (%)
Rooms in renter-occupied houses - 4 rooms (%)
Rooms in renter-occupied houses - 5 rooms (%)
Rooms in renter-occupied houses - 6 rooms (%)
Rooms in renter-occupied houses - 7 rooms (%)
Rooms in renter-occupied houses - 8 rooms (%)
Rooms in renter-occupied houses - 9+ rooms (%)
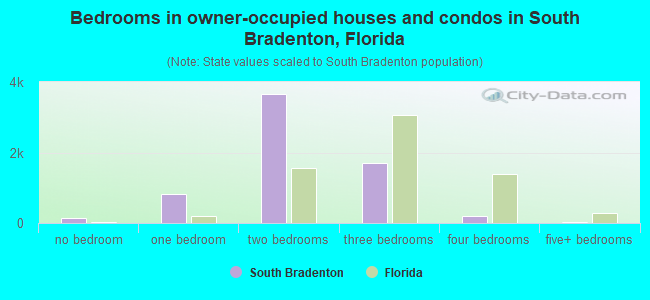
Bedrooms in owner-occupied houses - no bedrooms (%)
Bedrooms in owner-occupied houses - 1 bedroom (%)
Bedrooms in owner-occupied houses - 2 bedrooms (%)
Bedrooms in owner-occupied houses - 3 bedrooms (%)
Bedrooms in owner-occupied houses - 4 bedrooms (%)
Bedrooms in owner-occupied houses - 5+ bedrooms (%)
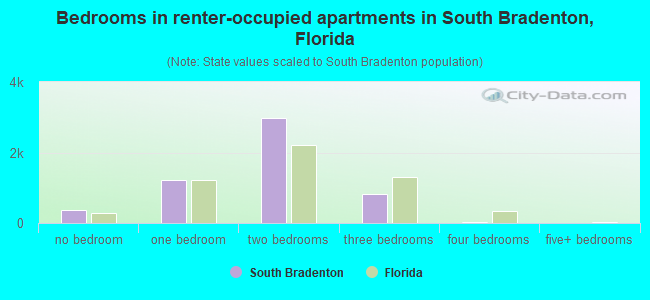
Bedrooms in renter-occupied houses - no bedrooms (%)
Bedrooms in renter-occupied houses - 1 bedroom (%)
Bedrooms in renter-occupied houses - 2 bedrooms (%)
Bedrooms in renter-occupied houses - 3 bedrooms (%)
Bedrooms in renter-occupied houses - 4 bedrooms (%)
Bedrooms in renter-occupied houses - 5+ bedrooms (%)
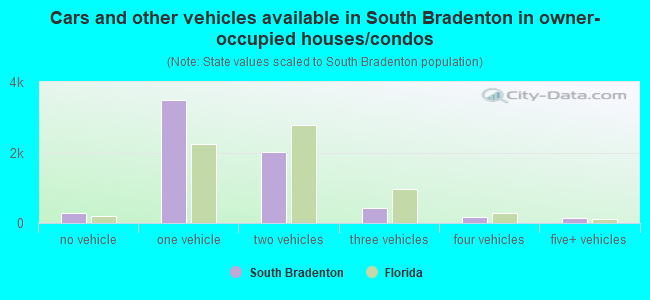
Vehicles available in owner-occupied houses - no vehicle available (%)
Vehicles available in owner-occupied houses - 1 vehicle available(%)
Vehicles available in owner-occupied houses - 2 Vehicles available (%)
Vehicles available in owner-occupied houses - 3 Vehicles available (%)
Vehicles available in owner-occupied houses - 4 Vehicles available (%)
Vehicles available in owner-occupied houses - 5+ Vehicles available (%)
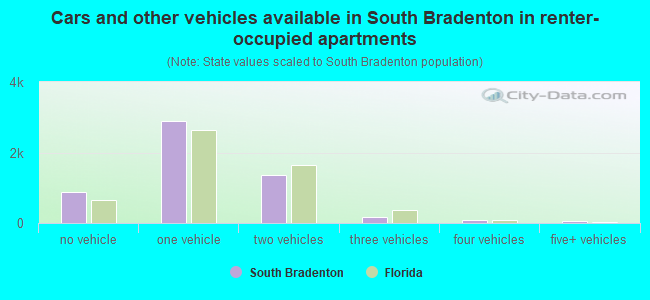
Vehicles available in renter-occupied houses - no vehicle available (%)
Vehicles available in renter-occupied houses - 1 vehicle available (%)
Vehicles available in renter-occupied houses - 2 Vehicles available (%)
Vehicles available in renter-occupied houses - 3 Vehicles available (%)
Vehicles available in renter-occupied houses - 4 Vehicles available (%)
Vehicles available in renter-occupied houses - 5+ Vehicles available (%)
Housing units in structures - 1, detached (%)
Housing units in structures - 1, attached (%)
Housing units in structures - 2 (%)
Housing units in structures - 3 or 4 (%)
Housing units in structures - 5 to 9 (%)
Housing units in structures - 10 to 19 (%)
Housing units in structures - 20 to 49 (%)
Housing units in structures - 50 or more (%)
Housing units in structures - Mobile home (%)
Housing units in structures - Boat, RV, van, etc. (%)
Housing units in structures - Owners - 1, detached (%)
Housing units in structures - Owners - 1, attached (%)
Housing units in structures - Owners - 2 (%)
Housing units in structures - Owners - 3 or 4 (%)
Housing units in structures - Owners - 5 to 9 (%)
Housing units in structures - Owners - 10 to 19 (%)
Housing units in structures - Owners - 20 to 49 (%)
Housing units in structures - Owners - 50 or more (%)
Housing units in structures - Owners - Mobile home (%)
Housing units in structures - Owners - Boat, RV, van, etc. (%)
Housing units in structures - Renters - 1, detached (%)
Housing units in structures - Renters - 1, attached (%)
Housing units in structures - Renters - 2 (%)
Housing units in structures - Renters - 3 or 4 (%)
Housing units in structures - Renters - 5 to 9 (%)
Housing units in structures - Renters - 10 to 19 (%)
Housing units in structures - Renters - 20 to 49 (%)
Housing units in structures - Renters - 50 or more (%)
Housing units in structures - Renters - Mobile home (%)
Housing units in structures - Renters - Boat, RV, van, etc. (%)
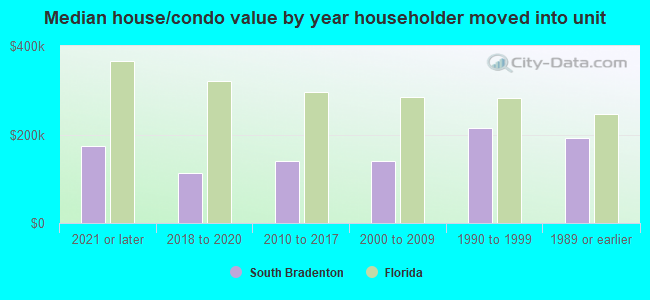
House/condo owner moved in on average (years ago)
Renter moved in on average (years ago)
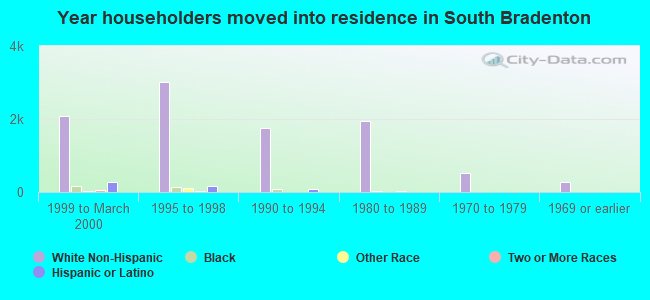
Year householder moved into unit - Moved in 1999 to March 2000 (%)
Year householder moved into unit - Moved in 1999 to March 2000 (%) - White
Year householder moved into unit - Moved in 1999 to March 2000 (%) - Black or African American
Year householder moved into unit - Moved in 1999 to March 2000 (%) - Asian
Year householder moved into unit - Moved in 1999 to March 2000 (%) - Hispanic or Latino
Year householder moved into unit - Moved in 1999 to March 2000 (%) - American Indian and Alaska Native
Year householder moved into unit - Moved in 1999 to March 2000 (%) - Multirace
Year householder moved into unit - Moved in 1999 to March 2000 (%) - Other Race
Year householder moved into unit - Moved in 1995 to 1998 (%)
Year householder moved into unit - Moved in 1995 to 1998 (%) - White
Year householder moved into unit - Moved in 1995 to 1998 (%) - Black or African American
Year householder moved into unit - Moved in 1995 to 1998 (%) - Asian
Year householder moved into unit - Moved in 1995 to 1998 (%) - Hispanic or Latino
Year householder moved into unit - Moved in 1995 to 1998 (%) - American Indian and Alaska Native
Year householder moved into unit - Moved in 1995 to 1998 (%) - Multirace
Year householder moved into unit - Moved in 1995 to 1998 (%) - Other Race
Year householder moved into unit - Moved in 1990 to 1994 (%)
Year householder moved into unit - Moved in 1990 to 1994 (%) - White
Year householder moved into unit - Moved in 1990 to 1994 (%) - Black or African American
Year householder moved into unit - Moved in 1990 to 1994 (%) - Asian
Year householder moved into unit - Moved in 1990 to 1994 (%) - Hispanic or Latino
Year householder moved into unit - Moved in 1990 to 1994 (%) - American Indian and Alaska Native
Year householder moved into unit - Moved in 1990 to 1994 (%) - Multirace
Year householder moved into unit - Moved in 1990 to 1994 (%) - Other Race
Year householder moved into unit - Moved in 1980 to 1989 (%)
Year householder moved into unit - Moved in 1980 to 1989 (%) - White
Year householder moved into unit - Moved in 1980 to 1989 (%) - Black or African American
Year householder moved into unit - Moved in 1980 to 1989 (%) - Asian
Year householder moved into unit - Moved in 1980 to 1989 (%) - Hispanic or Latino
Year householder moved into unit - Moved in 1980 to 1989 (%) - American Indian and Alaska Native
Year householder moved into unit - Moved in 1980 to 1989 (%) - Multirace
Year householder moved into unit - Moved in 1980 to 1989 (%) - Other Race
Year householder moved into unit - Moved in 1970 to 1979 (%)
Year householder moved into unit - Moved in 1970 to 1979 (%) - White
Year householder moved into unit - Moved in 1970 to 1979 (%) - Black or African American
Year householder moved into unit - Moved in 1970 to 1979 (%) - Asian
Year householder moved into unit - Moved in 1970 to 1979 (%) - Hispanic or Latino
Year householder moved into unit - Moved in 1970 to 1979 (%) - American Indian and Alaska Native
Year householder moved into unit - Moved in 1970 to 1979 (%) - Multirace
Year householder moved into unit - Moved in 1970 to 1979 (%) - Other Race
Year householder moved into unit - Moved in 1969 or earlier (%)
Year householder moved into unit - Moved in 1969 or earlier (%) - White
Year householder moved into unit - Moved in 1969 or earlier (%) - Black or African American
Year householder moved into unit - Moved in 1969 or earlier (%) - Asian
Year householder moved into unit - Moved in 1969 or earlier (%) - Hispanic or Latino
Year householder moved into unit - Moved in 1969 or earlier (%) - American Indian and Alaska Native
Year householder moved into unit - Moved in 1969 or earlier (%) - Multirace
Year householder moved into unit - Moved in 1969 or earlier (%) - Other Race
Housing units lacking complete plumbing facilities (%)
Housing units lacking complete kitchen facilities (%)
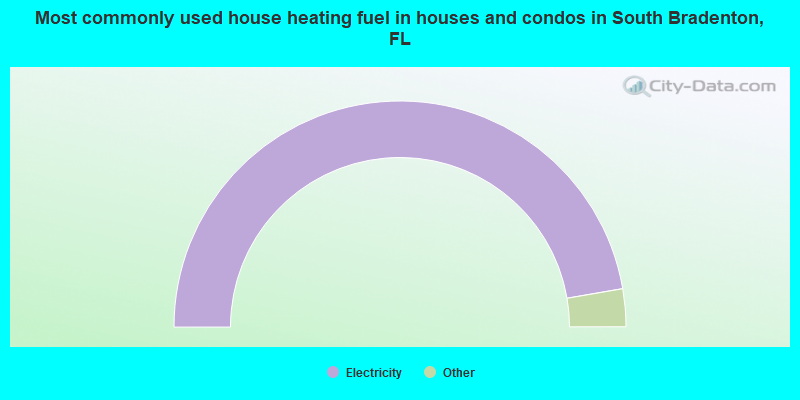
House heating fuel used in houses and condos - Utility gas (%)
House heating fuel used in houses and condos - Bottled, tank, or LP gas (%)
House heating fuel used in houses and condos - Electricity (%)
House heating fuel used in houses and condos - Fuel oil, kerosene, etc. (%)
House heating fuel used in houses and condos - Coal or coke (%)
House heating fuel used in houses and condos - Wood (%)
House heating fuel used in houses and condos - Solar energy (%)
House heating fuel used in houses and condos - Other fuel (%)
House heating fuel used in houses and condos - No fuel used (%)
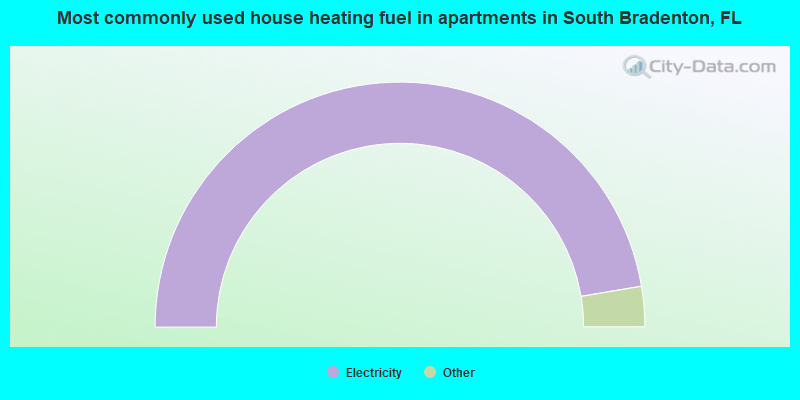
House heating fuel used in apartments - Utility gas (%)
House heating fuel used in apartments - Bottled, tank, or LP gas (%)
House heating fuel used in apartments - Electricity (%)
House heating fuel used in apartments - Fuel oil, kerosene, etc. (%)
House heating fuel used in apartments - Coal or coke (%)
House heating fuel used in apartments - Wood (%)
House heating fuel used in apartments - Solar energy (%)
House heating fuel used in apartments - Other fuel (%)
House heating fuel used in apartments - No fuel used (%)
Median year house/condo built: 1976Median year apartment built: 1977Household type by relationship:
Households: 26,983
Male householders: 6,044 (2,288 living alone ), Female householders: 5,555 (2,458 living alone )4,105 spouses (4,052 opposite-sex spouses ), 952 unmarried partners , (915 opposite-sex unmarried partners ), 6,076 children (5,644 natural , 52 adopted , 379 stepchildren ), 1,270 grandchildren , 442 brothers or sisters , 486 parents , 0 foster children , 662 other relatives , 1,145 non-relatives In group quarters: 242
Size of family households: 3,674 2-persons , 1,522 3-persons , 964 4-persons , 363 5-persons , 47 6-persons , 73 7-or-more-persons .
Size of nonfamily households: 4,537 1-person , 567 2-persons , 29 3-persons , 39 5-persons .
1,648 married couples with children. single-parent households (280 men , 1,339 women ).
71.6% of residents of South Bradenton speak English at home. of residents speak Spanish at home (56% speak English very well , 20% speak English well , 16% speak English not well , 8% don't speak English at all ).of residents speak other Indo-European language at home (59% speak English very well , 33% speak English well , 8% speak English not well ).of residents speak Asian or Pacific Island language at home (18% speak English very well , 79% speak English well , 3% speak English not well ).of residents speak other language at home (34% speak English very well , 58% speak English well , 8% speak English not well ).
Foreign born population: 4,949 (18.3%)of them are naturalized citizens )
Median number of rooms in houses and condos:
Median number of rooms in apartments
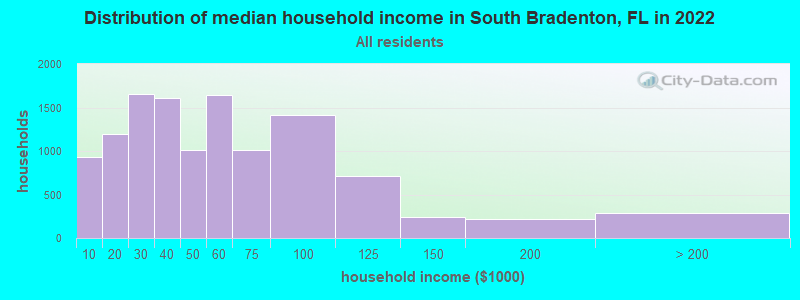
South Bradenton, FL household income distribution 932 Less than $10,0001,195 $10,000 to $19,9991,652 $20,000 to $29,9991,610 $30,000 to $39,9991,008 $40,000 to $49,9991,643 $50,000 to $59,9991,017 $60,000 to $74,9991,414 $75,000 to $99,999716 $100,000 to $124,999237 $125,000 to $149,999221 $150,000 to $199,999283 $200,000 or more
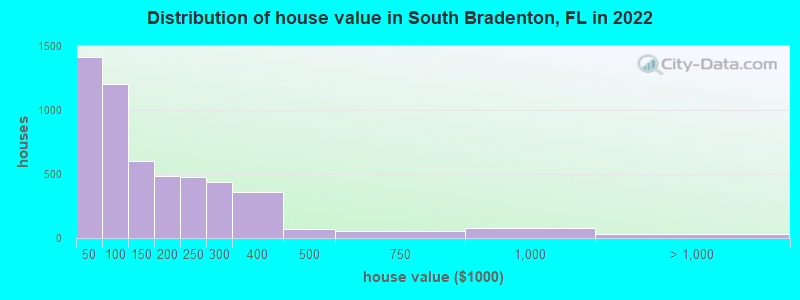
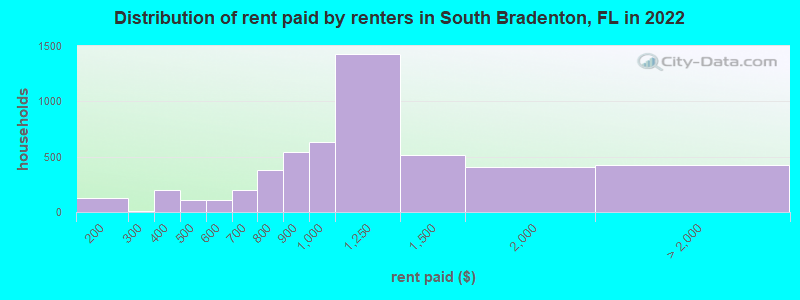
Home value of owner - occupied houses in 2022 in South Bradenton, FL 385 Less than $10,00086 $10,000 to $14,999285 $15,000 to $19,999119 $20,000 to $24,99947 $25,000 to $29,999173 $30,000 to $34,999209 $35,000 to $39,999108 $40,000 to $49,999135 $50,000 to $59,99974 $60,000 to $69,999318 $70,000 to $79,999275 $80,000 to $89,999288 $90,000 to $99,999284 $100,000 to $124,999319 $125,000 to $149,999259 $150,000 to $174,999227 $175,000 to $199,999479 $200,000 to $249,999438 $250,000 to $299,999361 $300,000 to $399,99967 $400,000 to $499,99955 $500,000 to $749,99976 $750,000 to $999,99917 $1,000,000 to $1,499,99914 $2,000,000 or moreRent paid by renters in 2022 in South Bradenton, FL 72 $100 to $14953 $150 to $1998 $250 to $29965 $300 to $349130 $350 to $39999 $400 to $4498 $450 to $49972 $500 to $54938 $550 to $599115 $600 to $64983 $650 to $699128 $700 to $749252 $750 to $799542 $800 to $899636 $900 to $9991,424 $1,000 to $1,249518 $1,250 to $1,499406 $1,500 to $1,999106 $2,000 to $2,499323 No cash rent
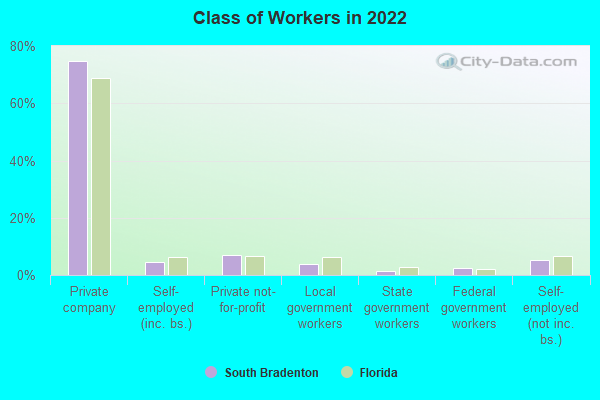
Percentage of workers working in this county: 70.5%Number of people working at home: 516 (4.1% of all workers )
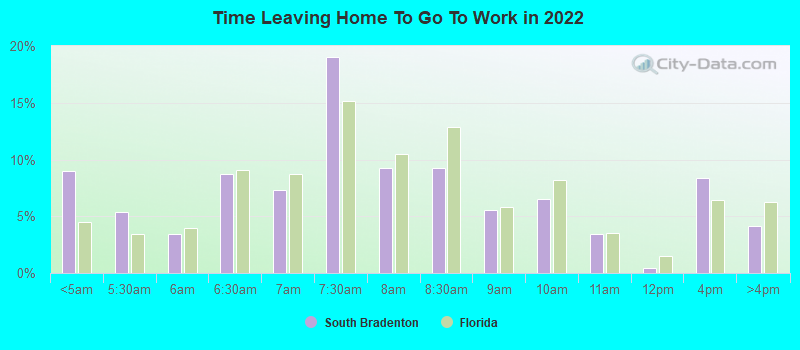
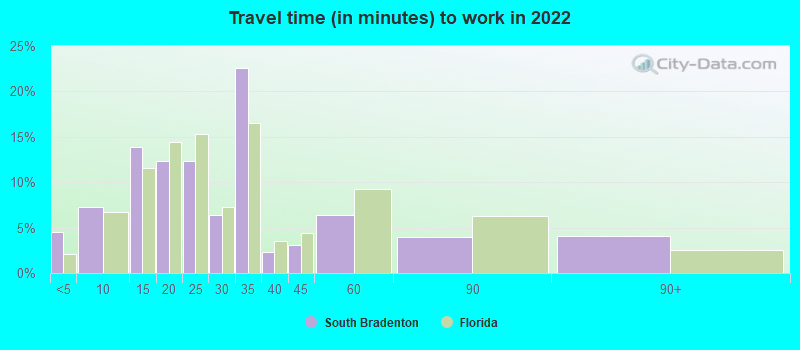
Travel time to work (commute)
Less than 5 minutes: 1005 to 9 minutes: 94110 to 14 minutes: 2,28715 to 19 minutes: 1,61720 to 24 minutes: 1,73825 to 29 minutes: 65730 to 34 minutes: 1,80135 to 39 minutes: 22040 to 44 minutes: 30645 to 59 minutes: 97460 to 89 minutes: 48790 or more minutes: 261
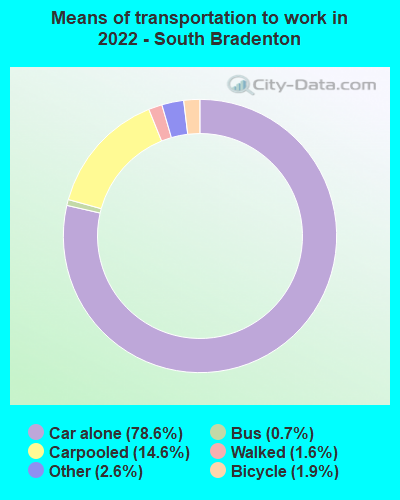
Means of transportation to work:
Drove a car alone: 4,527 (70.7%)Carpooled: 677 (10.6%)Bus : 35 (0.5%)Taxi: 169 (2.6%)Bicycle: 141 (2.2%)Walked: 133 (2.1%)Worked at home: 516 (8.1%)
Unemployment by race in 2022
Unemployment rate for White non-Hispanic residents 6.4% Males8.0% FemalesUnemployment rate for Black residents 2.3% FemalesUnemployment rate for other race residents 2.0% Males10.7% FemalesUnemployment rate for two or more race residents 6.6% Males2.6% FemalesUnemployment rate for Hispanic or Latino residents 3.8% Males6.3% Females
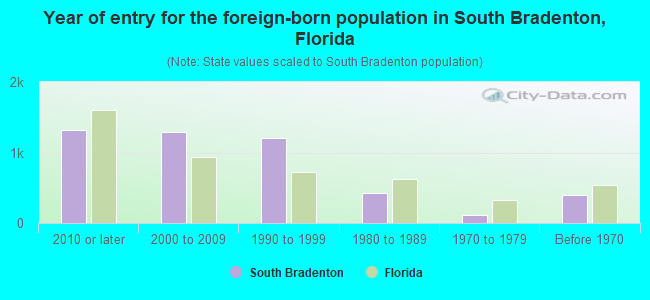
Year of entry for the foreign-born population in South Bradenton, Florida
1,315 2010 or later 1,284 2000 to 2009 1,210 1990 to 1999 430 1980 to 1989 119 1970 to 1979 401 Before 1970
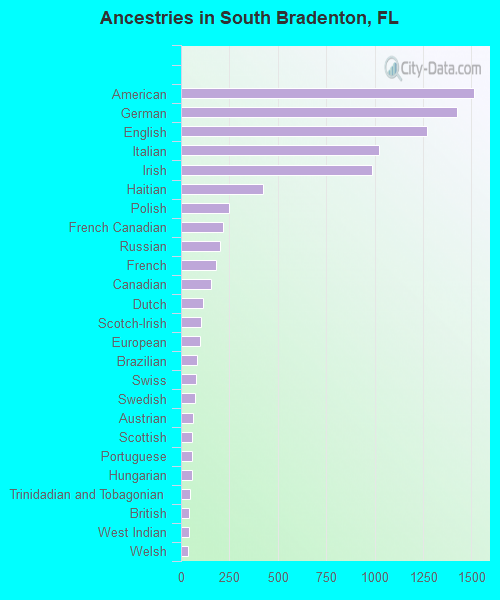
First ancestries reported:
American: 1,515 (10.4%)
German: 1,428 (9.8%)
English: 1,268 (8.7%)
Italian: 1,021 (7.0%)
Irish: 984 (6.7%)
Haitian: 425 (2.9%)
Polish: 247 (1.7%)
French Canadian: 215 (1.5%)
Russian: 202 (1.4%)
French: 179 (1.2%)
Canadian: 153 (1.0%)
Dutch: 116 (0.8%)
Scotch-Irish: 105 (0.7%)
European: 97 (0.7%)
Brazilian: 84 (0.6%)
Swiss: 79 (0.5%)
Swedish: 73 (0.5%)
Austrian: 62 (0.4%)
Scottish: 57 (0.4%)
Portuguese: 56 (0.4%)
Hungarian: 56 (0.4%)
Trinidadian and Tobagonian: 49 (0.3%)
British: 42 (0.3%)
West Indian: 39 (0.3%)
Welsh: 36 (0.2%)
Greek: 33 (0.2%)
Jamaican: 31 (0.2%)
Norwegian: 26 (0.2%)
Australian: 21 (0.1%)
Turkish: 19 (0.1%)
Lithuanian: 9 (0.06%)
Eastern European: 8 (0.05%)
Guyanese: 7 (0.05%)
Finnish: 7 (0.05%)
Pennsylvania German: 6 (0.04%)
Celtic: 6 (0.04%)
African: 4 (0.03%)
Belizean: 4 (0.03%) Most common places of birth for foreign-born residents (%): Mexico South Bradenton:
18.4% (918)Florida:
5.6% (257,152)
Haiti South Bradenton:
10.3% (513)Florida:
7.5% (342,375)
Canada South Bradenton:
7.7% (385)Florida:
2.4% (109,132)
Cuba South Bradenton:
6.9% (346)Florida:
22.0% (1,006,576)
Honduras South Bradenton:
6.0% (300)Florida:
2.3% (107,160)
Guatemala South Bradenton:
5.6% (278)Florida:
2.1% (97,632)
Dominican Republic South Bradenton:
4.1% (206)Florida:
3.0% (137,727)
Russia South Bradenton:
3.8% (189)Florida:
0.7% (31,076)
Colombia South Bradenton:
3.8% (188)Florida:
6.5% (298,669)
El Salvador South Bradenton:
3.4% (167)Florida:
1.1% (49,838)
Germany South Bradenton:
2.5% (126)Florida:
1.2% (54,272)
Trinidad and Tobago South Bradenton:
2.5% (125)Florida:
1.0% (43,642)
Brazil South Bradenton:
2.3% (117)Florida:
2.7% (122,906)
South Africa South Bradenton:
2.0% (102)Florida:
0.2% (11,243)
Nicaragua South Bradenton:
2.0% (98)Florida:
2.3% (105,066)
Croatia South Bradenton:
1.7% (83)Florida:
0.1% (3,756)
Ukraine South Bradenton:
1.5% (77)Florida:
0.5% (21,886)
Place of birth for U.S.-born residents:
This state: 7,271Other state: 13,361Northeast: 5,038Midwest: 4,625South: 2,656West: 1,050 84.7% of South Bradenton residents lived in the same house 1 years ago.
Out of people who lived in different houses, 33.3% lived in this county.
Out of people who lived in different counties, 44.4% lived in Florida.
South Bradenton:
84.7%State average:
86.3%
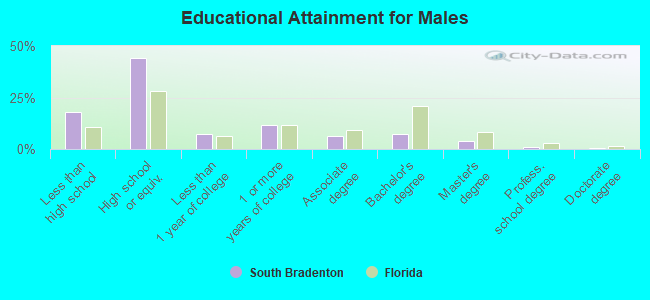
Education attainment for males 25 years and older:
No schooling: 229Nursery to 4th grade: 2195th and 6th grade: 1157th and 8th grade: 1089th grade: 15710th grade: 35111th grade: 22912th grade, no diploma: 261High school graduate (or equivalency): 4,151Less than 1 year of college: 701Some college more than 1 year, no degree: 1,109Associate degree: 577Bachelor's degree: 688Master's degree: 356Professional school degree: 82Doctorate degree: 59
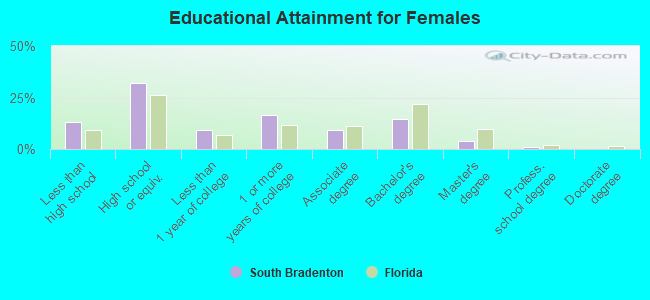
Education attainment for females 25 years and older:
No schooling: 173Nursery to 4th grade: 525th and 6th grade: 1537th and 8th grade: 479th grade: 11910th grade: 35611th grade: 9212th grade, no diploma: 346High school graduate (or equivalency): 3,220Less than 1 year of college: 934Some college more than 1 year, no degree: 1,655Associate degree: 952Bachelor's degree: 1,473Master's degree: 416Professional school degree: 106Doctorate degree: 12
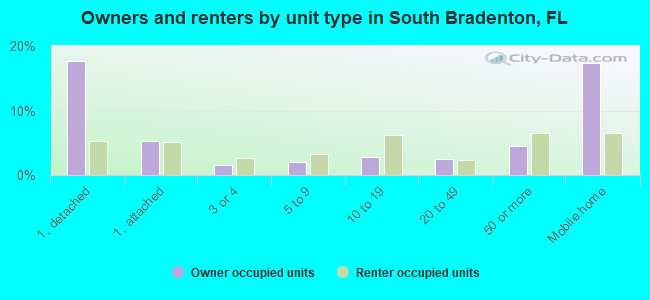
Housing units in structures:
One, detached: 3,457One, attached: 1,099Two: 9423 or 4: 7785 to 9: 77810 to 19: 1,60420 to 49: 54050 or more: 2,293Mobile homes: 3,866Boats, RVs, vans, etc.: 34Median worth of mobile homes: $42,027
Housing units lacking complete plumbing facilities in 2022: 1.0%Housing units lacking complete kitchen facilities in 2022: 1.9%House/condo owner moved in on average 9 years ago
Renter moved in on average 4 years ago
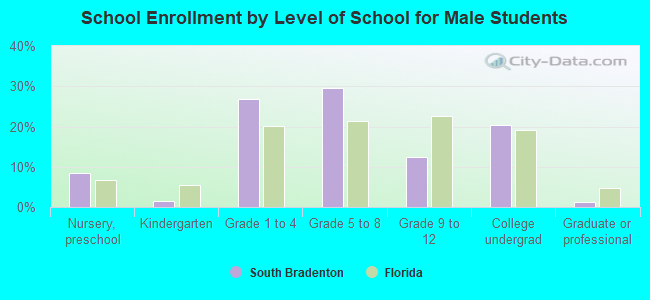
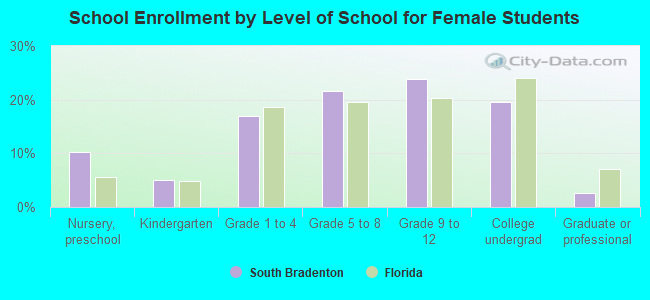
Private vs. public school enrollment:
Students in private schools in grades 1 to 8 (elementary and middle school): 119 Students in private schools in grades 9 to 12 (high school): 108 Students in private undergraduate colleges: 87