South Davis, UT (Utah) Houses and Residents
| South Davis: | $594,623 |
| Utah: | $499,500 |
Total population: 106,781 (Urban population: 87,073, Rural population: 2,007 (39 farm, 1,968 nonfarm))
Houses: 28,103 (27,049 occupied: 21,663 owner occupied, 5,386 renter occupied)
| % of renters here: | 20% |
| State: | 29% |
Housing density: 239 houses/condos per square mile
Median price asked for vacant for-sale houses and condos in 2022 in this county: $500,085.
Median contract rent in 2022: $1,457 (lower quartile is $1,182, upper quartile is $1,855)
Median rent asked for vacant for-rent units in 2022: $1,313
Median gross rent in South Davis, UT in 2022: $1,603
Housing units in South Davis with a mortgage: 13,433 (2,197 second mortgage, 1,969 home equity loan, 23 both second mortgage and home equity loan)
Houses without a mortgage: 5,394
Compare current foreclosures near South Davis, UT:
| Photo | Address | Area | Beds / Baths | Price | Details |
|---|---|---|---|---|---|

|
#1
S Holladay Cir
Salt Lake City, UT 84117
|
2,440 sq. feet
|
2 baths 4 beds |
$799,900
|
show details |

|
#2
E Downington Ave
Salt Lake City, UT 84108
|
2,580 sq. feet
|
2 baths 1 beds |
$949,900
|
show details |

|
#3
W 3800 S
Salt Lake City, UT 84119
|
2,050 sq. feet
|
2 baths 3 beds |
show details | |

|
#4
E Canyon Dr
Ogden, UT 84405
|
1,595 sq. feet
|
2 baths 2 beds |
show details | |

|
#5
W 3500 S Ste 5040w
Salt Lake City, UT 84119
|
736 sq. feet
|
2 baths 3 beds |
show details | |

|
#6
W 300 S
Salt Lake City, UT 84104
|
1,313 sq. feet
|
1 baths 3 beds |
show details | |

|
#7
E Wilson Ave
Salt Lake City, UT 84105
|
950 sq. feet
|
1 baths 3 beds |
show details | |

|
#8
N 360 W
Clearfield, UT 84015
|
1,099 sq. feet
|
1 baths 4 beds |
show details | |

|
#9
S Cascade Way
Salt Lake City, UT 84109
|
1,185 sq. feet
|
1 baths 5 beds |
show details | |

|
#10
W White Diamond Way
Salt Lake City, UT 84120
|
2,097 sq. feet
|
2 baths 3 beds |
show details |
| Photo | Address | Area | Beds / Baths | Price | Details |
|---|---|---|---|---|---|

|
#11
E Delsa Dr
Salt Lake City, UT 84124
|
2,501 sq. feet
|
2 baths 5 beds |
show details | |

|
#12
W Lemar Way
Salt Lake City, UT 84120
|
1,330 sq. feet
|
1 baths 2 beds |
show details | |

|
#13
E Kensington Ave
Salt Lake City, UT 84105
|
1,016 sq. feet
|
1 baths 2 beds |
show details | |

|
#14
E Kensington Ave
Salt Lake City, UT 84105
|
1,700 sq. feet
|
2 baths 4 beds |
show details | |

|
#15
W Bristol Way
Salt Lake City, UT 84119
|
1,158 sq. feet
|
1 baths 3 beds |
show details | |

|
#16
S Dunmore Ct
Salt Lake City, UT 84123
|
1,325 sq. feet
|
2 baths 3 beds |
show details | |

|
#17
S Manhattan Ct
Salt Lake City, UT 84120
|
1,569 sq. feet
|
1 baths 3 beds |
show details | |

|
#18
E 4135 S
Salt Lake City, UT 84124
|
2,523 sq. feet
|
3 baths 4 beds |
show details | |

|
#19
S 200 E, Apt 2
Salt Lake City, UT 84115
|
720 sq. feet
|
1 baths 2 beds |
show details | |

|
#20
S 1200 W
Salt Lake City, UT 84104
|
1,056 sq. feet
|
1 baths 3 beds |
show details |
| Photo | Address | Area | Beds / Baths | Price | Details |
|---|---|---|---|---|---|

|
#21
S Santa Ynez Cir
Salt Lake City, UT 84104
|
1,000 sq. feet
|
2 baths 3 beds |
show details | |

|
#22
S 1100 W
Salt Lake City, UT 84104
|
918 sq. feet
|
1 baths 3 beds |
show details | |

|
#23
E 900 S
Salt Lake City, UT 84108
|
5,489 sq. feet
|
2 baths 7 beds |
show details | |

|
#24
S 4400 W
Salt Lake City, UT 84120
|
1,746 sq. feet
|
1 baths 3 beds |
show details | |

|
#25
S Jeremy St
Salt Lake City, UT 84104
|
2,121 sq. feet
|
3 baths 3 beds |
show details | |

|
#26
S 1300 W
Salt Lake City, UT 84104
|
800 sq. feet
|
1 baths 2 beds |
show details | |

|
#27
E Yale Ave
Salt Lake City, UT 84111
|
900 sq. feet
|
1 baths 2 beds |
show details | |

|
#28
W 3875 S
Salt Lake City, UT 84119
|
2,426 sq. feet
|
4 baths 5 beds |
show details | |

|
#29
S 1300 W
Salt Lake City, UT 84104
|
1,886 sq. feet
|
2 baths 3 beds |
show details | |

|
#30
S Edison St
Salt Lake City, UT 84115
|
1,996 sq. feet
|
2 baths 3 beds |
show details |
| Photo | Address | Area | Beds / Baths | Price | Details |
|---|---|---|---|---|---|

|
#31
S Emery St
Salt Lake City, UT 84104
|
802 sq. feet
|
1 baths 2 beds |
show details | |

|
#32
S 1300 W
Salt Lake City, UT 84104
|
1,091 sq. feet
|
1 baths 2 beds |
show details | |

|
#33
S Olene Cir
Salt Lake City, UT 84120
|
1,268 sq. feet
|
2 baths 4 beds |
show details | |

|
#34
S Crews Hill Ct
Salt Lake City, UT 84120
|
1,647 sq. feet
|
2 baths 3 beds |
show details | |

|
#35
S Milky Way
Salt Lake City, UT 84124
|
1,618 sq. feet
|
2 baths 3 beds |
show details | |

|
#36
S Redhawk Rd
Salt Lake City, UT 84119
|
1,748 sq. feet
|
2 baths 3 beds |
show details | |

|
#37
S 1400 E
Salt Lake City, UT 84105
|
2,067 sq. feet
|
2 baths 3 beds |
show details | |

|
#38
S 4000 W
Salt Lake City, UT 84120
|
1,965 sq. feet
|
2 baths 3 beds |
show details | |

|
#39
S Squirewood Cir
Salt Lake City, UT 84120
|
1,502 sq. feet
|
2 baths 3 beds |
show details | |

|
#40
S 2665 W
Salt Lake City, UT 84119
|
2,089 sq. feet
|
2 baths 3 beds |
show details |
| Photo | Address | Area | Beds / Baths | Price | Details |
|---|---|---|---|---|---|

|
#41
E 3900 S # B
Salt Lake City, UT 84124
|
2,296 sq. feet
|
5 baths 5 beds |
show details | |

|
#42
E Westminster Ave
Salt Lake City, UT 84105
|
1,112 sq. feet
|
1 baths 3 beds |
show details | |

|
#43
S 1540 W
Salt Lake City, UT 84123
|
1,680 sq. feet
|
1 baths 5 beds |
show details | |

|
#44
W 4030 S
Salt Lake City, UT 84119
|
1,857 sq. feet
|
2 baths 3 beds |
show details | |

|
#45
W Middlesex Rd
Salt Lake City, UT 84123
|
973 sq. feet
|
2 baths 3 beds |
show details | |

|
#46
W Norwalk Rd
Salt Lake City, UT 84123
|
1,143 sq. feet
|
1 baths 3 beds |
show details | |

|
#47
S Emery St
Salt Lake City, UT 84104
|
832 sq. feet
|
1 baths 2 beds |
show details | |

|
#48
W Alan Ave
Salt Lake City, UT 84119
|
1,950 sq. feet
|
2 baths 5 beds |
show details | |

|
#49
S Island Way
Salt Lake City, UT 84120
|
1,924 sq. feet
|
2 baths 3 beds |
show details | |

|
Check over 1 million property listings on Foreclosure.com!
|
browse all offers | |||

Household type by relationship:
Households: 303,186- In family households: 281,632 (61,023 male householders, 15,182 female householders)
63,601 spouses, 121,877 children (112,445 natural, 3,841 adopted, 5,591 stepchildren), 6,506 grandchildren, 1,860 brothers or sisters, 1,546 parents, foster children, 2,734 other relatives, 4,660 non-relatives
- In nonfamily households: 21,554 (8,232 male householders (6,326 living alone)), 9,108 female householders (7,925 living alone)), 4,214 nonrelatives
- In group quarters: 3,293 (1,398 institutionalized population)
69,173 married couples with children.
9,866 single-parent households (2,199 men, 7,667 women).
93.0% of residents of South Davis speak English at home.
3.5% of residents speak Spanish at home (63% speak English very well, 19% speak English well, 15% speak English not well, 4% don't speak English at all).
2.2% of residents speak other Indo-European language at home (76% speak English very well, 17% speak English well, 7% speak English not well).
1.1% of residents speak Asian or Pacific Island language at home (69% speak English very well, 25% speak English well, 6% speak English not well).
0.2% of residents speak other language at home (66% speak English very well, 34% speak English well).
Foreign born population: 5,514 (4.0%)
(59.4% of them are naturalized citizens)
| Here: | 9.3 |
| State: | 7.6 |
| Here: | 4.7 |
| State: | 4.3 |
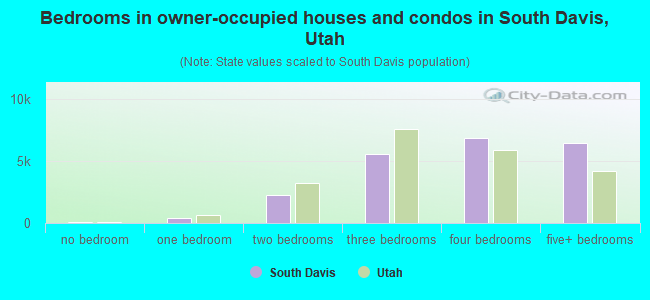
- Bedrooms in owner-occupied houses and condos in South Davis, Utah
- 59no bedroom
- 3791 bedroom
- 2,2562 bedrooms
- 5,6053 bedrooms
- 6,8934 bedrooms
- 6,4715+ bedrooms
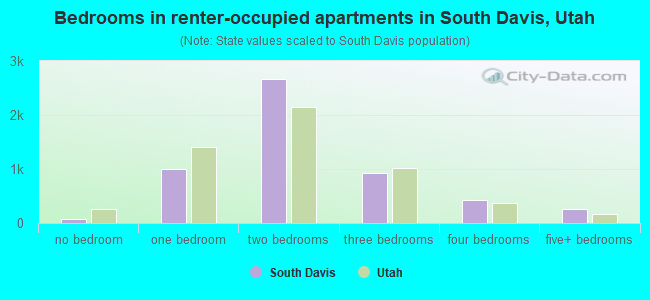
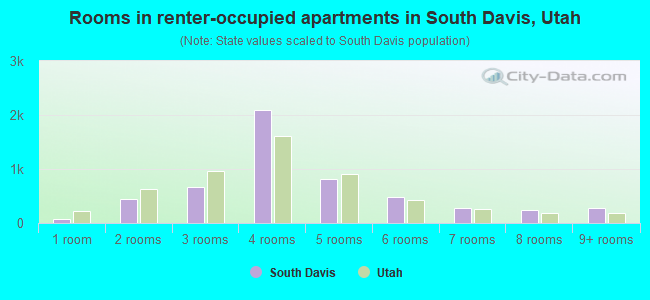
- Bedrooms in renter-occupied apartments in South Davis, Utah
- 81no bedroom
- 1,0071 bedroom
- 2,6752 bedrooms
- 9353 bedrooms
- 4324 bedrooms
- 2565+ bedrooms
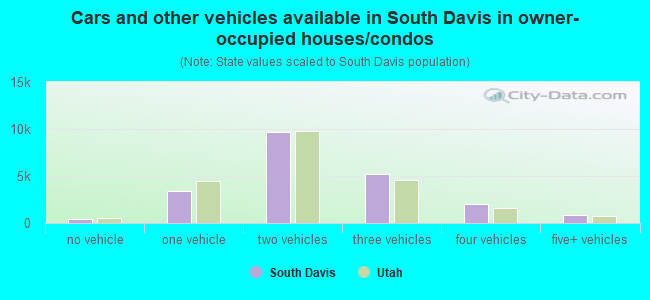
- Cars and other vehicles available in South Davis in owner-occupied houses/condos
- 477no vehicle
- 3,4401 vehicle
- 9,7172 vehicles
- 5,1873 vehicles
- 1,9904 vehicles
- 8525+ vehicles
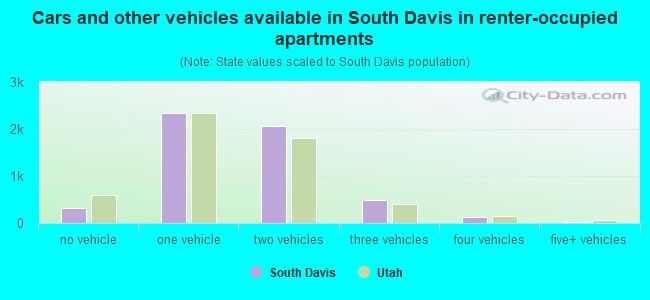
- Cars and other vehicles available in South Davis in renter-occupied apartments
- 323no vehicle
- 2,3451 vehicle
- 2,0542 vehicles
- 4993 vehicles
- 1374 vehicles
- 285+ vehicles
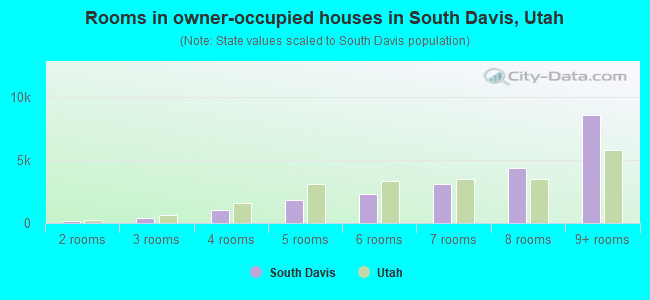
- Rooms in owner-occupied houses in South Davis, Utah
- 161 room
- 1552 rooms
- 3723 rooms
- 9924 rooms
- 1,8255 rooms
- 2,2936 rooms
- 3,1097 rooms
- 4,3348 rooms
- 8,5679+ rooms
- Rooms in renter-occupied apartments in South Davis, Utah
- 731 room
- 4512 rooms
- 6623 rooms
- 2,0974 rooms
- 8215 rooms
- 4756 rooms
- 2757 rooms
- 2508 rooms
- 2829+ rooms
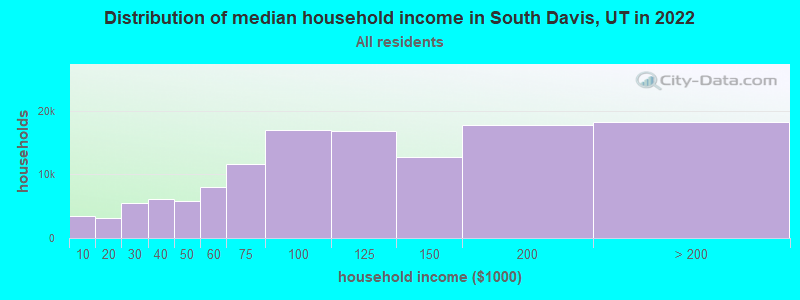
South Davis, UT household income distribution

- 3,483Less than $10,000
- 3,157$10,000 to $19,999
- 5,465$20,000 to $29,999
- 6,158$30,000 to $39,999
- 5,729$40,000 to $49,999
- 7,956$50,000 to $59,999
- 11,538$60,000 to $74,999
- 16,995$75,000 to $99,999
- 16,709$100,000 to $124,999
- 12,695$125,000 to $149,999
- 17,716$150,000 to $199,999
- 18,198$200,000 or more
Percentage of workers working in this county: 56.0%
Number of people working at home: 14,469 (20.9% of all workers)
Travel time to work (commute)
- Less than 5 minutes: 1,465
- 5 to 9 minutes: 6,061
- 10 to 14 minutes: 5,840
- 15 to 19 minutes: 5,279
- 20 to 24 minutes: 7,102
- 25 to 29 minutes: 3,284
- 30 to 34 minutes: 6,242
- 35 to 39 minutes: 1,027
- 40 to 44 minutes: 1,099
- 45 to 59 minutes: 1,485
- 60 to 89 minutes: 758
- 90 or more minutes: 472
Means of transportation to work:
- Drove a car alone: 33,622 (79.9%)
- Carpooled: 4,401 (10.5%)
- Bus or trolley bus: 1,105 (2.6%)
- Streetcar or trolley car: 14 (0.0%)
- Subway or elevated: 16 (0.0%)
- Railroad: 2 (0.0%)
- Motorcycle: 57 (0.1%)
- Bicycle: 94 (0.2%)
- Walked: 632 (1.5%)
- Other means: 171 (0.4%)
- Worked at home: 1,961 (4.7%)
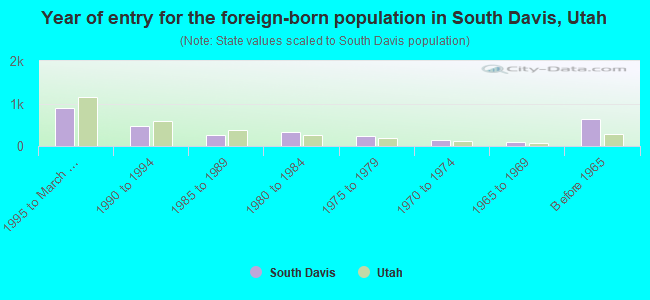
- Year of entry for the foreign-born population in South Davis, Utah
- 8921995 to March 2000
- 4631990 to 1994
- 2491985 to 1989
- 3291980 to 1984
- 2321975 to 1979
- 1351970 to 1974
- 1011965 to 1969
- 646Before 1965
Most common places of birth for foreign-born residents (%):
| South Davis: | 20.7% (631) |
| Utah: | 41.9% (66,478) |
| South Davis: | 7.6% (233) |
| Utah: | 3.0% (4,784) |
| South Davis: | 6.5% (197) |
| Utah: | 4.9% (7,722) |
| South Davis: | 6.3% (193) |
| Utah: | 3.2% (5,086) |
| South Davis: | 3.4% (105) |
| Utah: | 1.9% (3,013) |
| South Davis: | 3.3% (101) |
| Utah: | 0.9% (1,450) |
| South Davis: | 3.0% (91) |
| Utah: | 1.0% (1,655) |
| South Davis: | 3.0% (90) |
| Utah: | 0.4% (580) |
| South Davis: | 2.6% (78) |
| Utah: | 0.6% (889) |
| South Davis: | 2.4% (73) |
| Utah: | 1.7% (2,680) |
| South Davis: | 2.3% (71) |
| Utah: | 2.0% (3,201) |
| South Davis: | 2.3% (70) |
| Utah: | 1.5% (2,389) |
| South Davis: | 2.2% (66) |
| Utah: | 1.2% (1,908) |
| South Davis: | 2.2% (66) |
| Utah: | 1.5% (2,357) |
| South Davis: | 1.9% (59) |
| Utah: | 0.7% (1,098) |
| South Davis: | 1.9% (59) |
| Utah: | 0.9% (1,405) |
| South Davis: | 1.9% (57) |
| Utah: | 0.4% (594) |
| South Davis: | 1.6% (50) |
| Utah: | 0.4% (594) |
Place of birth for U.S.-born residents:
- This state: 62,230
- Other state: 23,235
- Northeast: 1,419
- Midwest: 3,605
- South: 3,368
- West: 14,843
59% of South Davis residents lived in the same house 5 years ago.
Out of people who lived in different houses, 52% lived in this county.
Out of people who lived in different counties, 57% lived in Utah.
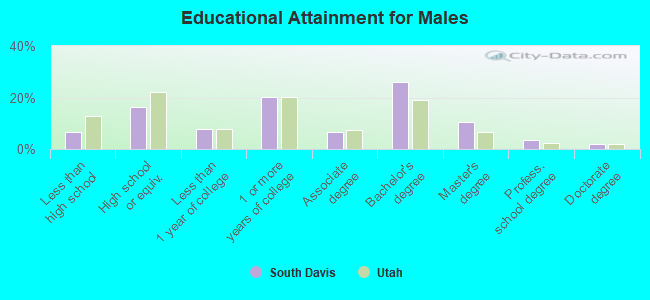
Education attainment for males 25 years and older:
- No schooling: 62
- Nursery to 4th grade: 7
- 5th and 6th grade: 57
- 7th and 8th grade: 161
- 9th grade: 189
- 10th grade: 168
- 11th grade: 347
- 12th grade, no diploma: 563
- High school graduate (or equivalency): 3,881
- Less than 1 year of college: 1,863
- Some college more than 1 year, no degree: 4,806
- Associate degree: 1,606
- Bachelor's degree: 6,220
- Master's degree: 2,472
- Professional school degree: 872
- Doctorate degree: 483
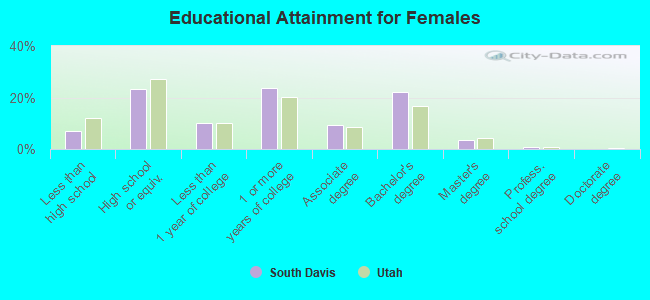
Education attainment for females 25 years and older:
- No schooling: 22
- Nursery to 4th grade: 51
- 5th and 6th grade: 28
- 7th and 8th grade: 215
- 9th grade: 251
- 10th grade: 306
- 11th grade: 296
- 12th grade, no diploma: 599
- High school graduate (or equivalency): 5,881
- Less than 1 year of college: 2,593
- Some college more than 1 year, no degree: 5,993
- Associate degree: 2,331
- Bachelor's degree: 5,587
- Master's degree: 883
- Professional school degree: 218
- Doctorate degree: 47
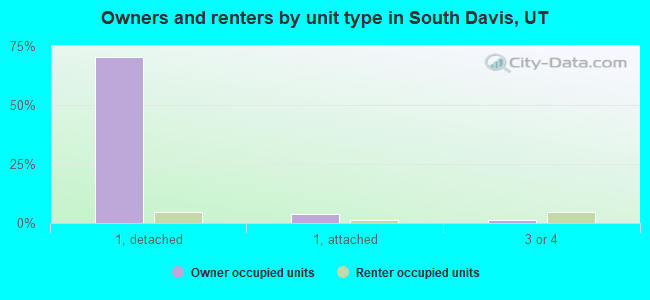
Housing units in structures:
- One, detached: 20,748
- One, attached: 1,508
- Two: 1,061
- 3 or 4: 1,671
- 5 to 9: 681
- 10 to 19: 907
- 20 to 49: 309
- 50 or more: 409
- Mobile homes: 802
- Boats, RVs, vans, etc.: 7
Median worth of mobile homes: $43,333
Housing units lacking complete kitchen facilities: 0.1%
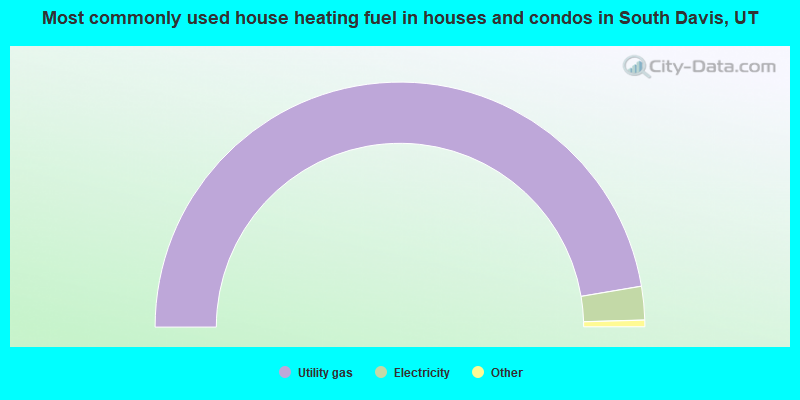
- 94.7%Utility gas
- 4.4%Electricity
- 0.6%Bottled, tank, or LP gas
- 0.2%Wood
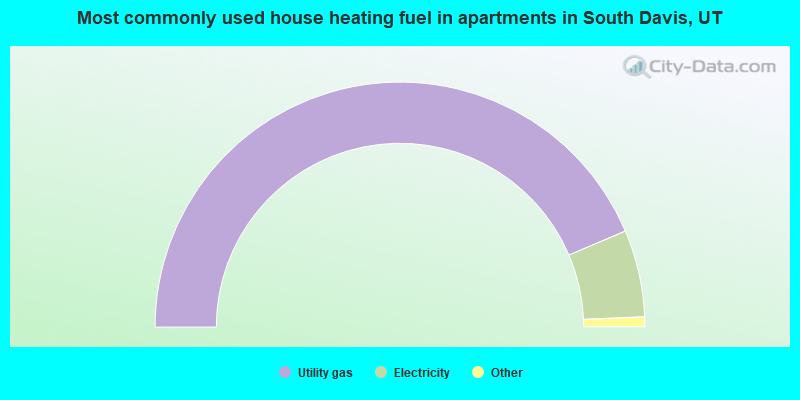
- 87.3%Utility gas
- 11.5%Electricity
- 0.7%Bottled, tank, or LP gas
- 0.3%No fuel used
- 0.2%Other fuel
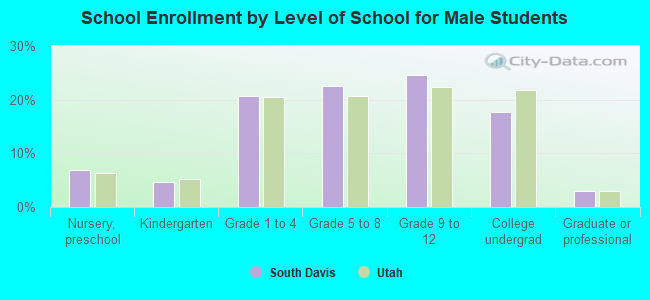
Private vs. public school enrollment:
| Here: | 2.7% |
| Utah: | 4.2% |
| Here: | 1.5% |
| Utah: | 3.9% |
| Here: | 12.5% |
| Utah: | 27.4% |