South Holland, IL (Illinois) Houses and Residents
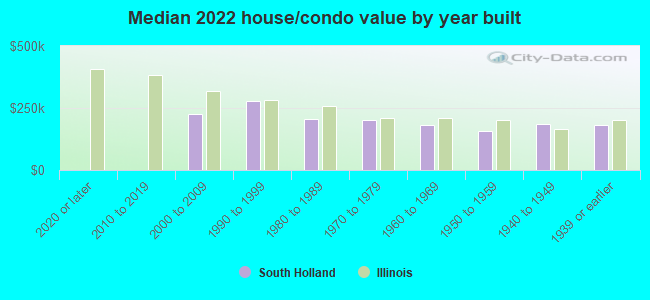
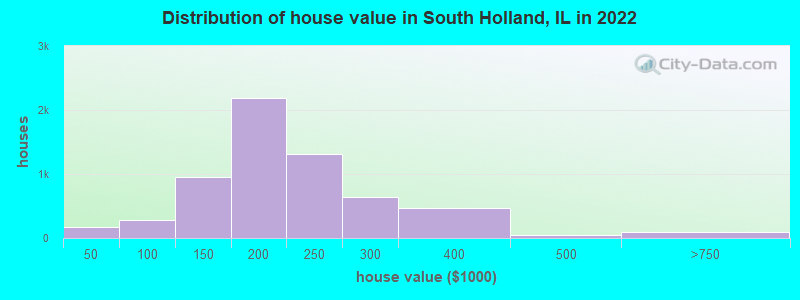
Estimated median house or condo value in 2022: $186,053 (it was $133,500 in 2000 )
South Holland:
$186,053Illinois:
$251,600
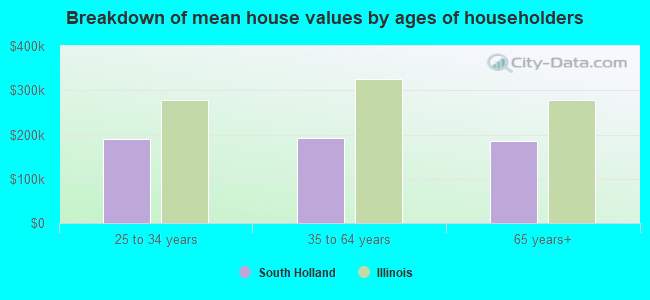
Lower value quartile - upper value quartile: $155,917 - $234,167Mean price in 2022: Detached houses: $194,745 Here:
$194,745State:
$310,164
Townhouses or other attached units: $194,614 Here:
$194,614State:
$286,230
In 3-to-4-unit structures: $250,230 Here:
$250,230State:
$330,907
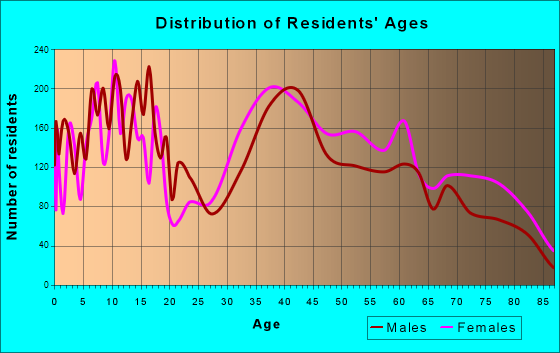
Total population: 22,144 (All urban)
Houses: 8,136 (7,670 occupied: 6,470 owner occupied, 1,330 renter occupied )
% of renters here:
17%State:
33%
Housing density: 1,118 houses/condos per square mile
Median price asked for vacant for-sale houses and condos in 2022: $165,251.
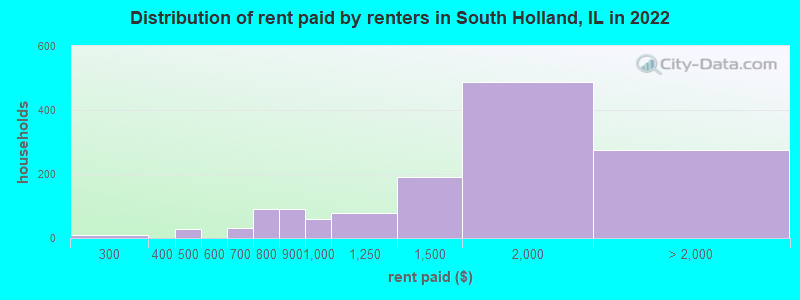
Median contract rent in 2022: $1,564 (lower quartile is $1,113, upper quartile is $1,924)
Median rent asked for vacant for-rent units in 2022: $2,001
Median gross rent in South Holland, IL in 2022: $1,857
Housing units in South Holland with a mortgage: 5,020 (194 second mortgage, 8 home equity loan, 154 both second mortgage and home equity loan )Houses without a mortgage: 95
Median household income for houses/condos with a mortgage: $88,060
Median household income for apartments without a mortgage: $62,876
Median monthly housing costs: $1,709
Data:
Median house or condo value ($)
Median house or condo value ($ change since 2000)
Median house or condo value ($) - White
Median house or condo value ($) - Black or African American
Median house or condo value ($) - Asian
Median house or condo value ($) - Hispanic or Latino
Median house or condo value ($) - American Indian and Alaska Native
Median house or condo value ($) - Multirace
Median house or condo value ($) - Other Race
Median price asked for mobile homes ($)
Household density (households per square mile)
Mean house or condo value by units in structure - 1, detached ($)
Mean house or condo value by units in structure - 1, attached ($)
Mean house or condo value by units in structure - 2 ($)
Mean house or condo value by units in structure by units in structure - 3 or 4 ($)
Mean house or condo value by units in structure - 5 or more ($)
Mean house or condo value by units in structure - Boat, RV, van, etc. ($)
Mean house or condo value by units in structure - Mobile home ($)
Median contract rent ($)
Median contract rent - Lower quartile ($)
Median contract rent - Upper quartile ($)
Median gross rent ($)
Urban houses (%)
Rural houses (%)
Houses occupied (%)
Houses occupied (% change since 2000)
Houses owner occupied (%)
Houses owner occupied (% change since 2000)
Houses renter occupied (%)
Houses renter occupied (% change since 2000)
Vacant housing units - For rent (%)
Vacant housing units - For rent (% change since 2000)
Vacant housing units - For sale only (%)
Vacant housing units - For sale only (% change since 2000)
Vacant housing units - Rented or sold, not occupied (%)
Vacant housing units - Rented or sold, not occupied (% change since 2000)
Vacant housing units - For seasonal, recreational, or occasional use (%)
Vacant housing units - For seasonal, recreational, or occasional use (% change since 2000)
Vacant housing units - For migrant workers (%)
Vacant housing units - For migrant workers (% change since 2000)
Vacant housing units - Other vacant (%)
Vacant housing units - Other vacant (% change since 2000)
Median monthly housing costs ($)
Median household income for houses/condos with a mortgage ($)
Median household income for houses/condos without a mortgage ($)
Median household income ($)
Median household income ($) - White
Median household income ($) - Black or African American
Median household income ($) - Asian
Median household income ($) - Hispanic or Latino
Median household income ($) - American Indian and Alaska Native
Median household income ($) - Multirace
Median household income ($) - Other Race
Mortgage status - with mortgage (%)
Mortgage status - with second mortgage (%)
Mortgage status - with home equity loan (%)
Mortgage status - with both second mortgage and home equity loan (%)
Mortgage status - without a mortgage (%)
Median year house/condo built
Median year apartment built
Household type by relationship - Male householder living alone (%)
Household type by relationship - Male householder not living alone (%)
Household type by relationship - Female householder living alone (%)
Household type by relationship - Female householder not living alone (%)
Household type by relationship - Opposite-Sex spouse (%)
Household type by relationship - Same-Sex spouse (%)
Household type by relationship - Opposite-Sex unmarried partner (%)
Household type by relationship - Same-Sex unmarried partner (%)
Household type by relationship - In group quarters (%)
Size of family households - 2-person household (%)
Size of family households - 3-person household (%)
Size of family households - 4-person household (%)
Size of family households - 5-person household (%)
Size of family households - 6-person household (%)
Size of family households - 7-or-more-person household (%)
Size of nonfamily households - 1-person household (%)
Size of nonfamily households - 2-person household (%)
Size of nonfamily households - 3-person household (%)
Size of nonfamily households - 4-person household (%)
Size of nonfamily households - 5-person household (%)
Size of nonfamily households - 6-person household (%)
Size of nonfamily households - 7-or-moreperson household (%)
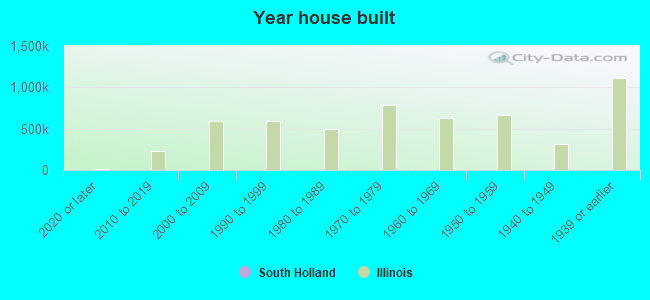
Year house built - Built 2010 or later (%)
Year house built - Built 2000 to 2009 (%)
Year house built - Built 1990 to 1999 (%)
Year house built - Built 1980 to 1989 (%)
Year house built - Built 1970 to 1979 (%)
Year house built - Built 1960 to 1969 (%)
Year house built - Built 1950 to 1959 (%)
Year house built - Built 1940 to 1949 (%)
Year house built - Built 1939 or earlier (%)
Median number of rooms in houses and condos
Median number of rooms in apartments
Median number of bedrooms in owner occupied houses
Mean number of bedrooms in owner occupied houses
Median number of bedrooms in renter occupied houses
Mean number of bedrooms in renter occupied houses
Median number of vehichles in owner occupied houses
Mean number of vehichles in owner occupied houses
Median number of vehichles in renter occupied houses
Mean number of vehichles in renter occupied houses
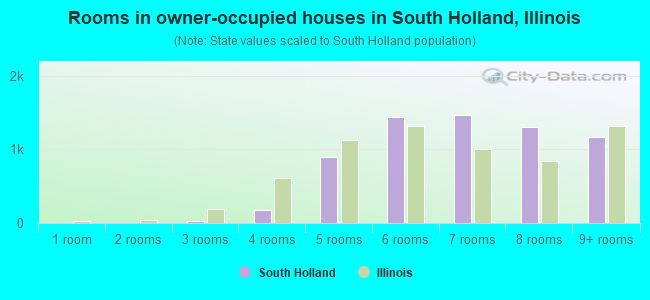
Rooms in owner-occupied houses - 1 room (%)
Rooms in owner-occupied houses - 2 rooms (%)
Rooms in owner-occupied houses - 3 rooms (%)
Rooms in owner-occupied houses - 4 rooms (%)
Rooms in owner-occupied houses - 5 rooms (%)
Rooms in owner-occupied houses - 6 rooms (%)
Rooms in owner-occupied houses - 7 rooms (%)
Rooms in owner-occupied houses - 8 rooms (%)
Rooms in owner-occupied houses - 9+ rooms (%)
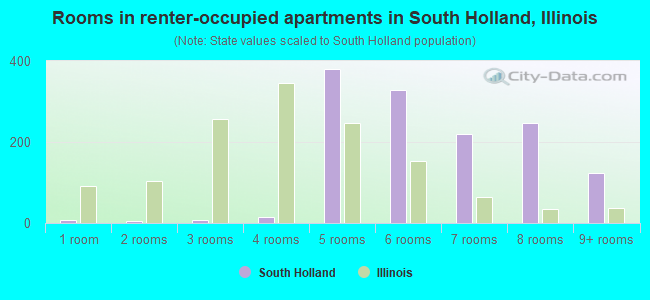
Rooms in renter-occupied houses - 1 room (%)
Rooms in renter-occupied houses - 2 rooms (%)
Rooms in renter-occupied houses - 3 rooms (%)
Rooms in renter-occupied houses - 4 rooms (%)
Rooms in renter-occupied houses - 5 rooms (%)
Rooms in renter-occupied houses - 6 rooms (%)
Rooms in renter-occupied houses - 7 rooms (%)
Rooms in renter-occupied houses - 8 rooms (%)
Rooms in renter-occupied houses - 9+ rooms (%)
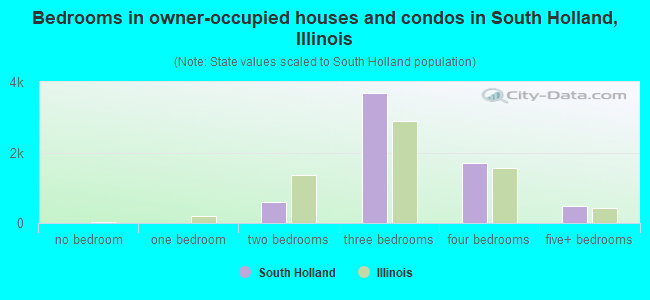
Bedrooms in owner-occupied houses - no bedrooms (%)
Bedrooms in owner-occupied houses - 1 bedroom (%)
Bedrooms in owner-occupied houses - 2 bedrooms (%)
Bedrooms in owner-occupied houses - 3 bedrooms (%)
Bedrooms in owner-occupied houses - 4 bedrooms (%)
Bedrooms in owner-occupied houses - 5+ bedrooms (%)
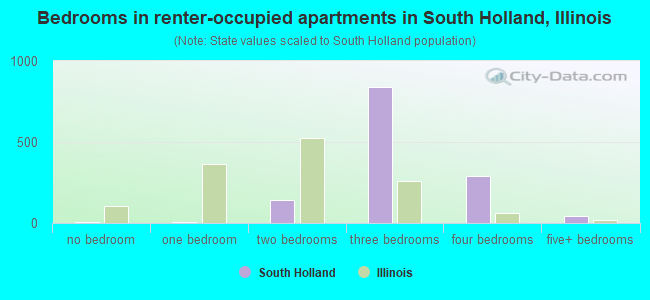
Bedrooms in renter-occupied houses - no bedrooms (%)
Bedrooms in renter-occupied houses - 1 bedroom (%)
Bedrooms in renter-occupied houses - 2 bedrooms (%)
Bedrooms in renter-occupied houses - 3 bedrooms (%)
Bedrooms in renter-occupied houses - 4 bedrooms (%)
Bedrooms in renter-occupied houses - 5+ bedrooms (%)
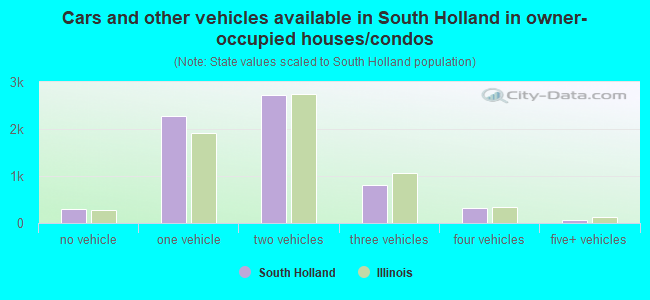
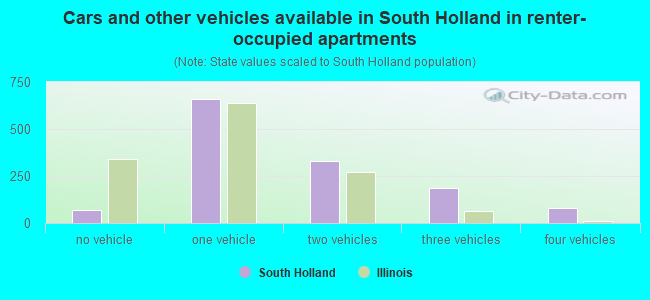
Vehicles available in owner-occupied houses - no vehicle available (%)
Vehicles available in owner-occupied houses - 1 vehicle available(%)
Vehicles available in owner-occupied houses - 2 Vehicles available (%)
Vehicles available in owner-occupied houses - 3 Vehicles available (%)
Vehicles available in owner-occupied houses - 4 Vehicles available (%)
Vehicles available in owner-occupied houses - 5+ Vehicles available (%)
Vehicles available in renter-occupied houses - no vehicle available (%)
Vehicles available in renter-occupied houses - 1 vehicle available (%)
Vehicles available in renter-occupied houses - 2 Vehicles available (%)
Vehicles available in renter-occupied houses - 3 Vehicles available (%)
Vehicles available in renter-occupied houses - 4 Vehicles available (%)
Vehicles available in renter-occupied houses - 5+ Vehicles available (%)
Housing units in structures - 1, detached (%)
Housing units in structures - 1, attached (%)
Housing units in structures - 2 (%)
Housing units in structures - 3 or 4 (%)
Housing units in structures - 5 to 9 (%)
Housing units in structures - 10 to 19 (%)
Housing units in structures - 20 to 49 (%)
Housing units in structures - 50 or more (%)
Housing units in structures - Mobile home (%)
Housing units in structures - Boat, RV, van, etc. (%)
Housing units in structures - Owners - 1, detached (%)
Housing units in structures - Owners - 1, attached (%)
Housing units in structures - Owners - 2 (%)
Housing units in structures - Owners - 3 or 4 (%)
Housing units in structures - Owners - 5 to 9 (%)
Housing units in structures - Owners - 10 to 19 (%)
Housing units in structures - Owners - 20 to 49 (%)
Housing units in structures - Owners - 50 or more (%)
Housing units in structures - Owners - Mobile home (%)
Housing units in structures - Owners - Boat, RV, van, etc. (%)
Housing units in structures - Renters - 1, detached (%)
Housing units in structures - Renters - 1, attached (%)
Housing units in structures - Renters - 2 (%)
Housing units in structures - Renters - 3 or 4 (%)
Housing units in structures - Renters - 5 to 9 (%)
Housing units in structures - Renters - 10 to 19 (%)
Housing units in structures - Renters - 20 to 49 (%)
Housing units in structures - Renters - 50 or more (%)
Housing units in structures - Renters - Mobile home (%)
Housing units in structures - Renters - Boat, RV, van, etc. (%)
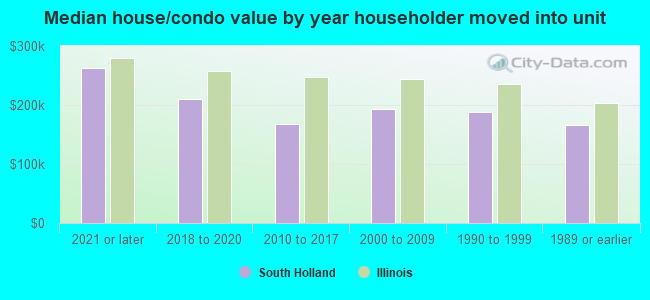
House/condo owner moved in on average (years ago)
Renter moved in on average (years ago)
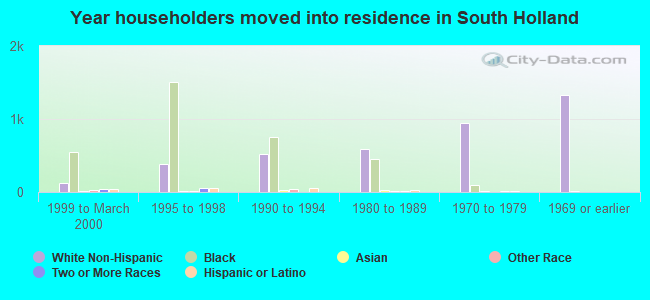
Year householder moved into unit - Moved in 1999 to March 2000 (%)
Year householder moved into unit - Moved in 1999 to March 2000 (%) - White
Year householder moved into unit - Moved in 1999 to March 2000 (%) - Black or African American
Year householder moved into unit - Moved in 1999 to March 2000 (%) - Asian
Year householder moved into unit - Moved in 1999 to March 2000 (%) - Hispanic or Latino
Year householder moved into unit - Moved in 1999 to March 2000 (%) - American Indian and Alaska Native
Year householder moved into unit - Moved in 1999 to March 2000 (%) - Multirace
Year householder moved into unit - Moved in 1999 to March 2000 (%) - Other Race
Year householder moved into unit - Moved in 1995 to 1998 (%)
Year householder moved into unit - Moved in 1995 to 1998 (%) - White
Year householder moved into unit - Moved in 1995 to 1998 (%) - Black or African American
Year householder moved into unit - Moved in 1995 to 1998 (%) - Asian
Year householder moved into unit - Moved in 1995 to 1998 (%) - Hispanic or Latino
Year householder moved into unit - Moved in 1995 to 1998 (%) - American Indian and Alaska Native
Year householder moved into unit - Moved in 1995 to 1998 (%) - Multirace
Year householder moved into unit - Moved in 1995 to 1998 (%) - Other Race
Year householder moved into unit - Moved in 1990 to 1994 (%)
Year householder moved into unit - Moved in 1990 to 1994 (%) - White
Year householder moved into unit - Moved in 1990 to 1994 (%) - Black or African American
Year householder moved into unit - Moved in 1990 to 1994 (%) - Asian
Year householder moved into unit - Moved in 1990 to 1994 (%) - Hispanic or Latino
Year householder moved into unit - Moved in 1990 to 1994 (%) - American Indian and Alaska Native
Year householder moved into unit - Moved in 1990 to 1994 (%) - Multirace
Year householder moved into unit - Moved in 1990 to 1994 (%) - Other Race
Year householder moved into unit - Moved in 1980 to 1989 (%)
Year householder moved into unit - Moved in 1980 to 1989 (%) - White
Year householder moved into unit - Moved in 1980 to 1989 (%) - Black or African American
Year householder moved into unit - Moved in 1980 to 1989 (%) - Asian
Year householder moved into unit - Moved in 1980 to 1989 (%) - Hispanic or Latino
Year householder moved into unit - Moved in 1980 to 1989 (%) - American Indian and Alaska Native
Year householder moved into unit - Moved in 1980 to 1989 (%) - Multirace
Year householder moved into unit - Moved in 1980 to 1989 (%) - Other Race
Year householder moved into unit - Moved in 1970 to 1979 (%)
Year householder moved into unit - Moved in 1970 to 1979 (%) - White
Year householder moved into unit - Moved in 1970 to 1979 (%) - Black or African American
Year householder moved into unit - Moved in 1970 to 1979 (%) - Asian
Year householder moved into unit - Moved in 1970 to 1979 (%) - Hispanic or Latino
Year householder moved into unit - Moved in 1970 to 1979 (%) - American Indian and Alaska Native
Year householder moved into unit - Moved in 1970 to 1979 (%) - Multirace
Year householder moved into unit - Moved in 1970 to 1979 (%) - Other Race
Year householder moved into unit - Moved in 1969 or earlier (%)
Year householder moved into unit - Moved in 1969 or earlier (%) - White
Year householder moved into unit - Moved in 1969 or earlier (%) - Black or African American
Year householder moved into unit - Moved in 1969 or earlier (%) - Asian
Year householder moved into unit - Moved in 1969 or earlier (%) - Hispanic or Latino
Year householder moved into unit - Moved in 1969 or earlier (%) - American Indian and Alaska Native
Year householder moved into unit - Moved in 1969 or earlier (%) - Multirace
Year householder moved into unit - Moved in 1969 or earlier (%) - Other Race
Housing units lacking complete plumbing facilities (%)
Housing units lacking complete kitchen facilities (%)
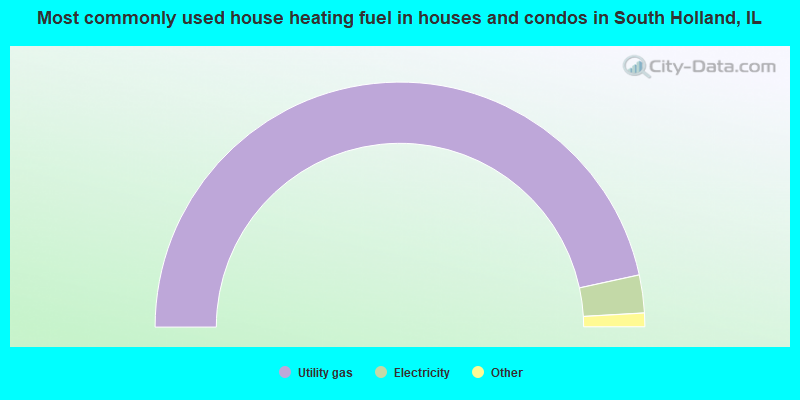
House heating fuel used in houses and condos - Utility gas (%)
House heating fuel used in houses and condos - Bottled, tank, or LP gas (%)
House heating fuel used in houses and condos - Electricity (%)
House heating fuel used in houses and condos - Fuel oil, kerosene, etc. (%)
House heating fuel used in houses and condos - Coal or coke (%)
House heating fuel used in houses and condos - Wood (%)
House heating fuel used in houses and condos - Solar energy (%)
House heating fuel used in houses and condos - Other fuel (%)
House heating fuel used in houses and condos - No fuel used (%)
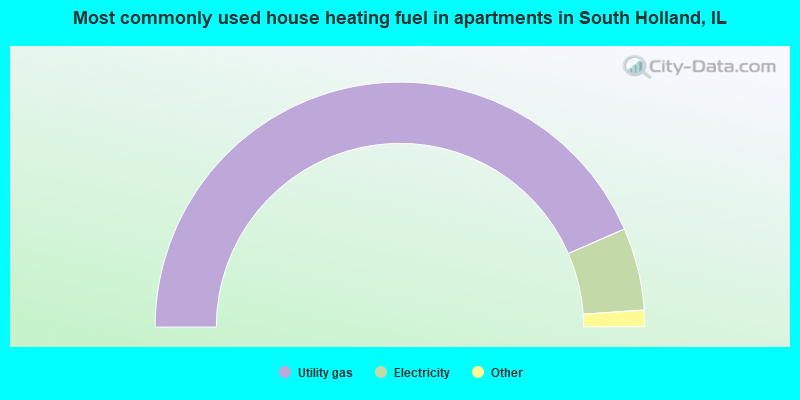
House heating fuel used in apartments - Utility gas (%)
House heating fuel used in apartments - Bottled, tank, or LP gas (%)
House heating fuel used in apartments - Electricity (%)
House heating fuel used in apartments - Fuel oil, kerosene, etc. (%)
House heating fuel used in apartments - Coal or coke (%)
House heating fuel used in apartments - Wood (%)
House heating fuel used in apartments - Solar energy (%)
House heating fuel used in apartments - Other fuel (%)
House heating fuel used in apartments - No fuel used (%)
Median year house/condo built: 1967Median year apartment built: 1969Household type by relationship:
Households: 20,814
Male householders: 3,435 (928 living alone ), Female householders: 4,032 (988 living alone )2,949 spouses (2,886 opposite-sex spouses ), 276 unmarried partners , (276 opposite-sex unmarried partners ), 6,963 children (6,777 natural , 151 adopted , 35 stepchildren ), 1,156 grandchildren , 249 brothers or sisters , 134 parents , 0 foster children , 652 other relatives , 476 non-relatives In group quarters: 485
Size of family households: 2,550 2-persons , 1,274 3-persons , 882 4-persons , 422 5-persons , 187 6-persons , 154 7-or-more-persons .
Size of nonfamily households: 2,059 1-person , 153 2-persons , 52 3-persons .
1,393 married couples with children. single-parent households (394 men , 1,566 women ).
90.2% of residents of South Holland speak English at home. of residents speak Spanish at home (73% speak English very well , 14% speak English well , 7% speak English not well , 5% don't speak English at all ).of residents speak other Indo-European language at home (79% speak English very well , 18% speak English well , 2% don't speak English at all ).of residents speak Asian or Pacific Island language at home (51% speak English very well , 34% speak English well , 11% speak English not well , 5% don't speak English at all ).of residents speak other language at home (95% speak English very well , 5% speak English well ).
Foreign born population: 1,016 (4.9%)of them are naturalized citizens )
Median number of rooms in houses and condos:
Median number of rooms in apartments
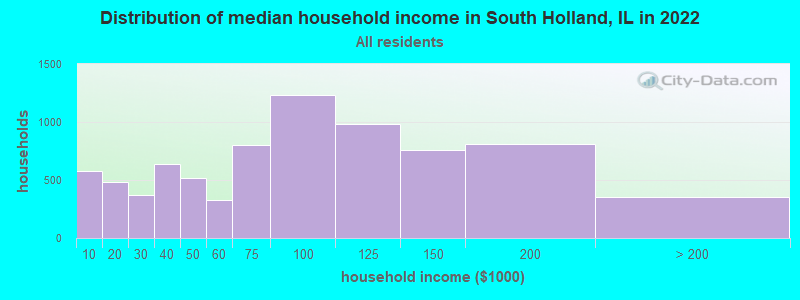
South Holland, IL household income distribution 578 Less than $10,000483 $10,000 to $19,999367 $20,000 to $29,999640 $30,000 to $39,999513 $40,000 to $49,999324 $50,000 to $59,999801 $60,000 to $74,9991,236 $75,000 to $99,999979 $100,000 to $124,999755 $125,000 to $149,999809 $150,000 to $199,999354 $200,000 or more
Home value of owner - occupied houses in 2022 in South Holland, IL 92 Less than $10,00028 $15,000 to $19,99926 $20,000 to $24,99915 $25,000 to $29,9994 $40,000 to $49,99916 $50,000 to $59,99933 $60,000 to $69,99923 $70,000 to $79,99938 $80,000 to $89,999163 $90,000 to $99,999424 $100,000 to $124,999530 $125,000 to $149,9991,425 $150,000 to $174,999765 $175,000 to $199,9991,312 $200,000 to $249,999639 $250,000 to $299,999461 $300,000 to $399,99950 $400,000 to $499,99981 $500,000 to $749,99910 $750,000 to $999,999Rent paid by renters in 2022 in South Holland, IL 9 $250 to $29928 $400 to $4496 $600 to $64923 $650 to $69981 $700 to $7498 $750 to $79990 $800 to $89958 $900 to $99979 $1,000 to $1,249192 $1,250 to $1,499488 $1,500 to $1,999228 $2,000 to $2,4998 $2,500 to $2,99938 No cash rent
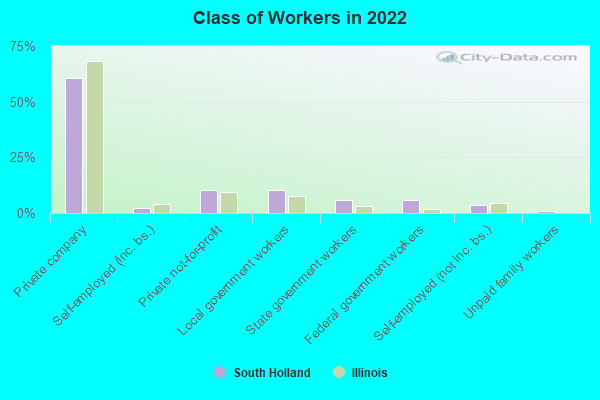
Percentage of workers working in this county: 90.9%Number of people working at home: 1,289 (15.2% of all workers )
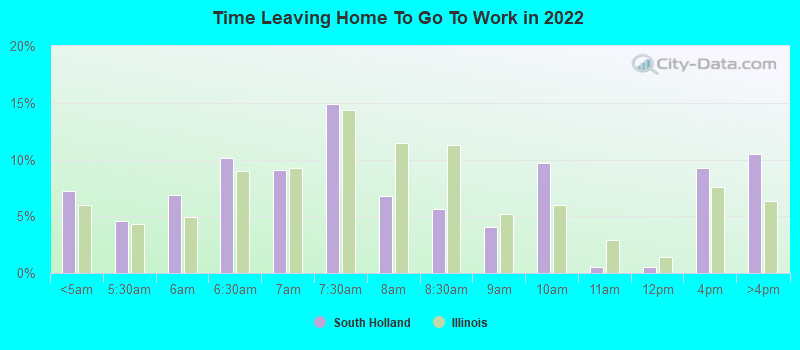
Travel time to work (commute)
Less than 5 minutes: 2635 to 9 minutes: 43510 to 14 minutes: 56815 to 19 minutes: 75020 to 24 minutes: 65825 to 29 minutes: 31330 to 34 minutes: 1,01835 to 39 minutes: 49940 to 44 minutes: 47945 to 59 minutes: 79560 to 89 minutes: 1,09390 or more minutes: 203
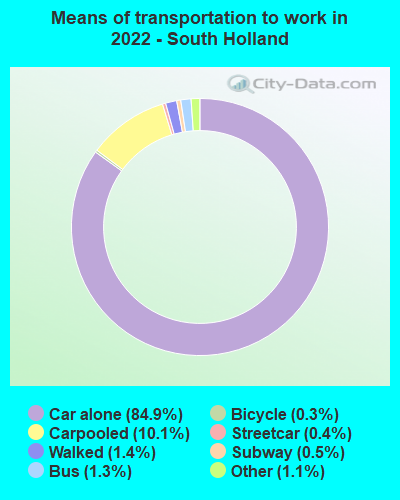
Means of transportation to work:
Drove a car alone: 7,304 (74.3%)Carpooled: 935 (9.5%)Bus : 101 (1.0%)Subway or elevated rail : 23 (0.2%)Long-distance train or commuter rail : 30 (0.3%)Taxi: 94 (1.0%)Bicycle: 23 (0.2%)Walked: 127 (1.3%)Worked at home: 1,289 (13.1%)
Unemployment by race in 2022
Unemployment rate for White non-Hispanic residents 3.3% Males4.4% FemalesUnemployment rate for Black residents 15.0% Males11.8% FemalesUnemployment rate for other race residents 15.0% FemalesUnemployment rate for two or more race residents 12.8% Males5.9% FemalesUnemployment rate for Hispanic or Latino residents 2.3% Males
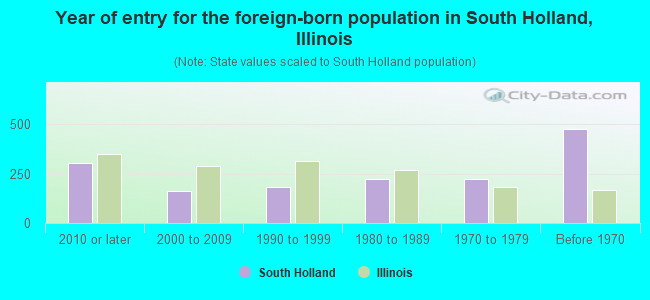
Year of entry for the foreign-born population in South Holland, Illinois
306 2010 or later 162 2000 to 2009 181 1990 to 1999 222 1980 to 1989 221 1970 to 1979 477 Before 1970
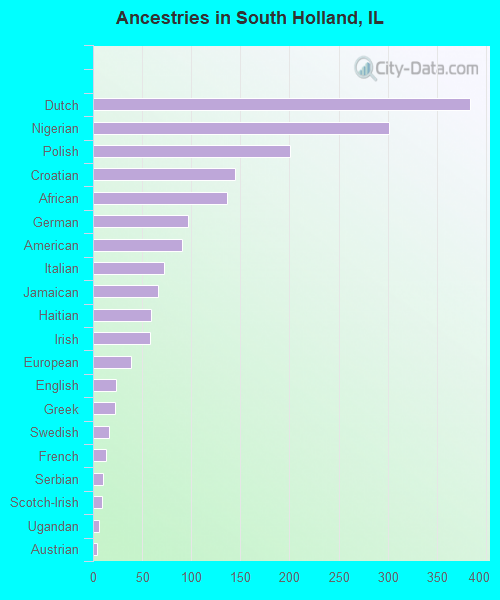
First ancestries reported:
Dutch: 384 (2.7%)
Nigerian: 301 (2.1%)
Polish: 201 (1.4%)
Croatian: 145 (1.0%)
African: 136 (1.0%)
German: 97 (0.7%)
American: 91 (0.6%)
Italian: 72 (0.5%)
Jamaican: 66 (0.5%)
Haitian: 59 (0.4%)
Irish: 58 (0.4%)
European: 39 (0.3%)
English: 23 (0.2%)
Greek: 22 (0.2%)
Swedish: 16 (0.1%)
French: 13 (0.09%)
Serbian: 10 (0.07%)
Scotch-Irish: 9 (0.06%)
Ugandan: 6 (0.04%)
Austrian: 4 (0.03%)
Lebanese: 3 (0.02%)
Hungarian: 1 (0.01%)
Lithuanian: 1 (0.01%) Most common places of birth for foreign-born residents (%): Nigeria South Holland:
47.7% (485)Illinois:
1.2% (21,186)
Mexico South Holland:
29.4% (299)Illinois:
34.7% (626,958)
Croatia South Holland:
4.5% (46)Illinois:
0.2% (3,977)
Jamaica South Holland:
4.3% (44)Illinois:
0.5% (8,168)
China, excluding Hong Kong and Taiwan South Holland:
4.2% (43)Illinois:
4.1% (74,364)
Canada South Holland:
1.8% (18)Illinois:
1.1% (19,306)
Uganda South Holland:
1.6% (16)Illinois:
0.1% (1,043)
Place of birth for U.S.-born residents:
This state: 15,968Other state: 3,528Northeast: 129Midwest: 1,176South: 1,873West: 293 91.4% of South Holland residents lived in the same house 1 years ago.
Out of people who lived in different houses, 47.9% lived in this county.
Out of people who lived in different counties, 33.8% lived in Illinois.
South Holland:
91.4%State average:
88.3%
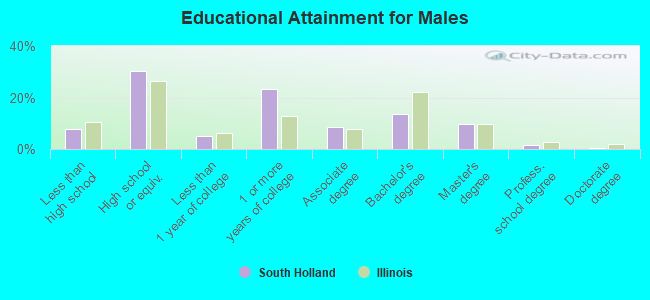
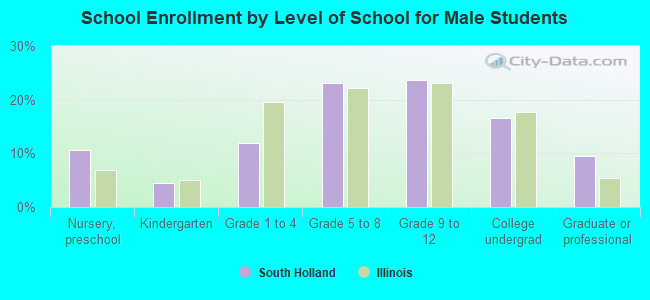
Education attainment for males 25 years and older:
No schooling: 9Nursery to 4th grade: 155th and 6th grade: 967th and 8th grade: 479th grade: 3110th grade: 7711th grade: 9412th grade, no diploma: 125High school graduate (or equivalency): 1,944Less than 1 year of college: 332Some college more than 1 year, no degree: 1,497Associate degree: 551Bachelor's degree: 861Master's degree: 611Professional school degree: 89Doctorate degree: 29
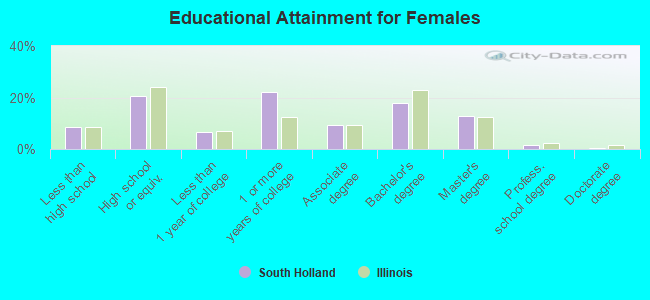
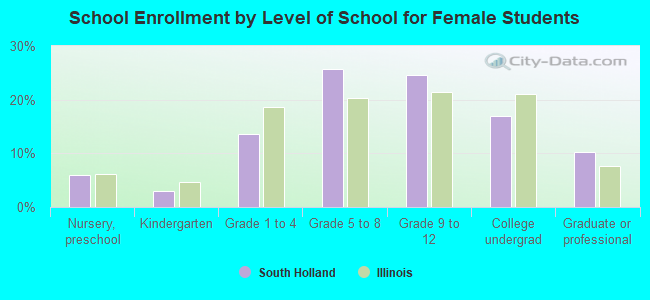
Education attainment for females 25 years and older:
No schooling: 102Nursery to 4th grade: 05th and 6th grade: 27th and 8th grade: 1069th grade: 7310th grade: 2211th grade: 6012th grade, no diploma: 332High school graduate (or equivalency): 1,667Less than 1 year of college: 528Some college more than 1 year, no degree: 1,794Associate degree: 758Bachelor's degree: 1,429Master's degree: 1,029Professional school degree: 115Doctorate degree: 46
Housing units in structures:
One, detached: 7,715One, attached: 180Two: 313 or 4: 655 to 9: 1610 to 19: 4120 to 49: 1550 or more: 66Mobile homes: 5Housing units lacking complete plumbing facilities in 2022: 2.1%Housing units lacking complete kitchen facilities in 2022: 0.9%House/condo owner moved in on average 16 years ago
Renter moved in on average 5 years ago
Private vs. public school enrollment:
Students in private schools in grades 1 to 8 (elementary and middle school): 150 Students in private schools in grades 9 to 12 (high school): 161 Students in private undergraduate colleges: 318