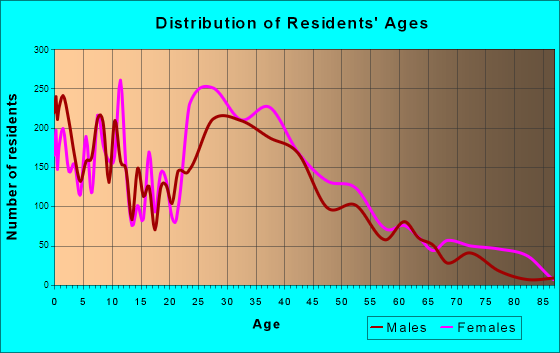
South Laurel, MD (Maryland) Houses and Residents
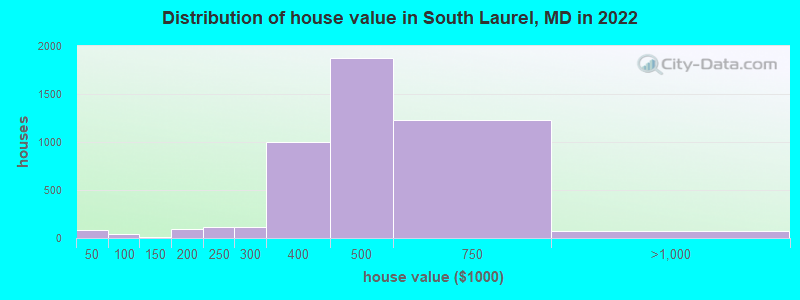
Estimated median house or condo value in 2022: $464,782 (it was $166,200 in 2000 )
South Laurel:
$464,782Maryland:
$398,100
Lower value quartile - upper value quartile: $368,965 - $536,862Total population: 26,112 (Urban population: 20,790, Rural population: 0)
Houses: 11,404 (10,967 occupied: 4,421 owner occupied, 6,596 renter occupied )
% of renters here:
60%State:
32%
Housing density: 2,665 houses/condos per square mile
Median price asked for vacant for-sale houses and condos in 2022: $706,788.
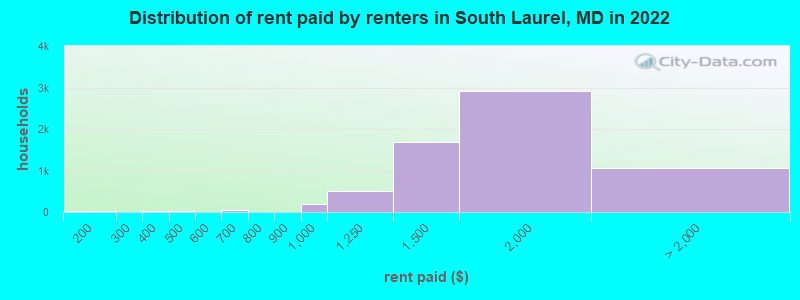
Median contract rent in 2022: $1,559 (lower quartile is $1,325, upper quartile is $1,846)
Median rent asked for vacant for-rent units in 2022: $2,285
Median gross rent in South Laurel, MD in 2022: $1,695
Housing units in South Laurel with a mortgage: 3,173 (285 second mortgage, 22 home equity loan, 201 both second mortgage and home equity loan )Houses without a mortgage: 38
Median household income for houses/condos with a mortgage: $143,540
Median household income for apartments without a mortgage: $105,912
Median monthly housing costs: $1,680
Data:
Median house or condo value ($)
Median house or condo value ($ change since 2000)
Median house or condo value ($) - White
Median house or condo value ($) - Black or African American
Median house or condo value ($) - Asian
Median house or condo value ($) - Hispanic or Latino
Median house or condo value ($) - American Indian and Alaska Native
Median house or condo value ($) - Multirace
Median house or condo value ($) - Other Race
Median price asked for mobile homes ($)
Household density (households per square mile)
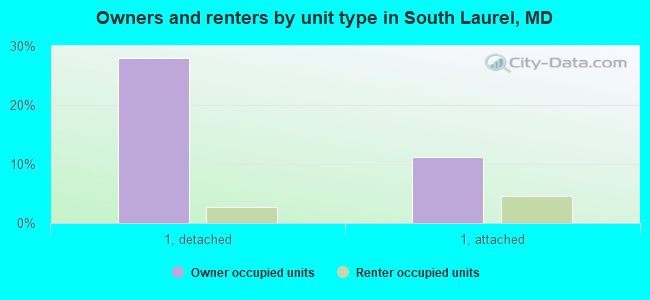
Mean house or condo value by units in structure - 1, detached ($)
Mean house or condo value by units in structure - 1, attached ($)
Mean house or condo value by units in structure - 2 ($)
Mean house or condo value by units in structure by units in structure - 3 or 4 ($)
Mean house or condo value by units in structure - 5 or more ($)
Mean house or condo value by units in structure - Boat, RV, van, etc. ($)
Mean house or condo value by units in structure - Mobile home ($)
Median contract rent ($)
Median contract rent - Lower quartile ($)
Median contract rent - Upper quartile ($)
Median gross rent ($)
Urban houses (%)
Rural houses (%)
Houses occupied (%)
Houses occupied (% change since 2000)
Houses owner occupied (%)
Houses owner occupied (% change since 2000)
Houses renter occupied (%)
Houses renter occupied (% change since 2000)
Vacant housing units - For rent (%)
Vacant housing units - For rent (% change since 2000)
Vacant housing units - For sale only (%)
Vacant housing units - For sale only (% change since 2000)
Vacant housing units - Rented or sold, not occupied (%)
Vacant housing units - Rented or sold, not occupied (% change since 2000)
Vacant housing units - For seasonal, recreational, or occasional use (%)
Vacant housing units - For seasonal, recreational, or occasional use (% change since 2000)
Vacant housing units - For migrant workers (%)
Vacant housing units - For migrant workers (% change since 2000)
Vacant housing units - Other vacant (%)
Vacant housing units - Other vacant (% change since 2000)
Median monthly housing costs ($)
Median household income for houses/condos with a mortgage ($)
Median household income for houses/condos without a mortgage ($)
Median household income ($)
Median household income ($) - White
Median household income ($) - Black or African American
Median household income ($) - Asian
Median household income ($) - Hispanic or Latino
Median household income ($) - American Indian and Alaska Native
Median household income ($) - Multirace
Median household income ($) - Other Race
Mortgage status - with mortgage (%)
Mortgage status - with second mortgage (%)
Mortgage status - with home equity loan (%)
Mortgage status - with both second mortgage and home equity loan (%)
Mortgage status - without a mortgage (%)
Median year house/condo built
Median year apartment built
Household type by relationship - Male householder living alone (%)
Household type by relationship - Male householder not living alone (%)
Household type by relationship - Female householder living alone (%)
Household type by relationship - Female householder not living alone (%)
Household type by relationship - Opposite-Sex spouse (%)
Household type by relationship - Same-Sex spouse (%)
Household type by relationship - Opposite-Sex unmarried partner (%)
Household type by relationship - Same-Sex unmarried partner (%)
Household type by relationship - In group quarters (%)
Size of family households - 2-person household (%)
Size of family households - 3-person household (%)
Size of family households - 4-person household (%)
Size of family households - 5-person household (%)
Size of family households - 6-person household (%)
Size of family households - 7-or-more-person household (%)
Size of nonfamily households - 1-person household (%)
Size of nonfamily households - 2-person household (%)
Size of nonfamily households - 3-person household (%)
Size of nonfamily households - 4-person household (%)
Size of nonfamily households - 5-person household (%)
Size of nonfamily households - 6-person household (%)
Size of nonfamily households - 7-or-moreperson household (%)
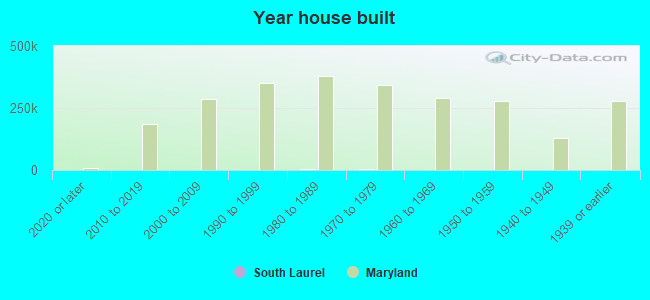
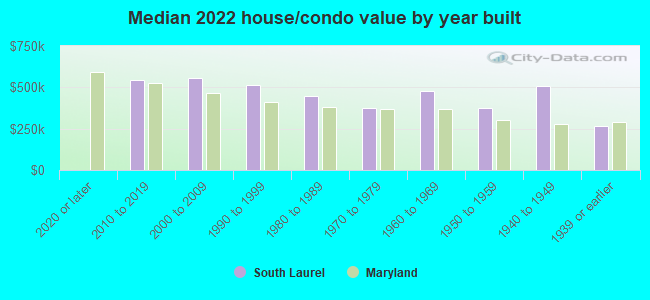
Year house built - Built 2010 or later (%)
Year house built - Built 2000 to 2009 (%)
Year house built - Built 1990 to 1999 (%)
Year house built - Built 1980 to 1989 (%)
Year house built - Built 1970 to 1979 (%)
Year house built - Built 1960 to 1969 (%)
Year house built - Built 1950 to 1959 (%)
Year house built - Built 1940 to 1949 (%)
Year house built - Built 1939 or earlier (%)
Median number of rooms in houses and condos
Median number of rooms in apartments
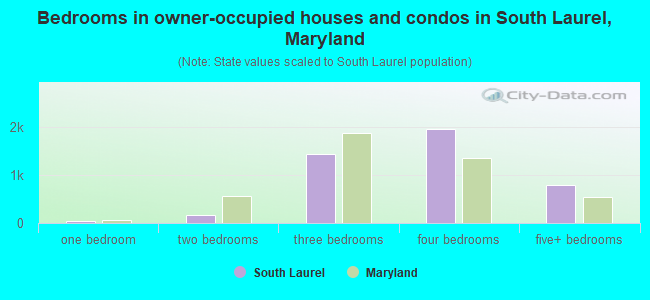
Median number of bedrooms in owner occupied houses
Mean number of bedrooms in owner occupied houses
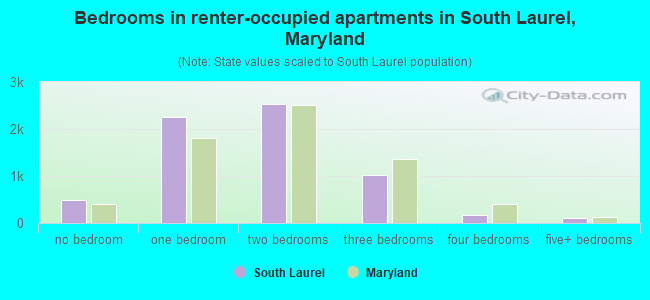
Median number of bedrooms in renter occupied houses
Mean number of bedrooms in renter occupied houses
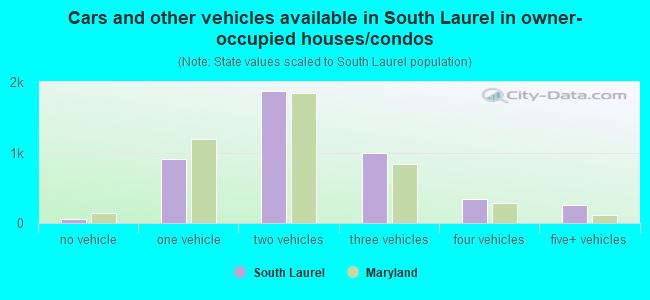
Median number of vehichles in owner occupied houses
Mean number of vehichles in owner occupied houses
Median number of vehichles in renter occupied houses
Mean number of vehichles in renter occupied houses
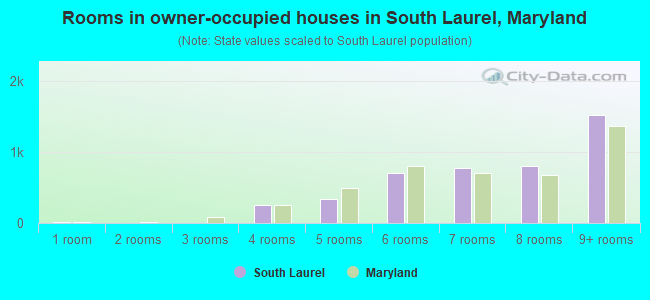
Rooms in owner-occupied houses - 1 room (%)
Rooms in owner-occupied houses - 2 rooms (%)
Rooms in owner-occupied houses - 3 rooms (%)
Rooms in owner-occupied houses - 4 rooms (%)
Rooms in owner-occupied houses - 5 rooms (%)
Rooms in owner-occupied houses - 6 rooms (%)
Rooms in owner-occupied houses - 7 rooms (%)
Rooms in owner-occupied houses - 8 rooms (%)
Rooms in owner-occupied houses - 9+ rooms (%)
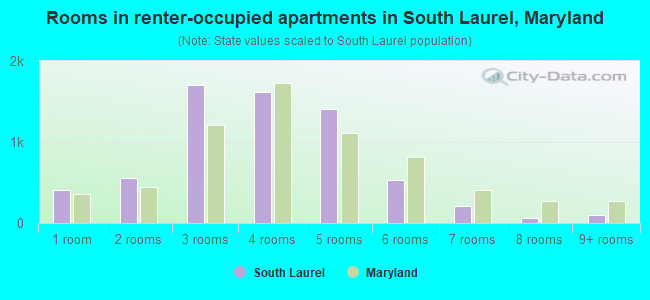
Rooms in renter-occupied houses - 1 room (%)
Rooms in renter-occupied houses - 2 rooms (%)
Rooms in renter-occupied houses - 3 rooms (%)
Rooms in renter-occupied houses - 4 rooms (%)
Rooms in renter-occupied houses - 5 rooms (%)
Rooms in renter-occupied houses - 6 rooms (%)
Rooms in renter-occupied houses - 7 rooms (%)
Rooms in renter-occupied houses - 8 rooms (%)
Rooms in renter-occupied houses - 9+ rooms (%)
Bedrooms in owner-occupied houses - no bedrooms (%)
Bedrooms in owner-occupied houses - 1 bedroom (%)
Bedrooms in owner-occupied houses - 2 bedrooms (%)
Bedrooms in owner-occupied houses - 3 bedrooms (%)
Bedrooms in owner-occupied houses - 4 bedrooms (%)
Bedrooms in owner-occupied houses - 5+ bedrooms (%)
Bedrooms in renter-occupied houses - no bedrooms (%)
Bedrooms in renter-occupied houses - 1 bedroom (%)
Bedrooms in renter-occupied houses - 2 bedrooms (%)
Bedrooms in renter-occupied houses - 3 bedrooms (%)
Bedrooms in renter-occupied houses - 4 bedrooms (%)
Bedrooms in renter-occupied houses - 5+ bedrooms (%)
Vehicles available in owner-occupied houses - no vehicle available (%)
Vehicles available in owner-occupied houses - 1 vehicle available(%)
Vehicles available in owner-occupied houses - 2 Vehicles available (%)
Vehicles available in owner-occupied houses - 3 Vehicles available (%)
Vehicles available in owner-occupied houses - 4 Vehicles available (%)
Vehicles available in owner-occupied houses - 5+ Vehicles available (%)
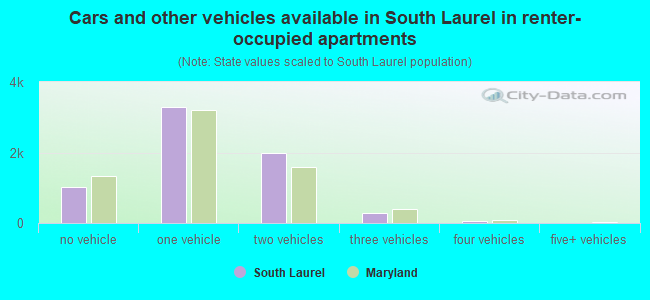
Vehicles available in renter-occupied houses - no vehicle available (%)
Vehicles available in renter-occupied houses - 1 vehicle available (%)
Vehicles available in renter-occupied houses - 2 Vehicles available (%)
Vehicles available in renter-occupied houses - 3 Vehicles available (%)
Vehicles available in renter-occupied houses - 4 Vehicles available (%)
Vehicles available in renter-occupied houses - 5+ Vehicles available (%)
Housing units in structures - 1, detached (%)
Housing units in structures - 1, attached (%)
Housing units in structures - 2 (%)
Housing units in structures - 3 or 4 (%)
Housing units in structures - 5 to 9 (%)
Housing units in structures - 10 to 19 (%)
Housing units in structures - 20 to 49 (%)
Housing units in structures - 50 or more (%)
Housing units in structures - Mobile home (%)
Housing units in structures - Boat, RV, van, etc. (%)
Housing units in structures - Owners - 1, detached (%)
Housing units in structures - Owners - 1, attached (%)
Housing units in structures - Owners - 2 (%)
Housing units in structures - Owners - 3 or 4 (%)
Housing units in structures - Owners - 5 to 9 (%)
Housing units in structures - Owners - 10 to 19 (%)
Housing units in structures - Owners - 20 to 49 (%)
Housing units in structures - Owners - 50 or more (%)
Housing units in structures - Owners - Mobile home (%)
Housing units in structures - Owners - Boat, RV, van, etc. (%)
Housing units in structures - Renters - 1, detached (%)
Housing units in structures - Renters - 1, attached (%)
Housing units in structures - Renters - 2 (%)
Housing units in structures - Renters - 3 or 4 (%)
Housing units in structures - Renters - 5 to 9 (%)
Housing units in structures - Renters - 10 to 19 (%)
Housing units in structures - Renters - 20 to 49 (%)
Housing units in structures - Renters - 50 or more (%)
Housing units in structures - Renters - Mobile home (%)
Housing units in structures - Renters - Boat, RV, van, etc. (%)
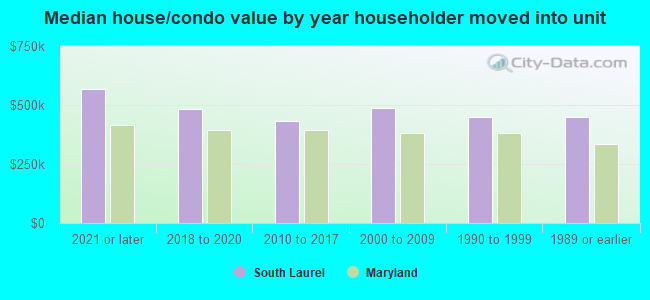
House/condo owner moved in on average (years ago)
Renter moved in on average (years ago)
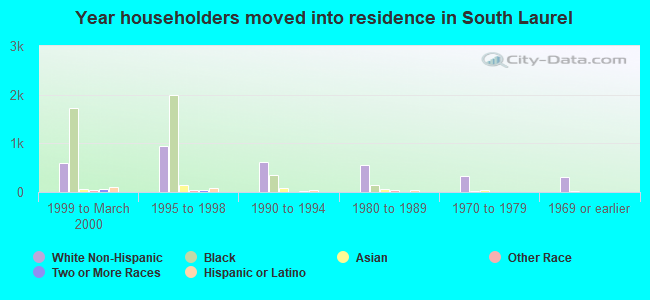
Year householder moved into unit - Moved in 1999 to March 2000 (%)
Year householder moved into unit - Moved in 1999 to March 2000 (%) - White
Year householder moved into unit - Moved in 1999 to March 2000 (%) - Black or African American
Year householder moved into unit - Moved in 1999 to March 2000 (%) - Asian
Year householder moved into unit - Moved in 1999 to March 2000 (%) - Hispanic or Latino
Year householder moved into unit - Moved in 1999 to March 2000 (%) - American Indian and Alaska Native
Year householder moved into unit - Moved in 1999 to March 2000 (%) - Multirace
Year householder moved into unit - Moved in 1999 to March 2000 (%) - Other Race
Year householder moved into unit - Moved in 1995 to 1998 (%)
Year householder moved into unit - Moved in 1995 to 1998 (%) - White
Year householder moved into unit - Moved in 1995 to 1998 (%) - Black or African American
Year householder moved into unit - Moved in 1995 to 1998 (%) - Asian
Year householder moved into unit - Moved in 1995 to 1998 (%) - Hispanic or Latino
Year householder moved into unit - Moved in 1995 to 1998 (%) - American Indian and Alaska Native
Year householder moved into unit - Moved in 1995 to 1998 (%) - Multirace
Year householder moved into unit - Moved in 1995 to 1998 (%) - Other Race
Year householder moved into unit - Moved in 1990 to 1994 (%)
Year householder moved into unit - Moved in 1990 to 1994 (%) - White
Year householder moved into unit - Moved in 1990 to 1994 (%) - Black or African American
Year householder moved into unit - Moved in 1990 to 1994 (%) - Asian
Year householder moved into unit - Moved in 1990 to 1994 (%) - Hispanic or Latino
Year householder moved into unit - Moved in 1990 to 1994 (%) - American Indian and Alaska Native
Year householder moved into unit - Moved in 1990 to 1994 (%) - Multirace
Year householder moved into unit - Moved in 1990 to 1994 (%) - Other Race
Year householder moved into unit - Moved in 1980 to 1989 (%)
Year householder moved into unit - Moved in 1980 to 1989 (%) - White
Year householder moved into unit - Moved in 1980 to 1989 (%) - Black or African American
Year householder moved into unit - Moved in 1980 to 1989 (%) - Asian
Year householder moved into unit - Moved in 1980 to 1989 (%) - Hispanic or Latino
Year householder moved into unit - Moved in 1980 to 1989 (%) - American Indian and Alaska Native
Year householder moved into unit - Moved in 1980 to 1989 (%) - Multirace
Year householder moved into unit - Moved in 1980 to 1989 (%) - Other Race
Year householder moved into unit - Moved in 1970 to 1979 (%)
Year householder moved into unit - Moved in 1970 to 1979 (%) - White
Year householder moved into unit - Moved in 1970 to 1979 (%) - Black or African American
Year householder moved into unit - Moved in 1970 to 1979 (%) - Asian
Year householder moved into unit - Moved in 1970 to 1979 (%) - Hispanic or Latino
Year householder moved into unit - Moved in 1970 to 1979 (%) - American Indian and Alaska Native
Year householder moved into unit - Moved in 1970 to 1979 (%) - Multirace
Year householder moved into unit - Moved in 1970 to 1979 (%) - Other Race
Year householder moved into unit - Moved in 1969 or earlier (%)
Year householder moved into unit - Moved in 1969 or earlier (%) - White
Year householder moved into unit - Moved in 1969 or earlier (%) - Black or African American
Year householder moved into unit - Moved in 1969 or earlier (%) - Asian
Year householder moved into unit - Moved in 1969 or earlier (%) - Hispanic or Latino
Year householder moved into unit - Moved in 1969 or earlier (%) - American Indian and Alaska Native
Year householder moved into unit - Moved in 1969 or earlier (%) - Multirace
Year householder moved into unit - Moved in 1969 or earlier (%) - Other Race
Housing units lacking complete plumbing facilities (%)
Housing units lacking complete kitchen facilities (%)
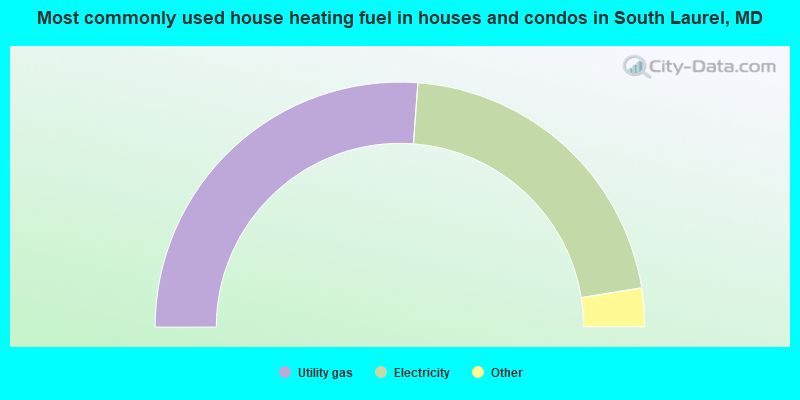
House heating fuel used in houses and condos - Utility gas (%)
House heating fuel used in houses and condos - Bottled, tank, or LP gas (%)
House heating fuel used in houses and condos - Electricity (%)
House heating fuel used in houses and condos - Fuel oil, kerosene, etc. (%)
House heating fuel used in houses and condos - Coal or coke (%)
House heating fuel used in houses and condos - Wood (%)
House heating fuel used in houses and condos - Solar energy (%)
House heating fuel used in houses and condos - Other fuel (%)
House heating fuel used in houses and condos - No fuel used (%)
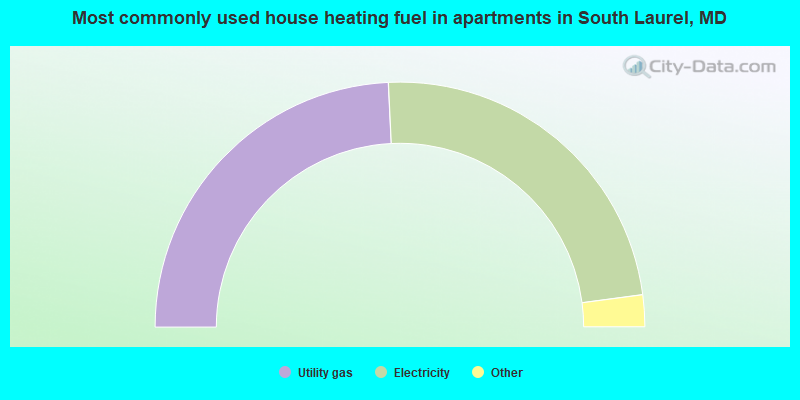
House heating fuel used in apartments - Utility gas (%)
House heating fuel used in apartments - Bottled, tank, or LP gas (%)
House heating fuel used in apartments - Electricity (%)
House heating fuel used in apartments - Fuel oil, kerosene, etc. (%)
House heating fuel used in apartments - Coal or coke (%)
House heating fuel used in apartments - Wood (%)
House heating fuel used in apartments - Solar energy (%)
House heating fuel used in apartments - Other fuel (%)
House heating fuel used in apartments - No fuel used (%)
Median year house/condo built: 1986Median year apartment built: 1978Household type by relationship:
Households: 28,123
Male householders: 4,802 (1,425 living alone ), Female householders: 5,905 (1,936 living alone )3,810 spouses (3,718 opposite-sex spouses ), 1,052 unmarried partners , (985 opposite-sex unmarried partners ), 8,357 children (8,146 natural , 59 adopted , 152 stepchildren ), 358 grandchildren , 580 brothers or sisters , 399 parents , 34 foster children , 1,163 other relatives , 1,268 non-relatives In group quarters: 389
Size of family households: 2,926 2-persons , 1,603 3-persons , 1,269 4-persons , 741 5-persons , 255 6-persons , 192 7-or-more-persons .
Size of nonfamily households: 3,308 1-person , 496 2-persons , 47 3-persons , 82 4-persons , 71 5-persons , 21 7-or-more-persons .
2,772 married couples with children. single-parent households (581 men , 2,306 women ).
66.8% of residents of South Laurel speak English at home. of residents speak Spanish at home (52% speak English very well , 31% speak English well , 12% speak English not well , 5% don't speak English at all ).of residents speak other Indo-European language at home (78% speak English very well , 13% speak English well , 8% speak English not well ).of residents speak Asian or Pacific Island language at home (63% speak English very well , 17% speak English well , 14% speak English not well , 6% don't speak English at all ).of residents speak other language at home (90% speak English very well , 8% speak English well , 2% speak English not well ).
Foreign born population: 9,118 (32.4%)of them are naturalized citizens )
Median number of rooms in houses and condos:
Median number of rooms in apartments
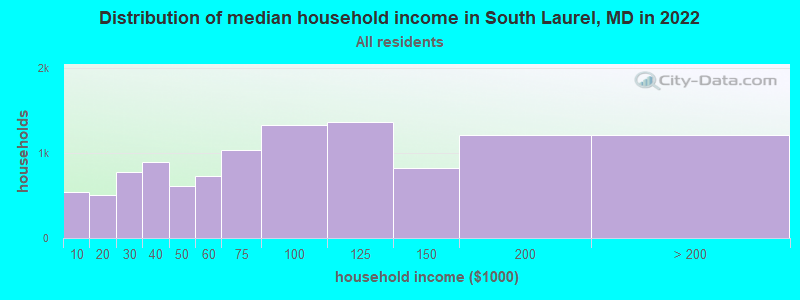
South Laurel, MD household income distribution 537 Less than $10,000511 $10,000 to $19,999772 $20,000 to $29,999893 $30,000 to $39,999612 $40,000 to $49,999734 $50,000 to $59,9991,040 $60,000 to $74,9991,330 $75,000 to $99,9991,366 $100,000 to $124,999822 $125,000 to $149,9991,208 $150,000 to $199,9991,217 $200,000 or more
Home value of owner - occupied houses in 2022 in South Laurel, MD 23 Less than $10,00050 $15,000 to $19,99910 $30,000 to $34,99932 $50,000 to $59,99910 $80,000 to $89,99911 $125,000 to $149,99929 $150,000 to $174,99959 $175,000 to $199,999112 $200,000 to $249,999117 $250,000 to $299,999996 $300,000 to $399,9991,879 $400,000 to $499,9991,228 $500,000 to $749,99943 $750,000 to $999,99927 $1,000,000 to $1,499,999Rent paid by renters in 2022 in South Laurel, MD 34 $150 to $19920 $350 to $39914 $400 to $44917 $600 to $64935 $650 to $69910 $800 to $899186 $900 to $999511 $1,000 to $1,2491,697 $1,250 to $1,4992,906 $1,500 to $1,999656 $2,000 to $2,49967 $2,500 to $2,99912 $3,000 to $3,49911 $3,500 or more309 No cash rent
Percentage of workers working in this county: 52.0%Number of people working at home: 2,426 (16.0% of all workers )
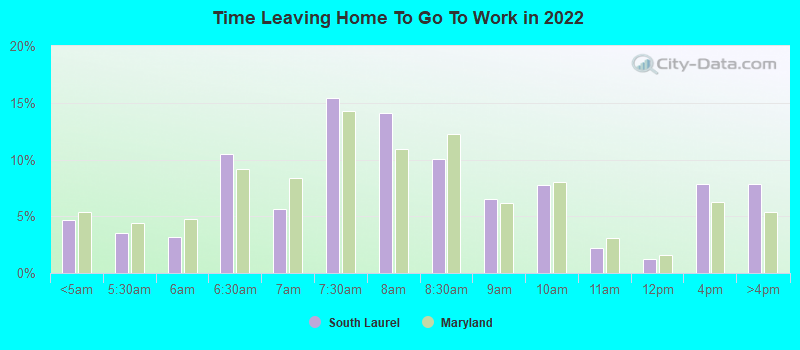
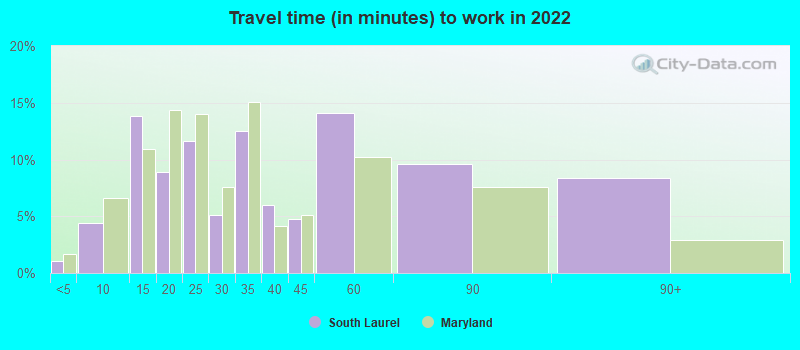
Travel time to work (commute)
Less than 5 minutes: 135 to 9 minutes: 28410 to 14 minutes: 1,25615 to 19 minutes: 1,50520 to 24 minutes: 2,04125 to 29 minutes: 62330 to 34 minutes: 1,94935 to 39 minutes: 68640 to 44 minutes: 91245 to 59 minutes: 1,95860 to 89 minutes: 1,16190 or more minutes: 343
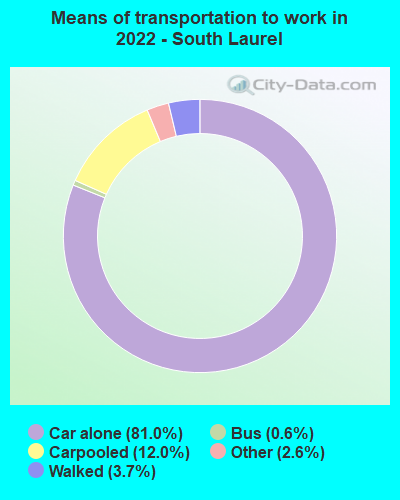
Means of transportation to work:
Drove a car alone: 2,879 (51.5%)Carpooled: 387 (6.9%)Bus : 15 (0.3%)Taxi: 120 (2.1%)Walked: 130 (2.3%)Worked at home: 2,426 (43.4%)
Unemployment by race in 2022
Unemployment rate for White non-Hispanic residents 11.1% Males4.2% FemalesUnemployment rate for Black residents 8.0% Males3.1% FemalesUnemployment rate for Asian residents 3.2% MalesUnemployment rate for other race residents 2.0% FemalesUnemployment rate for two or more race residents 3.9% FemalesUnemployment rate for Hispanic or Latino residents 0.3% Males1.6% Females
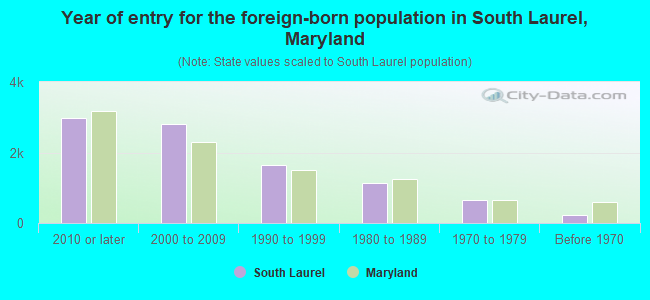
Year of entry for the foreign-born population in South Laurel, Maryland
2,985 2010 or later 2,817 2000 to 2009 1,642 1990 to 1999 1,139 1980 to 1989 647 1970 to 1979 233 Before 1970
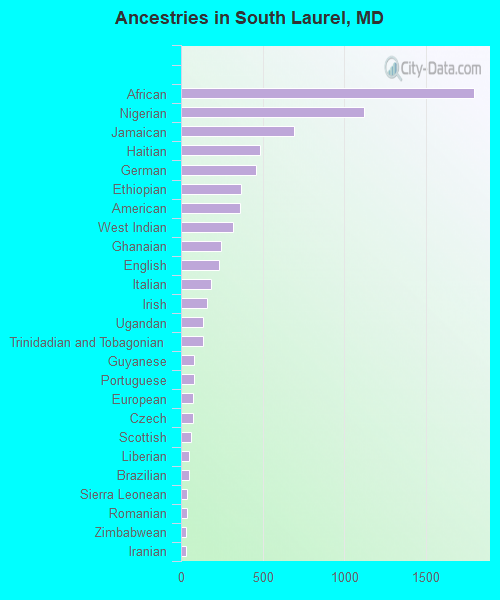
First ancestries reported:
African: 1,797 (9.3%)
Nigerian: 1,124 (5.8%)
Jamaican: 693 (3.6%)
Haitian: 485 (2.5%)
German: 458 (2.4%)
Ethiopian: 370 (1.9%)
American: 359 (1.9%)
West Indian: 320 (1.7%)
Ghanaian: 247 (1.3%)
English: 235 (1.2%)
Italian: 181 (0.9%)
Irish: 158 (0.8%)
Ugandan: 134 (0.7%)
Trinidadian and Tobagonian: 133 (0.7%)
Guyanese: 81 (0.4%)
Portuguese: 79 (0.4%)
European: 75 (0.4%)
Czech: 73 (0.4%)
Scottish: 62 (0.3%)
Liberian: 51 (0.3%)
Brazilian: 50 (0.3%)
Sierra Leonean: 36 (0.2%)
Romanian: 35 (0.2%)
Zimbabwean: 33 (0.2%)
Iranian: 31 (0.2%)
Scotch-Irish: 22 (0.1%)
Polish: 22 (0.1%)
Norwegian: 21 (0.1%)
U.S. Virgin Islander: 20 (0.1%)
Egyptian: 18 (0.09%)
French: 15 (0.08%)
Russian: 14 (0.07%)
Dutch: 12 (0.06%)
Finnish: 11 (0.06%)
Greek: 10 (0.05%)
Swedish: 10 (0.05%)
British: 9 (0.05%)
Kenyan: 8 (0.04%)
Eastern European: 4 (0.02%)
Lithuanian: 3 (0.02%) Most common places of birth for foreign-born residents (%): Nigeria South Laurel:
15.0% (1,348)Maryland:
4.6% (44,825)
Cameroon South Laurel:
13.8% (1,237)Maryland:
2.5% (23,969)
El Salvador South Laurel:
8.9% (801)Maryland:
12.0% (115,412)
Jamaica South Laurel:
7.6% (686)Maryland:
2.8% (27,444)
Mexico South Laurel:
7.1% (634)Maryland:
3.5% (34,065)
Ghana South Laurel:
4.1% (369)Maryland:
1.8% (17,774)
Trinidad and Tobago South Laurel:
3.9% (351)Maryland:
1.2% (11,481)
India South Laurel:
3.7% (332)Maryland:
6.4% (61,725)
Dominican Republic South Laurel:
2.9% (260)Maryland:
1.4% (13,947)
Ethiopia South Laurel:
2.8% (255)Maryland:
3.2% (30,870)
Sierra Leone South Laurel:
2.7% (239)Maryland:
1.1% (10,233)
Colombia South Laurel:
2.2% (197)Maryland:
1.3% (12,898)
Philippines South Laurel:
2.2% (195)Maryland:
3.8% (36,698)
Uganda South Laurel:
1.8% (166)Maryland:
0.2% (1,672)
Guatemala South Laurel:
1.8% (159)Maryland:
4.4% (42,350)
Haiti South Laurel:
1.6% (147)Maryland:
0.9% (9,100)
Place of birth for U.S.-born residents:
This state: 8,463Other state: 10,255Northeast: 2,736Midwest: 690South: 6,247West: 758 89.3% of South Laurel residents lived in the same house 1 years ago.
Out of people who lived in different houses, 32.8% lived in this county.
Out of people who lived in different counties, 82.1% lived in Maryland.
South Laurel:
89.3%State average:
88.5%
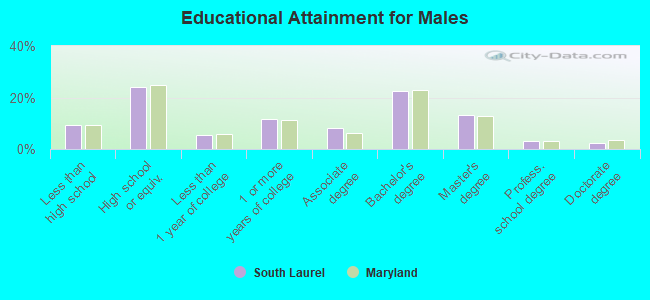
Education attainment for males 25 years and older:
No schooling: 200Nursery to 4th grade: 445th and 6th grade: 287th and 8th grade: 679th grade: 2510th grade: 7411th grade: 7412th grade, no diploma: 304High school graduate (or equivalency): 2,125Less than 1 year of college: 489Some college more than 1 year, no degree: 1,031Associate degree: 716Bachelor's degree: 1,964Master's degree: 1,166Professional school degree: 279Doctorate degree: 200
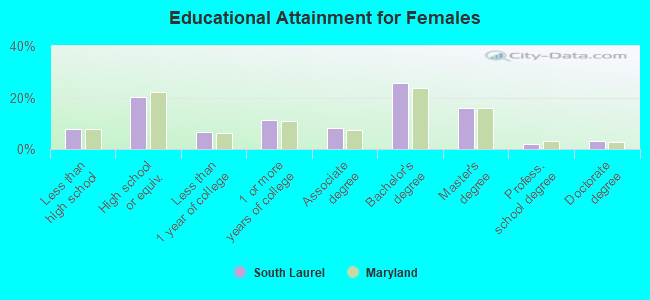
Education attainment for females 25 years and older:
No schooling: 208Nursery to 4th grade: 05th and 6th grade: 247th and 8th grade: 739th grade: 9810th grade: 2311th grade: 17412th grade, no diploma: 240High school graduate (or equivalency): 2,121Less than 1 year of college: 678Some college more than 1 year, no degree: 1,173Associate degree: 842Bachelor's degree: 2,687Master's degree: 1,666Professional school degree: 224Doctorate degree: 325
Housing units in structures:
One, detached: 3,512One, attached: 1,646Two: 653 or 4: 2005 to 9: 1,55910 to 19: 3,33520 to 49: 15650 or more: 879Mobile homes: 48Housing units lacking complete plumbing facilities in 2022: 0.4%Housing units lacking complete kitchen facilities in 2022: 0.2%House/condo owner moved in on average 14 years ago
Renter moved in on average 2 years ago
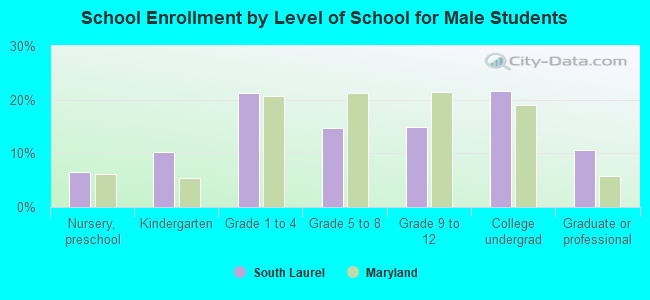
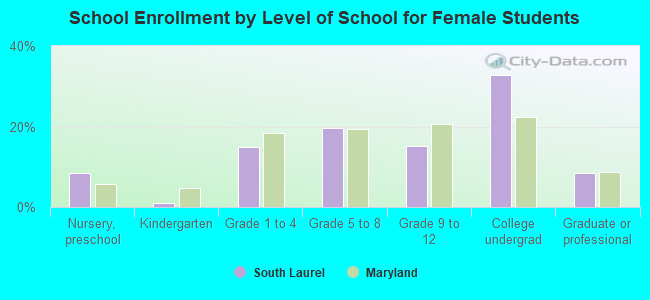
Private vs. public school enrollment:
Students in private schools in grades 1 to 8 (elementary and middle school): 306 Students in private schools in grades 9 to 12 (high school): 213 Students in private undergraduate colleges: 737