South Miami, FL (Florida) Houses and Residents
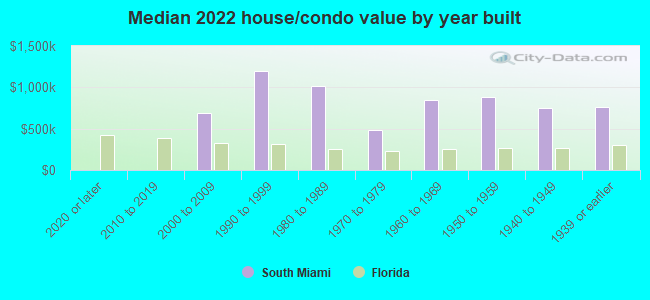
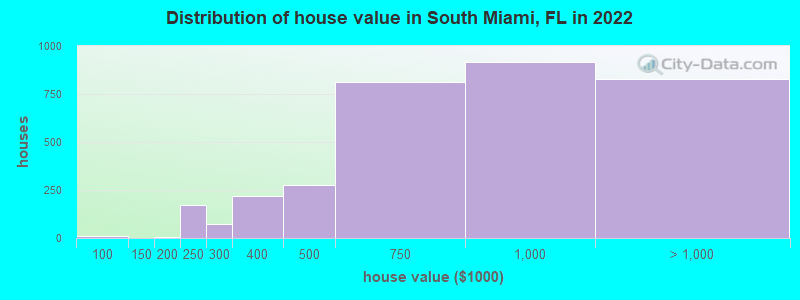
Estimated median house or condo value in 2022: $811,020 (it was $164,200 in 2000 )
South Miami:
$811,020Florida:
$354,100
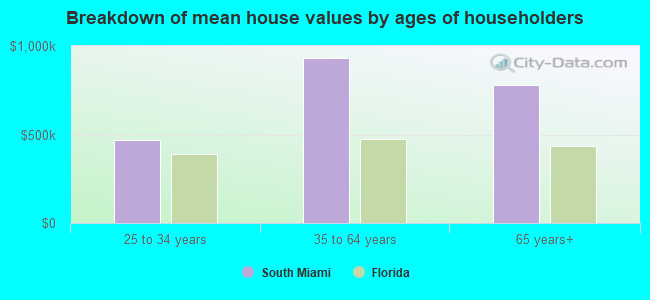
Lower value quartile - upper value quartile: $482,281 - $1,155,338Mean price in 2022: Detached houses: $697,855 Here:
$697,855State:
$500,941
Townhouses or other attached units: $470,536 Here:
$470,536State:
$370,869
In 5-or-more-unit structures: $343,662 Here:
$343,662State:
$447,145
Total population: 12,183 (Urban population: 10,939, Rural population: 0)
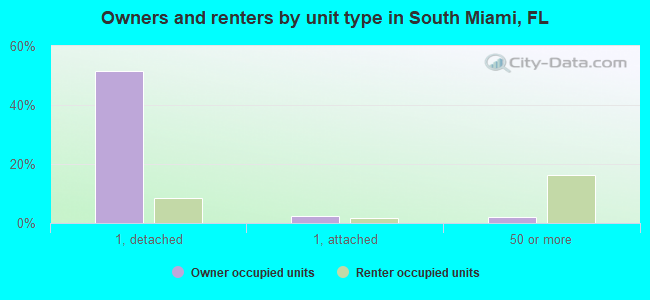
Houses: 5,203 (4,825 occupied: 2,805 owner occupied, 2,083 renter occupied )
% of renters here:
43%State:
33%
Housing density: 2,267 houses/condos per square mile
Median price asked for vacant for-sale houses and condos in 2022: $1,964,788.
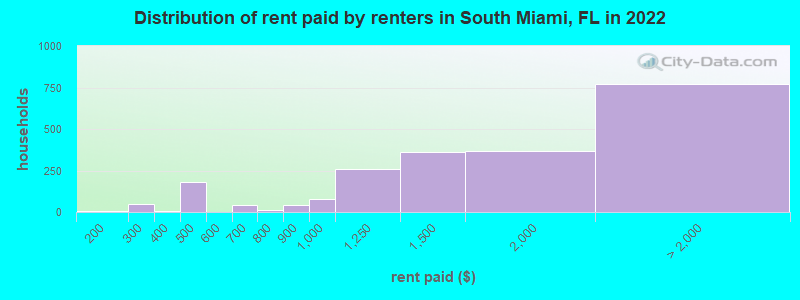
Median contract rent in 2022: $1,539 (lower quartile is $1,152, upper quartile is over $2,000)
Median rent asked for vacant for-rent units in 2022: $2,352
Median gross rent in South Miami, FL in 2022: $1,604
Housing units in South Miami with a mortgage: 1,599 (227 second mortgage, 0 home equity loan, 194 both second mortgage and home equity loan )Houses without a mortgage: 0
Median household income for houses/condos with a mortgage: $206,676
Median household income for apartments without a mortgage: $83,483
Median monthly housing costs: $1,853
Data:
Median house or condo value ($)
Median house or condo value ($ change since 2000)
Median house or condo value ($) - White
Median house or condo value ($) - Black or African American
Median house or condo value ($) - Asian
Median house or condo value ($) - Hispanic or Latino
Median house or condo value ($) - American Indian and Alaska Native
Median house or condo value ($) - Multirace
Median house or condo value ($) - Other Race
Median price asked for mobile homes ($)
Household density (households per square mile)
Mean house or condo value by units in structure - 1, detached ($)
Mean house or condo value by units in structure - 1, attached ($)
Mean house or condo value by units in structure - 2 ($)
Mean house or condo value by units in structure by units in structure - 3 or 4 ($)
Mean house or condo value by units in structure - 5 or more ($)
Mean house or condo value by units in structure - Boat, RV, van, etc. ($)
Mean house or condo value by units in structure - Mobile home ($)
Median contract rent ($)
Median contract rent - Lower quartile ($)
Median contract rent - Upper quartile ($)
Median gross rent ($)
Urban houses (%)
Rural houses (%)
Houses occupied (%)
Houses occupied (% change since 2000)
Houses owner occupied (%)
Houses owner occupied (% change since 2000)
Houses renter occupied (%)
Houses renter occupied (% change since 2000)
Vacant housing units - For rent (%)
Vacant housing units - For rent (% change since 2000)
Vacant housing units - For sale only (%)
Vacant housing units - For sale only (% change since 2000)
Vacant housing units - Rented or sold, not occupied (%)
Vacant housing units - Rented or sold, not occupied (% change since 2000)
Vacant housing units - For seasonal, recreational, or occasional use (%)
Vacant housing units - For seasonal, recreational, or occasional use (% change since 2000)
Vacant housing units - For migrant workers (%)
Vacant housing units - For migrant workers (% change since 2000)
Vacant housing units - Other vacant (%)
Vacant housing units - Other vacant (% change since 2000)
Median monthly housing costs ($)
Median household income for houses/condos with a mortgage ($)
Median household income for houses/condos without a mortgage ($)
Median household income ($)
Median household income ($) - White
Median household income ($) - Black or African American
Median household income ($) - Asian
Median household income ($) - Hispanic or Latino
Median household income ($) - American Indian and Alaska Native
Median household income ($) - Multirace
Median household income ($) - Other Race
Mortgage status - with mortgage (%)
Mortgage status - with second mortgage (%)
Mortgage status - with home equity loan (%)
Mortgage status - with both second mortgage and home equity loan (%)
Mortgage status - without a mortgage (%)
Median year house/condo built
Median year apartment built
Household type by relationship - Male householder living alone (%)
Household type by relationship - Male householder not living alone (%)
Household type by relationship - Female householder living alone (%)
Household type by relationship - Female householder not living alone (%)
Household type by relationship - Opposite-Sex spouse (%)
Household type by relationship - Same-Sex spouse (%)
Household type by relationship - Opposite-Sex unmarried partner (%)
Household type by relationship - Same-Sex unmarried partner (%)
Household type by relationship - In group quarters (%)
Size of family households - 2-person household (%)
Size of family households - 3-person household (%)
Size of family households - 4-person household (%)
Size of family households - 5-person household (%)
Size of family households - 6-person household (%)
Size of family households - 7-or-more-person household (%)
Size of nonfamily households - 1-person household (%)
Size of nonfamily households - 2-person household (%)
Size of nonfamily households - 3-person household (%)
Size of nonfamily households - 4-person household (%)
Size of nonfamily households - 5-person household (%)
Size of nonfamily households - 6-person household (%)
Size of nonfamily households - 7-or-moreperson household (%)
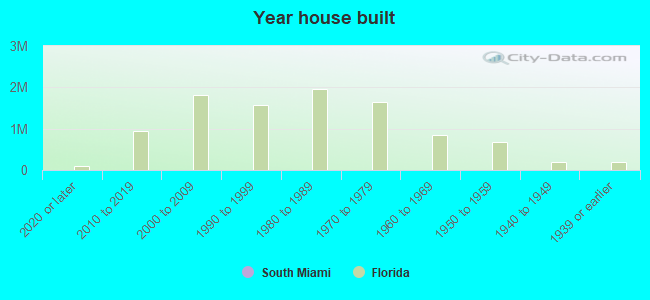
Year house built - Built 2010 or later (%)
Year house built - Built 2000 to 2009 (%)
Year house built - Built 1990 to 1999 (%)
Year house built - Built 1980 to 1989 (%)
Year house built - Built 1970 to 1979 (%)
Year house built - Built 1960 to 1969 (%)
Year house built - Built 1950 to 1959 (%)
Year house built - Built 1940 to 1949 (%)
Year house built - Built 1939 or earlier (%)
Median number of rooms in houses and condos
Median number of rooms in apartments
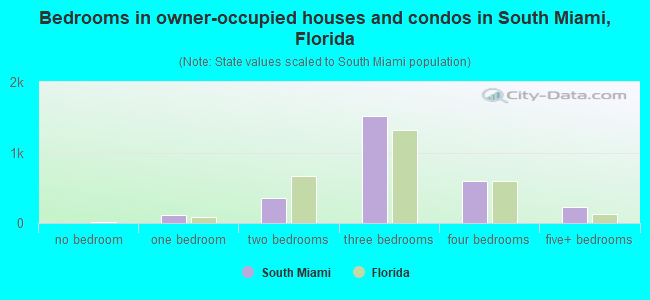
Median number of bedrooms in owner occupied houses
Mean number of bedrooms in owner occupied houses
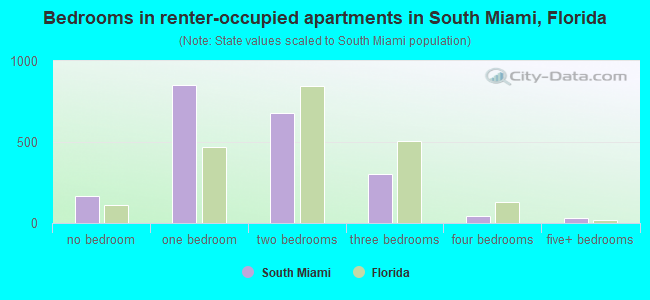
Median number of bedrooms in renter occupied houses
Mean number of bedrooms in renter occupied houses
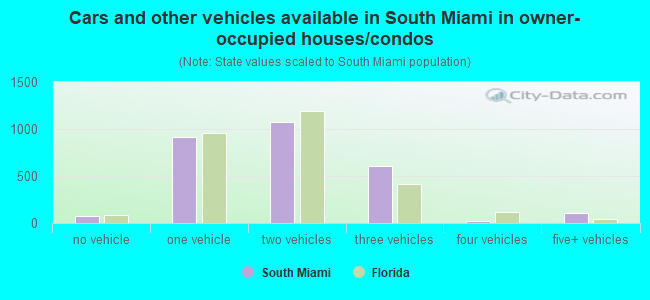
Median number of vehichles in owner occupied houses
Mean number of vehichles in owner occupied houses
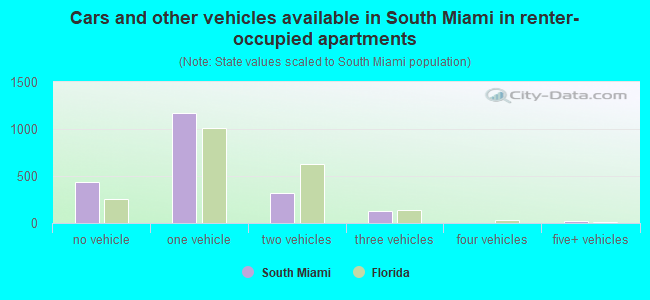
Median number of vehichles in renter occupied houses
Mean number of vehichles in renter occupied houses
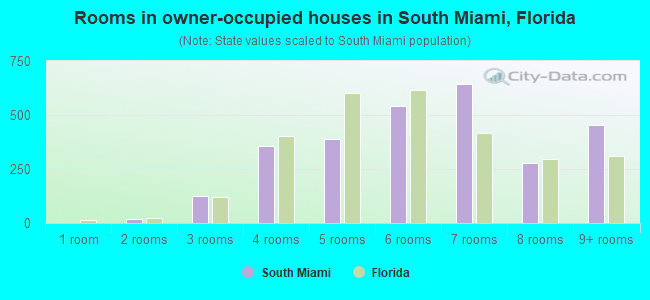
Rooms in owner-occupied houses - 1 room (%)
Rooms in owner-occupied houses - 2 rooms (%)
Rooms in owner-occupied houses - 3 rooms (%)
Rooms in owner-occupied houses - 4 rooms (%)
Rooms in owner-occupied houses - 5 rooms (%)
Rooms in owner-occupied houses - 6 rooms (%)
Rooms in owner-occupied houses - 7 rooms (%)
Rooms in owner-occupied houses - 8 rooms (%)
Rooms in owner-occupied houses - 9+ rooms (%)
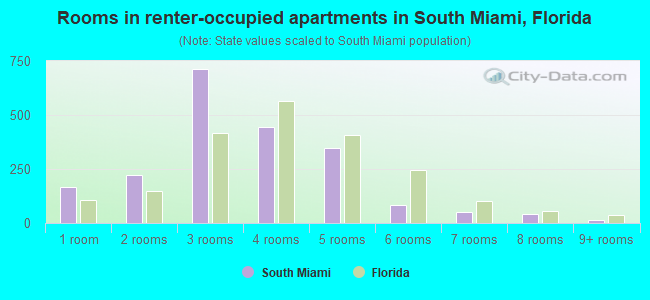
Rooms in renter-occupied houses - 1 room (%)
Rooms in renter-occupied houses - 2 rooms (%)
Rooms in renter-occupied houses - 3 rooms (%)
Rooms in renter-occupied houses - 4 rooms (%)
Rooms in renter-occupied houses - 5 rooms (%)
Rooms in renter-occupied houses - 6 rooms (%)
Rooms in renter-occupied houses - 7 rooms (%)
Rooms in renter-occupied houses - 8 rooms (%)
Rooms in renter-occupied houses - 9+ rooms (%)
Bedrooms in owner-occupied houses - no bedrooms (%)
Bedrooms in owner-occupied houses - 1 bedroom (%)
Bedrooms in owner-occupied houses - 2 bedrooms (%)
Bedrooms in owner-occupied houses - 3 bedrooms (%)
Bedrooms in owner-occupied houses - 4 bedrooms (%)
Bedrooms in owner-occupied houses - 5+ bedrooms (%)
Bedrooms in renter-occupied houses - no bedrooms (%)
Bedrooms in renter-occupied houses - 1 bedroom (%)
Bedrooms in renter-occupied houses - 2 bedrooms (%)
Bedrooms in renter-occupied houses - 3 bedrooms (%)
Bedrooms in renter-occupied houses - 4 bedrooms (%)
Bedrooms in renter-occupied houses - 5+ bedrooms (%)
Vehicles available in owner-occupied houses - no vehicle available (%)
Vehicles available in owner-occupied houses - 1 vehicle available(%)
Vehicles available in owner-occupied houses - 2 Vehicles available (%)
Vehicles available in owner-occupied houses - 3 Vehicles available (%)
Vehicles available in owner-occupied houses - 4 Vehicles available (%)
Vehicles available in owner-occupied houses - 5+ Vehicles available (%)
Vehicles available in renter-occupied houses - no vehicle available (%)
Vehicles available in renter-occupied houses - 1 vehicle available (%)
Vehicles available in renter-occupied houses - 2 Vehicles available (%)
Vehicles available in renter-occupied houses - 3 Vehicles available (%)
Vehicles available in renter-occupied houses - 4 Vehicles available (%)
Vehicles available in renter-occupied houses - 5+ Vehicles available (%)
Housing units in structures - 1, detached (%)
Housing units in structures - 1, attached (%)
Housing units in structures - 2 (%)
Housing units in structures - 3 or 4 (%)
Housing units in structures - 5 to 9 (%)
Housing units in structures - 10 to 19 (%)
Housing units in structures - 20 to 49 (%)
Housing units in structures - 50 or more (%)
Housing units in structures - Mobile home (%)
Housing units in structures - Boat, RV, van, etc. (%)
Housing units in structures - Owners - 1, detached (%)
Housing units in structures - Owners - 1, attached (%)
Housing units in structures - Owners - 2 (%)
Housing units in structures - Owners - 3 or 4 (%)
Housing units in structures - Owners - 5 to 9 (%)
Housing units in structures - Owners - 10 to 19 (%)
Housing units in structures - Owners - 20 to 49 (%)
Housing units in structures - Owners - 50 or more (%)
Housing units in structures - Owners - Mobile home (%)
Housing units in structures - Owners - Boat, RV, van, etc. (%)
Housing units in structures - Renters - 1, detached (%)
Housing units in structures - Renters - 1, attached (%)
Housing units in structures - Renters - 2 (%)
Housing units in structures - Renters - 3 or 4 (%)
Housing units in structures - Renters - 5 to 9 (%)
Housing units in structures - Renters - 10 to 19 (%)
Housing units in structures - Renters - 20 to 49 (%)
Housing units in structures - Renters - 50 or more (%)
Housing units in structures - Renters - Mobile home (%)
Housing units in structures - Renters - Boat, RV, van, etc. (%)
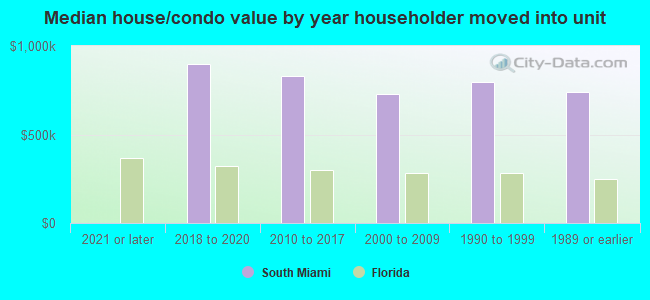
House/condo owner moved in on average (years ago)
Renter moved in on average (years ago)
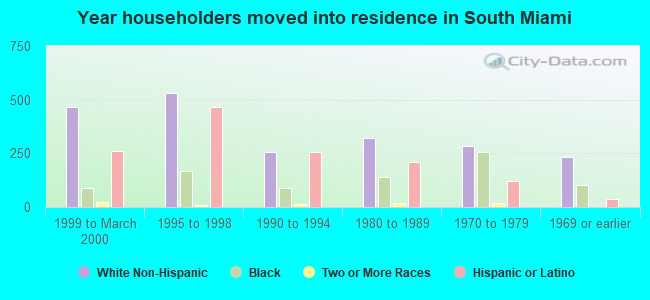
Year householder moved into unit - Moved in 1999 to March 2000 (%)
Year householder moved into unit - Moved in 1999 to March 2000 (%) - White
Year householder moved into unit - Moved in 1999 to March 2000 (%) - Black or African American
Year householder moved into unit - Moved in 1999 to March 2000 (%) - Asian
Year householder moved into unit - Moved in 1999 to March 2000 (%) - Hispanic or Latino
Year householder moved into unit - Moved in 1999 to March 2000 (%) - American Indian and Alaska Native
Year householder moved into unit - Moved in 1999 to March 2000 (%) - Multirace
Year householder moved into unit - Moved in 1999 to March 2000 (%) - Other Race
Year householder moved into unit - Moved in 1995 to 1998 (%)
Year householder moved into unit - Moved in 1995 to 1998 (%) - White
Year householder moved into unit - Moved in 1995 to 1998 (%) - Black or African American
Year householder moved into unit - Moved in 1995 to 1998 (%) - Asian
Year householder moved into unit - Moved in 1995 to 1998 (%) - Hispanic or Latino
Year householder moved into unit - Moved in 1995 to 1998 (%) - American Indian and Alaska Native
Year householder moved into unit - Moved in 1995 to 1998 (%) - Multirace
Year householder moved into unit - Moved in 1995 to 1998 (%) - Other Race
Year householder moved into unit - Moved in 1990 to 1994 (%)
Year householder moved into unit - Moved in 1990 to 1994 (%) - White
Year householder moved into unit - Moved in 1990 to 1994 (%) - Black or African American
Year householder moved into unit - Moved in 1990 to 1994 (%) - Asian
Year householder moved into unit - Moved in 1990 to 1994 (%) - Hispanic or Latino
Year householder moved into unit - Moved in 1990 to 1994 (%) - American Indian and Alaska Native
Year householder moved into unit - Moved in 1990 to 1994 (%) - Multirace
Year householder moved into unit - Moved in 1990 to 1994 (%) - Other Race
Year householder moved into unit - Moved in 1980 to 1989 (%)
Year householder moved into unit - Moved in 1980 to 1989 (%) - White
Year householder moved into unit - Moved in 1980 to 1989 (%) - Black or African American
Year householder moved into unit - Moved in 1980 to 1989 (%) - Asian
Year householder moved into unit - Moved in 1980 to 1989 (%) - Hispanic or Latino
Year householder moved into unit - Moved in 1980 to 1989 (%) - American Indian and Alaska Native
Year householder moved into unit - Moved in 1980 to 1989 (%) - Multirace
Year householder moved into unit - Moved in 1980 to 1989 (%) - Other Race
Year householder moved into unit - Moved in 1970 to 1979 (%)
Year householder moved into unit - Moved in 1970 to 1979 (%) - White
Year householder moved into unit - Moved in 1970 to 1979 (%) - Black or African American
Year householder moved into unit - Moved in 1970 to 1979 (%) - Asian
Year householder moved into unit - Moved in 1970 to 1979 (%) - Hispanic or Latino
Year householder moved into unit - Moved in 1970 to 1979 (%) - American Indian and Alaska Native
Year householder moved into unit - Moved in 1970 to 1979 (%) - Multirace
Year householder moved into unit - Moved in 1970 to 1979 (%) - Other Race
Year householder moved into unit - Moved in 1969 or earlier (%)
Year householder moved into unit - Moved in 1969 or earlier (%) - White
Year householder moved into unit - Moved in 1969 or earlier (%) - Black or African American
Year householder moved into unit - Moved in 1969 or earlier (%) - Asian
Year householder moved into unit - Moved in 1969 or earlier (%) - Hispanic or Latino
Year householder moved into unit - Moved in 1969 or earlier (%) - American Indian and Alaska Native
Year householder moved into unit - Moved in 1969 or earlier (%) - Multirace
Year householder moved into unit - Moved in 1969 or earlier (%) - Other Race
Housing units lacking complete plumbing facilities (%)
Housing units lacking complete kitchen facilities (%)
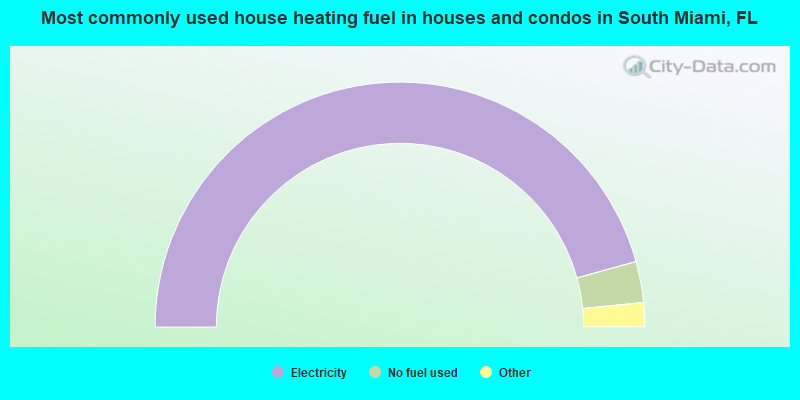
House heating fuel used in houses and condos - Utility gas (%)
House heating fuel used in houses and condos - Bottled, tank, or LP gas (%)
House heating fuel used in houses and condos - Electricity (%)
House heating fuel used in houses and condos - Fuel oil, kerosene, etc. (%)
House heating fuel used in houses and condos - Coal or coke (%)
House heating fuel used in houses and condos - Wood (%)
House heating fuel used in houses and condos - Solar energy (%)
House heating fuel used in houses and condos - Other fuel (%)
House heating fuel used in houses and condos - No fuel used (%)
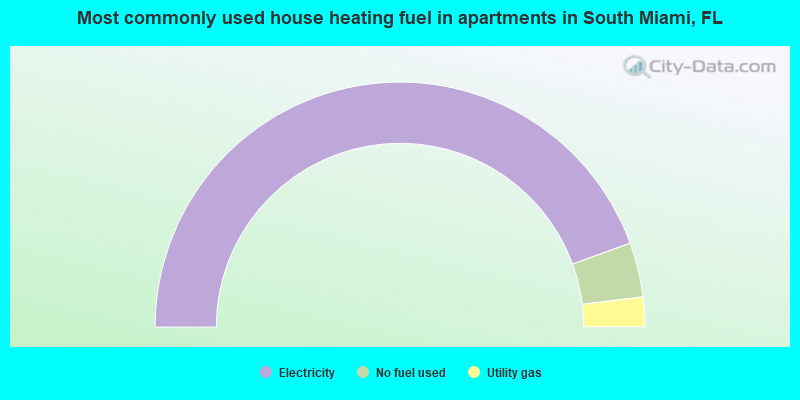
House heating fuel used in apartments - Utility gas (%)
House heating fuel used in apartments - Bottled, tank, or LP gas (%)
House heating fuel used in apartments - Electricity (%)
House heating fuel used in apartments - Fuel oil, kerosene, etc. (%)
House heating fuel used in apartments - Coal or coke (%)
House heating fuel used in apartments - Wood (%)
House heating fuel used in apartments - Solar energy (%)
House heating fuel used in apartments - Other fuel (%)
House heating fuel used in apartments - No fuel used (%)
Median year house/condo built: 1959Median year apartment built: 1976Household type by relationship:
Households: 11,880
Male householders: 2,308 (705 living alone ), Female householders: 2,402 (747 living alone )1,971 spouses (1,922 opposite-sex spouses ), 357 unmarried partners , (339 opposite-sex unmarried partners ), 3,228 children (3,178 natural , 9 adopted , 39 stepchildren ), 147 grandchildren , 59 brothers or sisters , 295 parents , 0 foster children , 394 other relatives , 604 non-relatives In group quarters: 110
Size of family households: 1,067 2-persons , 529 3-persons , 839 4-persons , 131 5-persons , 83 6-persons , 30 7-or-more-persons .
Size of nonfamily households: 1,557 1-person , 606 2-persons , 78 3-persons , 9 4-persons .
1,574 married couples with children. single-parent households (104 men , 258 women ).
39.7% of residents of South Miami speak English at home. of residents speak Spanish at home (74% speak English very well , 9% speak English well , 13% speak English not well , 4% don't speak English at all ).of residents speak other Indo-European language at home (74% speak English very well , 5% speak English well , 20% speak English not well , 1% don't speak English at all ).of residents speak Asian or Pacific Island language at home (79% speak English very well , 21% speak English well ).
Foreign born population: 5,272 (44.4%)of them are naturalized citizens )
Median number of rooms in houses and condos:
Median number of rooms in apartments
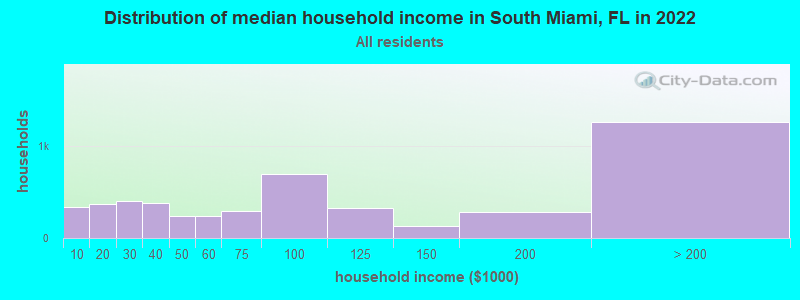
South Miami, FL household income distribution 335 Less than $10,000373 $10,000 to $19,999408 $20,000 to $29,999383 $30,000 to $39,999236 $40,000 to $49,999241 $50,000 to $59,999295 $60,000 to $74,999703 $75,000 to $99,999325 $100,000 to $124,999133 $125,000 to $149,999288 $150,000 to $199,9991,266 $200,000 or more
Home value of owner - occupied houses in 2022 in South Miami, FL 5 $25,000 to $29,99911 $90,000 to $99,9994 $175,000 to $199,999174 $200,000 to $249,99971 $250,000 to $299,999220 $300,000 to $399,999275 $400,000 to $499,999810 $500,000 to $749,999917 $750,000 to $999,999333 $1,000,000 to $1,499,999314 $1,500,000 to $1,999,999178 $2,000,000 or moreRent paid by renters in 2022 in South Miami, FL 7 $150 to $19925 $200 to $24922 $250 to $2998 $350 to $399180 $400 to $44942 $650 to $69914 $750 to $79940 $800 to $89978 $900 to $999258 $1,000 to $1,249364 $1,250 to $1,499365 $1,500 to $1,999434 $2,000 to $2,499140 $2,500 to $2,99970 $3,000 to $3,49941 $3,500 or more83 No cash rent
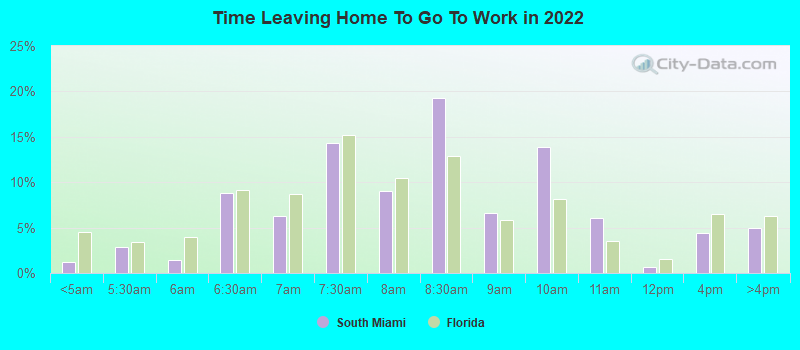
Percentage of workers working in this county: 97.9%Number of people working at home: 1,669 (28.7% of all workers )
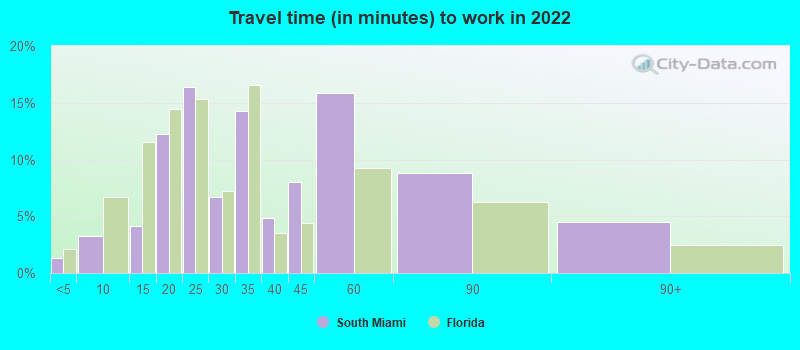
Travel time to work (commute)
Less than 5 minutes: 665 to 9 minutes: 23610 to 14 minutes: 33815 to 19 minutes: 59820 to 24 minutes: 59525 to 29 minutes: 29830 to 34 minutes: 59835 to 39 minutes: 15240 to 44 minutes: 40845 to 59 minutes: 66760 to 89 minutes: 36190 or more minutes: 139
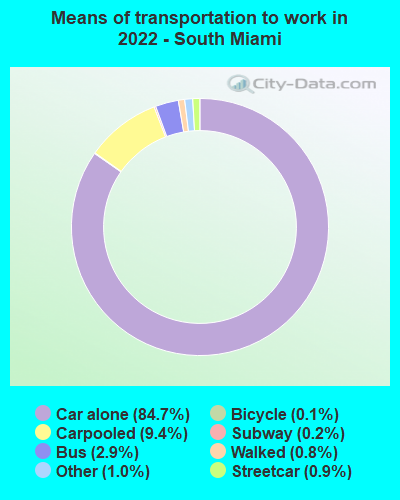
Means of transportation to work:
Drove a car alone: 7,768 (70.3%)Carpooled: 969 (8.8%)Bus : 247 (2.2%)Subway or elevated rail : 128 (1.2%)Long-distance train or commuter rail : 23 (0.2%)Light rail, streetcar or trolley : 14 (0.1%)Taxi: 111 (1.0%)Bicycle: 15 (0.1%)Walked: 81 (0.7%)Worked at home: 1,669 (15.1%)
Unemployment by race in 2022
Unemployment rate for White non-Hispanic residents 1.3% MalesUnemployment rate for Black residents 10.3% FemalesUnemployment rate for Asian residents 5.8% MalesUnemployment rate for two or more race residents 2.5% Males2.5% FemalesUnemployment rate for Hispanic or Latino residents 5.0% Males1.3% Females
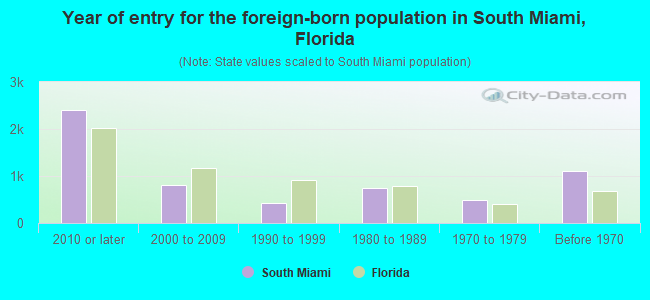
Year of entry for the foreign-born population in South Miami, Florida
2,398 2010 or later 810 2000 to 2009 417 1990 to 1999 744 1980 to 1989 486 1970 to 1979 1,114 Before 1970
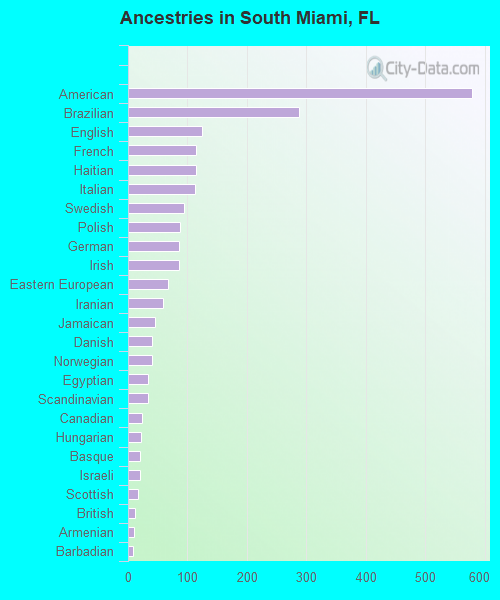
First ancestries reported:
American: 578 (7.4%)
Brazilian: 287 (3.7%)
English: 124 (1.6%)
French: 115 (1.5%)
Haitian: 114 (1.5%)
Italian: 112 (1.4%)
Swedish: 94 (1.2%)
Polish: 87 (1.1%)
German: 86 (1.1%)
Irish: 86 (1.1%)
Eastern European: 68 (0.9%)
Iranian: 59 (0.8%)
Jamaican: 46 (0.6%)
Danish: 41 (0.5%)
Norwegian: 40 (0.5%)
Egyptian: 34 (0.4%)
Scandinavian: 33 (0.4%)
Canadian: 24 (0.3%)
Hungarian: 22 (0.3%)
Basque: 21 (0.3%)
Israeli: 21 (0.3%)
Scottish: 17 (0.2%)
British: 12 (0.2%)
Armenian: 10 (0.1%)
Barbadian: 9 (0.1%)
Portuguese: 8 (0.1%)
Romanian: 6 (0.08%)
African: 6 (0.08%) Most common places of birth for foreign-born residents (%): Cuba South Miami:
34.9% (1,842)Florida:
22.0% (1,006,576)
Venezuela South Miami:
9.4% (494)Florida:
5.7% (262,042)
Colombia South Miami:
8.1% (429)Florida:
6.5% (298,669)
Brazil South Miami:
7.2% (379)Florida:
2.7% (122,906)
Nicaragua South Miami:
3.7% (195)Florida:
2.3% (105,066)
Dominican Republic South Miami:
3.3% (174)Florida:
3.0% (137,727)
India South Miami:
3.0% (156)Florida:
2.1% (94,349)
Argentina South Miami:
2.8% (148)Florida:
1.3% (57,263)
Chile South Miami:
2.7% (144)Florida:
0.5% (22,715)
Mexico South Miami:
2.3% (122)Florida:
5.6% (257,152)
France South Miami:
2.1% (111)Florida:
0.4% (20,008)
China, excluding Hong Kong and Taiwan South Miami:
1.7% (92)Florida:
1.2% (56,071)
Place of birth for U.S.-born residents:
This state: 4,068Other state: 2,272Northeast: 902Midwest: 611South: 514West: 252 87.7% of South Miami residents lived in the same house 1 years ago.
Out of people who lived in different houses, 36.8% lived in this county.
Out of people who lived in different counties, 24.0% lived in Florida.
South Miami:
87.7%State average:
86.3%
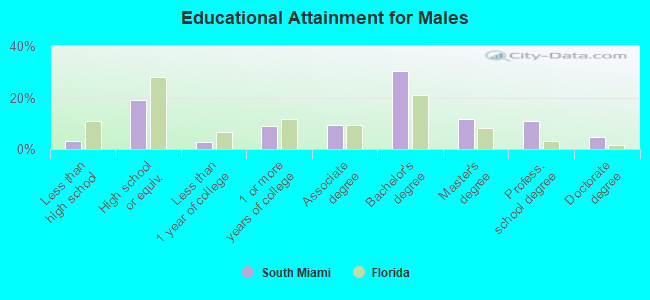
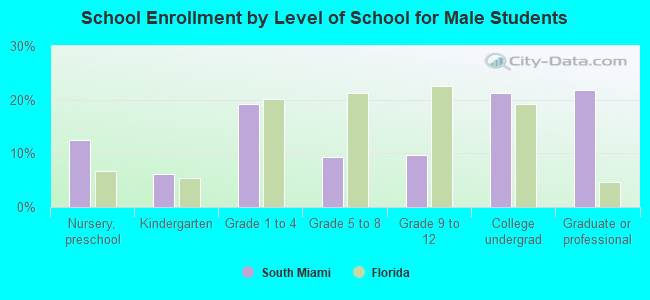
Education attainment for males 25 years and older:
No schooling: 5Nursery to 4th grade: 05th and 6th grade: 117th and 8th grade: 09th grade: 010th grade: 011th grade: 10912th grade, no diploma: 0High school graduate (or equivalency): 792Less than 1 year of college: 110Some college more than 1 year, no degree: 368Associate degree: 396Bachelor's degree: 1,270Master's degree: 492Professional school degree: 449Doctorate degree: 191
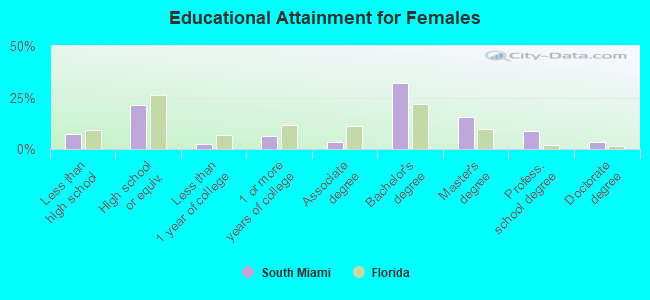
Education attainment for females 25 years and older:
No schooling: 27Nursery to 4th grade: 05th and 6th grade: 267th and 8th grade: 249th grade: 14810th grade: 611th grade: 1412th grade, no diploma: 76High school graduate (or equivalency): 962Less than 1 year of college: 101Some college more than 1 year, no degree: 280Associate degree: 153Bachelor's degree: 1,440Master's degree: 701Professional school degree: 392Doctorate degree: 157
Housing units in structures:
One, detached: 2,809One, attached: 175Two: 353 or 4: 4075 to 9: 10910 to 19: 14420 to 49: 66050 or more: 852Mobile homes: 8Housing units lacking complete plumbing facilities in 2022: 0.5%House/condo owner moved in on average 14 years ago
Renter moved in on average 3 years ago
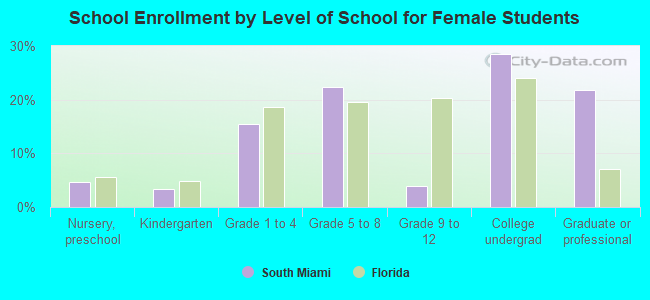
Private vs. public school enrollment:
Students in private schools in grades 1 to 8 (elementary and middle school): 297 Students in private schools in grades 9 to 12 (high school): 121 Students in private undergraduate colleges: 532