South Ogden, UT (Utah) Houses and Residents
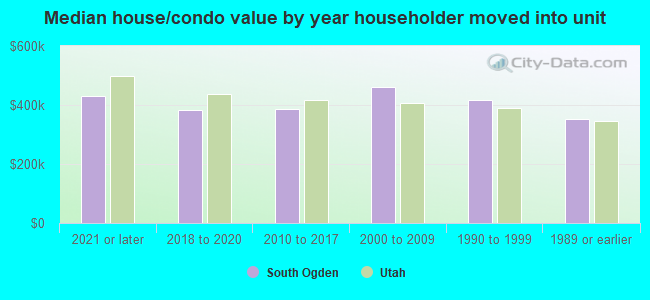
| South Ogden: | $403,742 |
| Utah: | $499,500 |
Total population: 16,852 (Urban population: 14,418, Rural population: 0)
Houses: 7,085 (6,781 occupied: 4,817 owner occupied, 2,037 renter occupied)
| % of renters here: | 30% |
| State: | 29% |
Housing density: 1,930 houses/condos per square mile
Median price asked for vacant for-sale houses and condos in 2022: $2,322,383.
Median contract rent in 2022: $1,142 (lower quartile is $832, upper quartile is $1,345)
Median rent asked for vacant for-rent units in 2022: $2,215
Median gross rent in South Ogden, UT in 2022: $1,265
Housing units in South Ogden with a mortgage: 3,403 (372 second mortgage, 0 home equity loan, 258 both second mortgage and home equity loan)
Houses without a mortgage: 173
Median household income for houses/condos with a mortgage: $107,159
Median household income for apartments without a mortgage: $66,047
Median monthly housing costs: $1,346
Compare current foreclosures near South Ogden, UT:
| Photo | Address | Area | Beds / Baths | Price | Details |
|---|---|---|---|---|---|

|
#1
S 2900 W
Ogden, UT 84401
|
1,186 sq. feet
|
2 baths 3 beds |
show details | |

|
#2
N 3450 W
Ogden, UT 84404
|
1,791 sq. feet
|
2 baths 3 beds |
show details | |

|
#3
S 2825 W
Roy, UT 84067
|
979 sq. feet
|
2 baths 5 beds |
show details | |

|
#4
W 4275 S
Ogden, UT 84401
|
2,154 sq. feet
|
3 baths 3 beds |
show details | |

|
#5
Foothill Dr
Ogden, UT 84403
|
3,219 sq. feet
|
3 baths 4 beds |
show details | |

|
#6
Lakeview Dr
Ogden, UT 84414
|
1,595 sq. feet
|
3 baths 6 beds |
show details | |

|
#7
Polk Ave
Ogden, UT 84403
|
1,860 sq. feet
|
1 baths 4 beds |
show details | |

|
#8
W 4925 S
Roy, UT 84067
|
3,668 sq. feet
|
1 baths 5 beds |
show details | |

|
#9
N 360 W
Clearfield, UT 84015
|
1,099 sq. feet
|
1 baths 4 beds |
show details | |

|
#10
E Canyon Dr
Ogden, UT 84405
|
1,595 sq. feet
|
2 baths 2 beds |
show details |
| Photo | Address | Area | Beds / Baths | Price | Details |
|---|---|---|---|---|---|

|
#11
16th St
Ogden, UT 84404
|
- sq. feet
|
1 baths 2 beds |
show details | |

|
#12
W 3450 N
Ogden, UT 84404
|
- sq. feet
|
2 baths 3 beds |
show details | |

|
#13
Chatelain Rd
Ogden, UT 84403
|
- sq. feet
|
2 baths 5 beds |
show details | |

|
#14
S 1000 E Apt 803
Clearfield, UT 84015
|
- sq. feet
|
- baths - beds |
show details | |

|
#15
N Washington Blvd Apt K204
Ogden, UT 84404
|
- sq. feet
|
- baths - beds |
show details | |

|
#16
N 1725 W
Clearfield, UT 84015
|
1,180 sq. feet
|
- baths - beds |
show details | |

|
#17
W 1915 N
Clearfield, UT 84015
|
1,210 sq. feet
|
- baths - beds |
show details | |

|
#18
W 1850 N
Clearfield, UT 84015
|
1,014 sq. feet
|
- baths - beds |
show details | |

|
#19
S 1000 E Apt 2701
Clearfield, UT 84015
|
- sq. feet
|
- baths - beds |
show details | |

|
#20
W 1375 N # E103
Centerville, UT 84014
|
- sq. feet
|
- baths - beds |
show details |
| Photo | Address | Area | Beds / Baths | Price | Details |
|---|---|---|---|---|---|

|
#21
N 2475 W
Clearfield, UT 84015
|
1,248 sq. feet
|
- baths - beds |
show details | |

|
#22
S 1000 E Apt 1105
Clearfield, UT 84015
|
- sq. feet
|
- baths - beds |
show details | |

|
#23
N 2275 W
Clearfield, UT 84015
|
948 sq. feet
|
- baths - beds |
show details | |

|
#24
W Mark St
Layton, UT 84041
|
1,053 sq. feet
|
- baths - beds |
show details | |

|
#25
W 1600 N Apt B2
Layton, UT 84041
|
- sq. feet
|
- baths - beds |
show details | |

|
#26
W 1600 N Apt B2
Layton, UT 84041
|
- sq. feet
|
- baths - beds |
show details | |

|
#27
N 1775 W
Clearfield, UT 84015
|
1,323 sq. feet
|
- baths - beds |
show details | |

|
#28
W 1600 N Apt 4
Layton, UT 84041
|
- sq. feet
|
- baths - beds |
show details | |

|
#29
W 1650 N Apt 2
Layton, UT 84041
|
- sq. feet
|
- baths - beds |
show details | |

|
#30
N 1575 W Apt 2
Layton, UT 84041
|
- sq. feet
|
- baths - beds |
show details |
| Photo | Address | Area | Beds / Baths | Price | Details |
|---|---|---|---|---|---|

|
#31
W 1230 N
Clearfield, UT 84015
|
1,624 sq. feet
|
- baths - beds |
show details | |

|
#32
W 1650 N Apt 402
Layton, UT 84041
|
- sq. feet
|
- baths - beds |
show details | |

|
#33
W 1960 N
Layton, UT 84041
|
1,176 sq. feet
|
- baths - beds |
show details | |

|
#34
N 1750 E
Layton, UT 84040
|
1,606 sq. feet
|
- baths - beds |
show details | |

|
#35
W 2580 N
Clearfield, UT 84015
|
1,420 sq. feet
|
- baths - beds |
show details | |

|
#36
S 3925 W
Roy, UT 84067
|
- sq. feet
|
- baths - beds |
show details | |

|
#37
N 2350 W
Clearfield, UT 84015
|
1,912 sq. feet
|
- baths - beds |
show details | |

|
#38
N 1200 W
Clearfield, UT 84015
|
1,128 sq. feet
|
- baths - beds |
show details | |

|
#39
E Southwell St Apt 1
Ogden, UT 84404
|
- sq. feet
|
- baths - beds |
show details | |

|
#40
W 2550 S
Ogden, UT 84401
|
- sq. feet
|
- baths - beds |
show details |
| Photo | Address | Area | Beds / Baths | Price | Details |
|---|---|---|---|---|---|

|
#41
W 2580 N
Clearfield, UT 84015
|
1,155 sq. feet
|
- baths - beds |
show details | |

|
#42
N 2225 W
Clearfield, UT 84015
|
1,171 sq. feet
|
- baths - beds |
show details | |

|
#43
Kays Creek Dr
Layton, UT 84040
|
1,514 sq. feet
|
- baths - beds |
show details | |

|
#44
N 1200 W
Clearfield, UT 84015
|
1,067 sq. feet
|
- baths - beds |
show details | |

|
#45
W 75 N
Clearfield, UT 84015
|
1,287 sq. feet
|
- baths - beds |
show details | |

|
#46
W 300 N, Trlr 21
Clearfield, UT 84015
|
- sq. feet
|
- baths - beds |
show details | |

|
#47
W 1920 N
Layton, UT 84041
|
1,078 sq. feet
|
- baths - beds |
show details | |

|
#48
W 300 N, Trlr 22
Clearfield, UT 84015
|
- sq. feet
|
- baths - beds |
show details | |

|
#49
Indian Camp Rd
Ogden, UT 84404
|
- sq. feet
|
- baths - beds |
show details | |

|
Check over 1 million property listings on Foreclosure.com!
|
browse all offers | |||


 | Ogden, really that bad? / nice area with small homes? (40 replies) |
| Relocating to Ogden from Nashville Tn (24 replies) |
| Ogden and area (19 replies) |
| Possibly relocating...questions... (5 replies) |
| Possibly Move To Ogden. Pros and Cons? And Where Are The Best Places To Live? (5 replies) |
| Utility Costs in Layton, Kaysville, Farmington, etc? (9 replies) |

Median year apartment built: 1985
Household type by relationship:
Households: 17,914- Male householders: 3,481 (684 living alone), Female householders: 3,168 (861 living alone)
3,814 spouses (3,740 opposite-sex spouses), 528 unmarried partners, (508 opposite-sex unmarried partners), 5,253 children (4,805 natural, 231 adopted, 216 stepchildren), 207 grandchildren, 317 brothers or sisters, 278 parents, 17 foster children, 319 other relatives, 366 non-relatives
- In group quarters: 159
Size of family households: 1,889 2-persons, 1,232 3-persons, 813 4-persons, 481 5-persons, 241 6-persons, 94 7-or-more-persons.
Size of nonfamily households: 1,740 1-person, 312 2-persons, 44 3-persons, 24 4-persons.
3,323 married couples with children.
693 single-parent households (138 men, 555 women).
85.2% of residents of South Ogden speak English at home.
7.6% of residents speak Spanish at home (65% speak English very well, 21% speak English well, 14% speak English not well).
2.5% of residents speak other Indo-European language at home (91% speak English very well, 7% speak English well, 2% speak English not well).
3.4% of residents speak Asian or Pacific Island language at home (36% speak English very well, 27% speak English well, 37% speak English not well).
1.1% of residents speak other language at home (87% speak English very well, 13% speak English well).
Foreign born population: 1,112 (6.2%)
(36.2% of them are naturalized citizens)
| Here: | 7.3 |
| State: | 7.6 |
| Here: | 3.9 |
| State: | 4.3 |
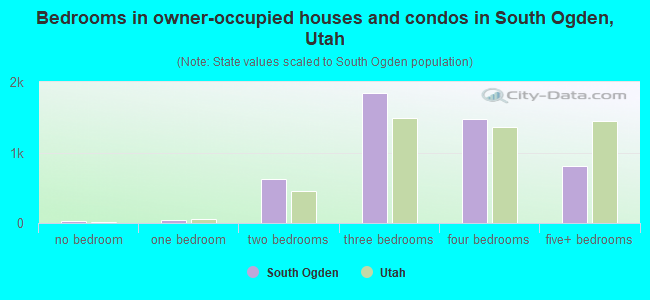
- Bedrooms in owner-occupied houses and condos in South Ogden, Utah
- 34no bedroom
- 361 bedroom
- 6272 bedrooms
- 1,8453 bedrooms
- 1,4744 bedrooms
- 8025+ bedrooms
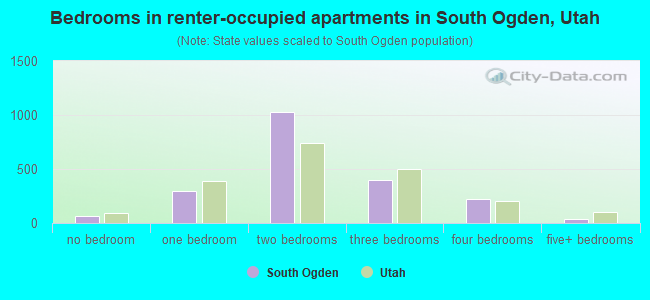
- Bedrooms in renter-occupied apartments in South Ogden, Utah
- 63no bedroom
- 2971 bedroom
- 1,0282 bedrooms
- 3943 bedrooms
- 2194 bedrooms
- 365+ bedrooms
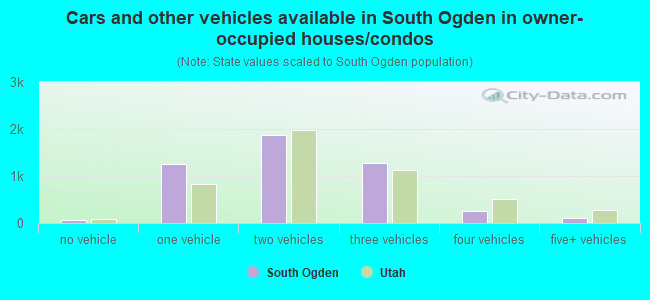
- Cars and other vehicles available in South Ogden in owner-occupied houses/condos
- 58no vehicle
- 1,2481 vehicle
- 1,8682 vehicles
- 1,2873 vehicles
- 2544 vehicles
- 1035+ vehicles
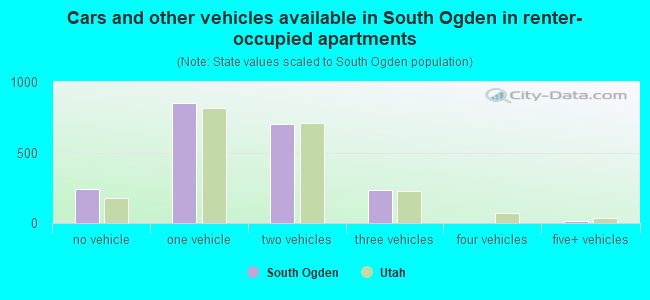
- Cars and other vehicles available in South Ogden in renter-occupied apartments
- 240no vehicle
- 8501 vehicle
- 6992 vehicles
- 2323 vehicles
- 04 vehicles
- 175+ vehicles
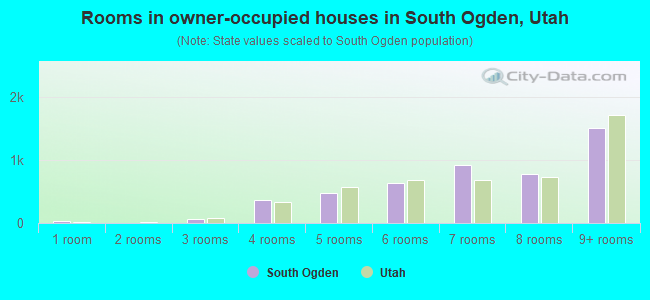
- Rooms in owner-occupied houses in South Ogden, Utah
- 341 room
- 02 rooms
- 703 rooms
- 3594 rooms
- 4815 rooms
- 6386 rooms
- 9307 rooms
- 7878 rooms
- 1,5199+ rooms
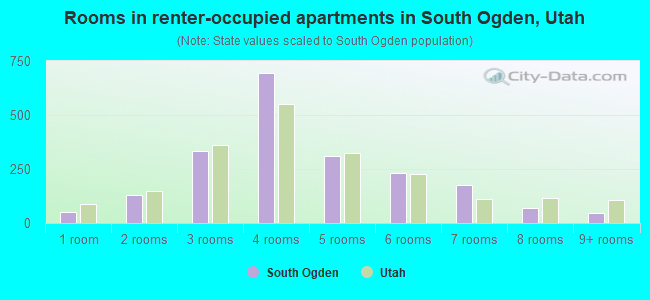
- Rooms in renter-occupied apartments in South Ogden, Utah
- 501 room
- 1292 rooms
- 3333 rooms
- 6944 rooms
- 3115 rooms
- 2316 rooms
- 1767 rooms
- 698 rooms
- 449+ rooms
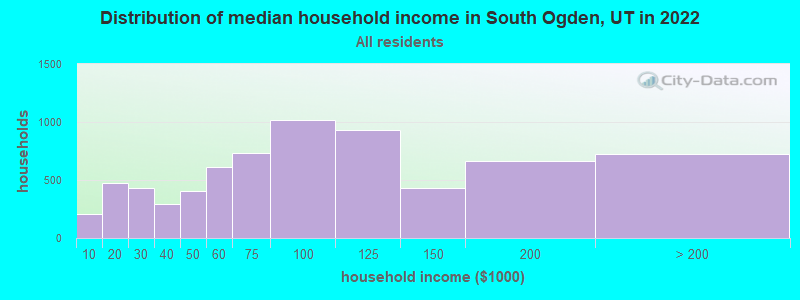
South Ogden, UT household income distribution

- 205Less than $10,000
- 477$10,000 to $19,999
- 435$20,000 to $29,999
- 291$30,000 to $39,999
- 407$40,000 to $49,999
- 614$50,000 to $59,999
- 736$60,000 to $74,999
- 1,019$75,000 to $99,999
- 932$100,000 to $124,999
- 431$125,000 to $149,999
- 663$150,000 to $199,999
- 725$200,000 or more
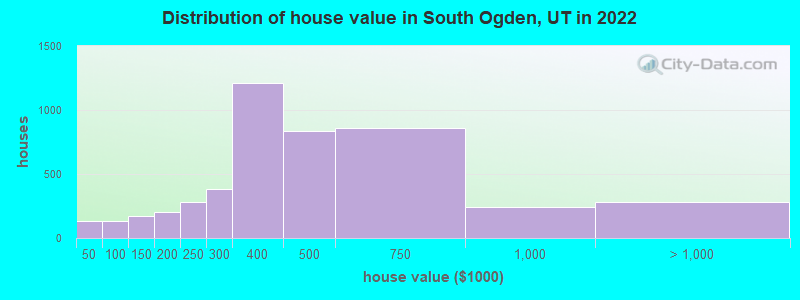
Home value of owner - occupied houses in 2022 in South Ogden, UT
-
- 62Less than $10,000
- 5$25,000 to $29,999
- 68$40,000 to $49,999
- 9$70,000 to $79,999
- 28$80,000 to $89,999
- 27$90,000 to $99,999
- 100$100,000 to $124,999
- 68$125,000 to $149,999
- 139$150,000 to $174,999
- 66$175,000 to $199,999
- 277$200,000 to $249,999
- 381$250,000 to $299,999
- 1,211$300,000 to $399,999
- 834$400,000 to $499,999
- 862$500,000 to $749,999
- 240$750,000 to $999,999
- 218$1,000,000 to $1,499,999
- 14$1,500,000 to $1,999,999
- 49$2,000,000 or more
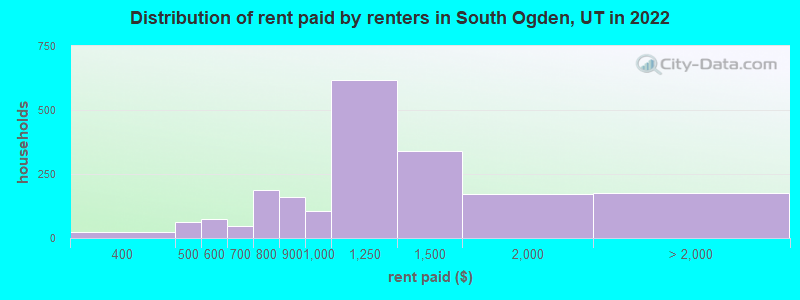
Rent paid by renters in 2022 in South Ogden, UT
-
- 22$350 to $399
- 63$400 to $449
- 31$500 to $549
- 42$550 to $599
- 22$600 to $649
- 24$650 to $699
- 121$700 to $749
- 64$750 to $799
- 160$800 to $899
- 104$900 to $999
- 619$1,000 to $1,249
- 341$1,250 to $1,499
- 170$1,500 to $1,999
- 81$2,000 to $2,499
- 28$2,500 to $2,999
- 22$3,000 to $3,499
- 41No cash rent
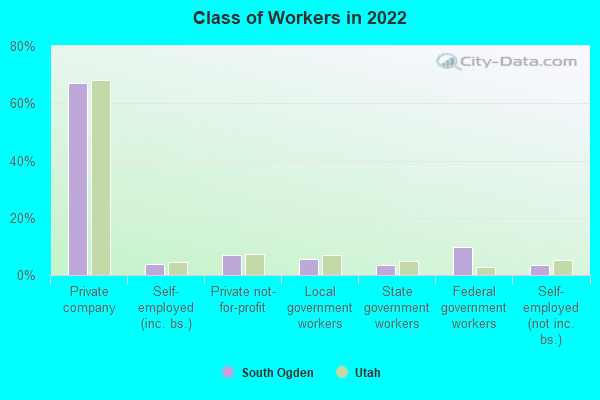
Percentage of workers working in this county: 64.9%
Number of people working at home: 1,336 (14.3% of all workers)
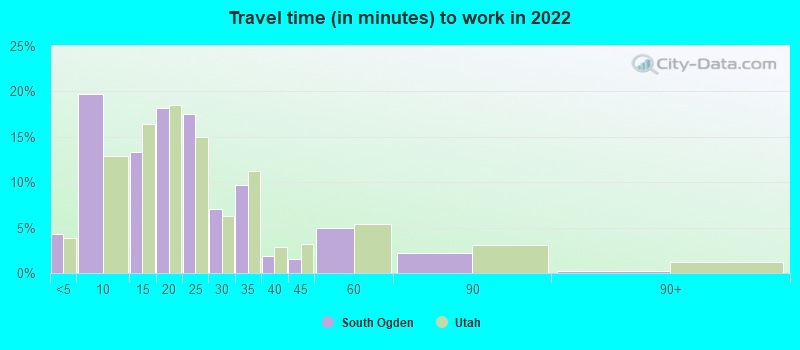
Travel time to work (commute)
- Less than 5 minutes: 226
- 5 to 9 minutes: 1,174
- 10 to 14 minutes: 805
- 15 to 19 minutes: 1,773
- 20 to 24 minutes: 1,371
- 25 to 29 minutes: 531
- 30 to 34 minutes: 569
- 35 to 39 minutes: 111
- 40 to 44 minutes: 330
- 45 to 59 minutes: 463
- 60 to 89 minutes: 317
- 90 or more minutes: 195
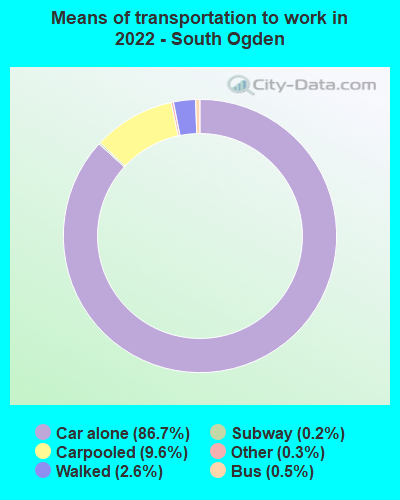
Means of transportation to work:
- Drove a car alone: 5,493 (70.8%)
- Carpooled: 699 (9.0%)
- Bus: 44 (0.6%)
- Long-distance train or commuter rail: 13 (0.2%)
- Taxi: 15 (0.2%)
- Bicycle: 2 (0.0%)
- Walked: 165 (2.1%)
- Worked at home: 1,336 (17.2%)
- Unemployment by race in 2022
- Unemployment rate for White non-Hispanic residents
- 1.5%Males
- 1.1%Females
- Unemployment rate for Black residents
- 69.8%Females
- Unemployment rate for American Indian and Alaska Native residents
- 14.8%Males
- Unemployment rate for Hispanic or Latino residents
- 2.4%Males
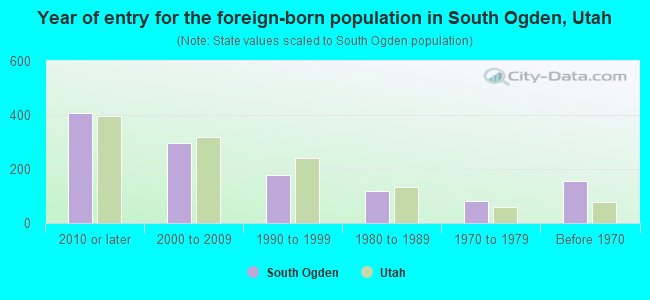
- Year of entry for the foreign-born population in South Ogden, Utah
- 4072010 or later
- 2952000 to 2009
- 1771990 to 1999
- 1181980 to 1989
- 811970 to 1979
- 154Before 1970
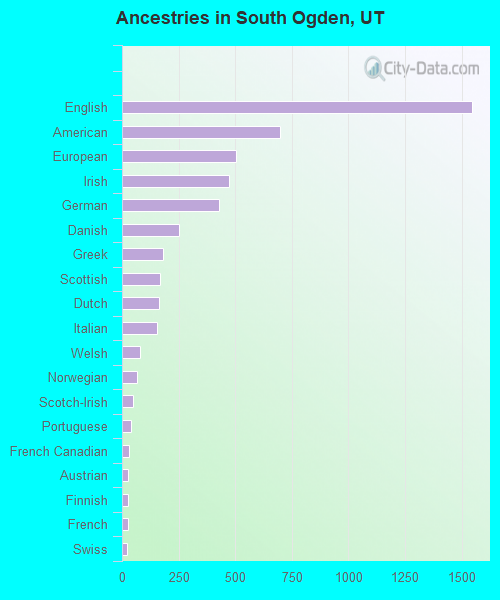
First ancestries reported:
- English: 1,544 (20.3%)
- American: 699 (9.2%)
- European: 502 (6.6%)
- Irish: 471 (6.2%)
- German: 428 (5.6%)
- Danish: 254 (3.3%)
- Greek: 182 (2.4%)
- Scottish: 170 (2.2%)
- Dutch: 162 (2.1%)
- Italian: 154 (2.0%)
- Welsh: 81 (1.1%)
- Norwegian: 66 (0.9%)
- Scotch-Irish: 50 (0.7%)
- Portuguese: 39 (0.5%)
- French Canadian: 32 (0.4%)
- Austrian: 28 (0.4%)
- Finnish: 27 (0.4%)
- French: 27 (0.4%)
- Swiss: 23 (0.3%)
- Icelander: 14 (0.2%)
- Belgian: 13 (0.2%)
- Arab: 12 (0.2%)
- Nigerian: 9 (0.1%)
- Northern European: 8 (0.1%)
- British: 7 (0.09%)
- Czech: 7 (0.09%)
- Scandinavian: 7 (0.09%)
- Basque: 5 (0.07%)
- Croatian: 5 (0.07%)
- Hungarian: 5 (0.07%)
Most common places of birth for foreign-born residents (%):
| South Ogden: | 33.2% (377) |
| Utah: | 36.1% (99,740) |
| South Ogden: | 7.8% (89) |
| Utah: | 1.6% (4,524) |
| South Ogden: | 5.8% (66) |
| Utah: | 0.7% (1,949) |
| South Ogden: | 5.2% (59) |
| Utah: | 0.2% (455) |
| South Ogden: | 4.9% (56) |
| Utah: | 0.1% (400) |
| South Ogden: | 4.1% (47) |
| Utah: | 2.3% (6,468) |
| South Ogden: | 3.7% (42) |
| Utah: | 2.8% (7,644) |
| South Ogden: | 3.3% (38) |
| Utah: | 0.5% (1,315) |
| South Ogden: | 2.7% (31) |
| Utah: | 2.6% (7,062) |
| South Ogden: | 2.6% (30) |
| Utah: | 0.2% (685) |
| South Ogden: | 2.6% (30) |
| Utah: | 2.0% (5,555) |
| South Ogden: | 1.8% (21) |
| Utah: | 2.7% (7,472) |
| South Ogden: | 1.7% (19) |
| Utah: | 0.2% (634) |
Place of birth for U.S.-born residents:
- This state: 11,011
- Other state: 5,454
- Northeast: 591
- Midwest: 696
- South: 1,264
- West: 2,898
88.2% of South Ogden residents lived in the same house 1 years ago.
Out of people who lived in different houses, 37.2% lived in this county.
Out of people who lived in different counties, 60.1% lived in Utah.
| South Ogden: | 88.2% |
| State average: | 85.7% |
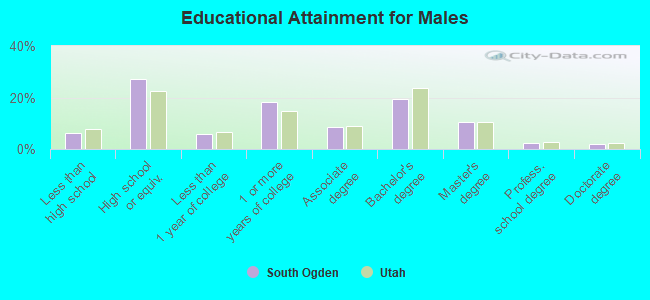
Education attainment for males 25 years and older:
- No schooling: 36
- Nursery to 4th grade: 17
- 5th and 6th grade: 28
- 7th and 8th grade: 37
- 9th grade: 19
- 10th grade: 43
- 11th grade: 84
- 12th grade, no diploma: 98
- High school graduate (or equivalency): 1,544
- Less than 1 year of college: 326
- Some college more than 1 year, no degree: 1,048
- Associate degree: 497
- Bachelor's degree: 1,099
- Master's degree: 588
- Professional school degree: 137
- Doctorate degree: 107
Education attainment for females 25 years and older:
- No schooling: 0
- Nursery to 4th grade: 8
- 5th and 6th grade: 44
- 7th and 8th grade: 23
- 9th grade: 14
- 10th grade: 6
- 11th grade: 48
- 12th grade, no diploma: 16
- High school graduate (or equivalency): 1,287
- Less than 1 year of college: 419
- Some college more than 1 year, no degree: 1,258
- Associate degree: 890
- Bachelor's degree: 1,565
- Master's degree: 471
- Professional school degree: 39
- Doctorate degree: 12


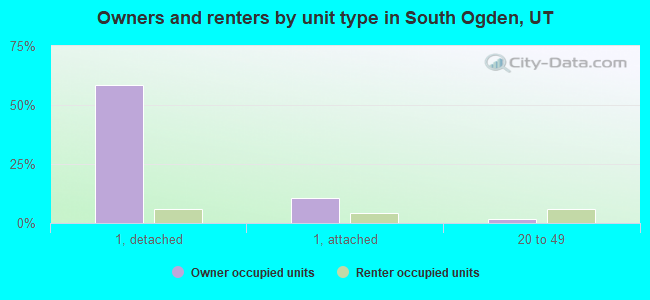
Housing units in structures:
- One, detached: 4,570
- One, attached: 788
- Two: 140
- 3 or 4: 365
- 5 to 9: 311
- 10 to 19: 191
- 20 to 49: 381
- 50 or more: 318
- Mobile homes: 17
Housing units lacking complete kitchen facilities in 2022: 2.0%
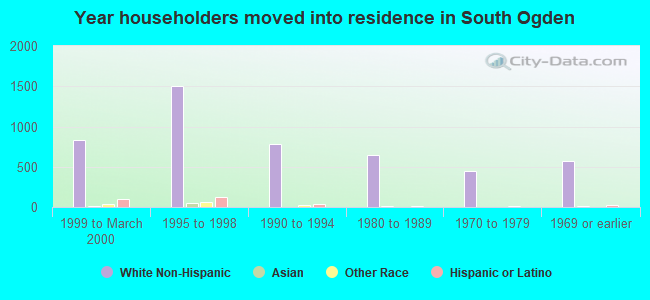
House/condo owner moved in on average 9 years ago
Renter moved in on average 3 years ago
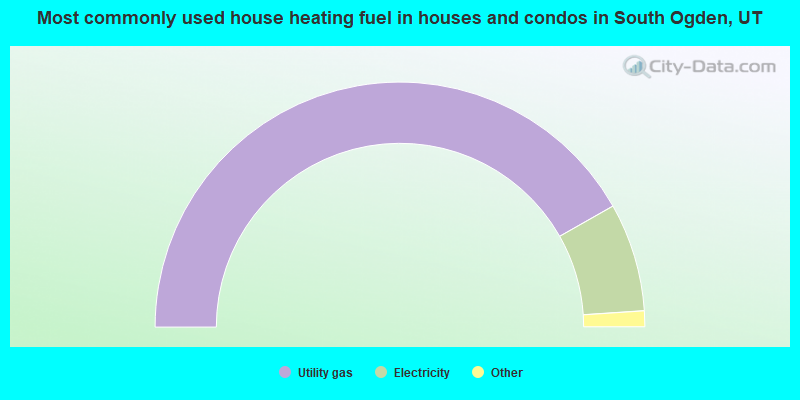
- 83.5%Utility gas
- 14.3%Electricity
- 1.7%Bottled, tank, or LP gas
- 0.4%No fuel used
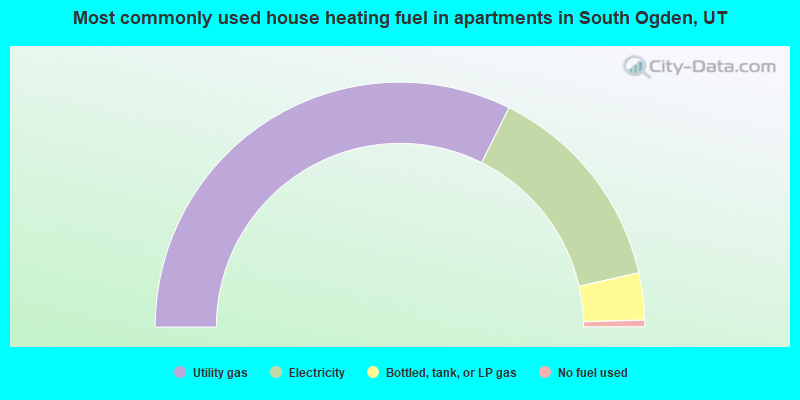
- 64.7%Utility gas
- 28.2%Electricity
- 6.2%Bottled, tank, or LP gas
- 0.9%No fuel used
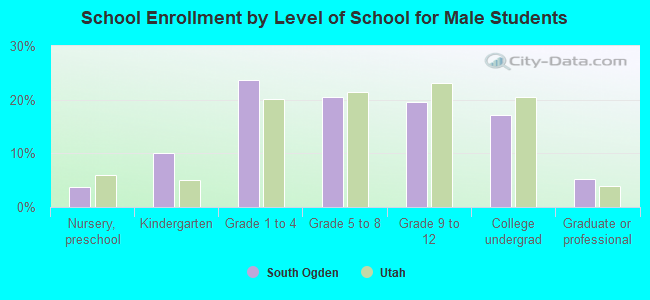
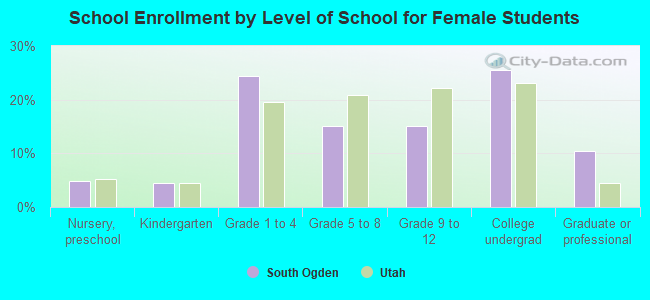
Private vs. public school enrollment:
| Here: | 15.1% |
| Utah: | 7.2% |
| Here: | 0.0% |
| Utah: | 5.3% |
| Here: | 2.9% |
| Utah: | 26.7% |