Jump to a detailed profile or search site with Google Custom Search

Southeast Osage, OK (Oklahoma) Houses and Residents

Estimated median house or condo value in 2022: $221,698 (it was $77,500 in 2000)
Southeast Osage:

$221,698
Oklahoma:

$191,700
Lower value quartile - upper value quartile: $151,019 - $355,687

Total population: 20,850 (Urban population: 9,378 (5,641 inside urbanized areas, 3,737 inside urban clusters), Rural population: 11,143 (379 farm, 10,764 nonfarm))

Houses: 8,071 (7,599 occupied: 6,332 owner occupied, 1,267 renter occupied)

% of renters here:

17%
State:

35%

Housing density: 34 houses/condos per square mile

Median price asked for vacant for-sale houses and condos in 2022 in this county: $100,746.

Median contract rent in 2022: $697 (lower quartile is $333, upper quartile is $1,073)


Median rent asked for vacant for-rent units in 2022: $632


Median gross rent in Southeast Osage, OK in 2022: $844

Housing units in Southeast Osage with a mortgage: 3,092 (232 second mortgage, 220 home equity loan, 23 both second mortgage and home equity loan)
Houses without a mortgage: 1,205

Compare current foreclosures near Southeast Osage, OK:

Check out more offers near Southeast Osage, OK.
Powered by Foreclosure.com


Southeast Osage, Oklahoma Age and Sex of Residents

Household type by relationship:

Households: 45,968
  • In family households: 39,865 (9,376 male householders, 3,596 female householders)
    9,864 spouses, 13,128 children (11,687 natural, 502 adopted, 939 stepchildren), 1,584 grandchildren, 294 brothers or sisters, 287 parents, foster children, 438 other relatives, 1,015 non-relatives
  • In nonfamily households: 6,103 (2,534 male householders (2,120 living alone)), 2,699 female householders (2,396 living alone)), 870 nonrelatives
  • In group quarters: 1,504 (1,429 institutionalized population)

7,968 married couples with children.
2,358 single-parent households (648 men, 1,710 women).

96.5% of residents of Southeast Osage speak English at home.
2.4% of residents speak Spanish at home (57% speak English very well, 13% speak English well, 30% speak English not well).
0.7% of residents speak other Indo-European language at home (48% speak English very well, 29% speak English well, 19% speak English not well, 4% don't speak English at all).
0.1% of residents speak Asian or Pacific Island language at home (76% speak English very well, 24% speak English well).
0.3% of residents speak other language at home (84% speak English very well, 16% speak English well).

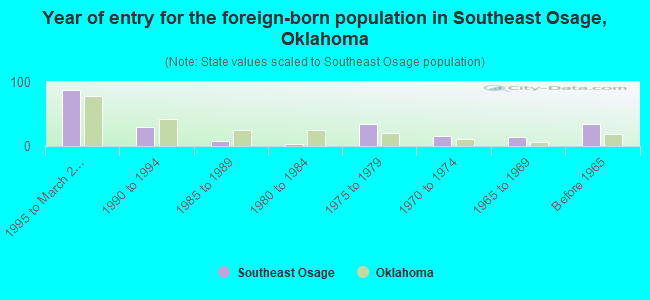
Foreign born population: 449 (1.9%)
(59.0% of them are naturalized citizens)

Median number of rooms in houses and condos:
Here:

7.4
State:

6.1

Median number of rooms in apartments
Here:

4.6
State:

4.5

Owner-occupied Renter-occupied
Bedrooms in owner-occupied houses and condos in Southeast Osage, Oklahoma
  • Bedrooms in owner-occupied houses and condos in Southeast Osage, Oklahoma
  • 29no bedroom
  • 1461 bedroom
  • 1,0702 bedrooms
  • 4,0823 bedrooms
  • 8874 bedrooms
  • 1185+ bedrooms
Bedrooms in renter-occupied apartments in Southeast Osage, Oklahoma
  • Bedrooms in renter-occupied apartments in Southeast Osage, Oklahoma
  • 38no bedroom
  • 3631 bedroom
  • 4062 bedrooms
  • 4153 bedrooms
  • 344 bedrooms
  • 115+ bedrooms
Owner-occupied Renter-occupied
Cars and other vehicles available in Southeast Osage in owner-occupied houses/condos
  • Cars and other vehicles available in Southeast Osage in owner-occupied houses/condos
  • 262no vehicle
  • 1,3911 vehicle
  • 3,0162 vehicles
  • 1,1583 vehicles
  • 3964 vehicles
  • 1095+ vehicles
Cars and other vehicles available in Southeast Osage in renter-occupied apartments
  • Cars and other vehicles available in Southeast Osage in renter-occupied apartments
  • 252no vehicle
  • 5801 vehicle
  • 3552 vehicles
  • 413 vehicles
  • 314 vehicles
  • 85+ vehicles
Owner-occupied Renter-occupied
Rooms in owner-occupied houses in Southeast Osage, Oklahoma
  • Rooms in owner-occupied houses in Southeast Osage, Oklahoma
  • 191 room
  • 322 rooms
  • 1263 rooms
  • 5714 rooms
  • 1,6435 rooms
  • 1,7176 rooms
  • 1,1417 rooms
  • 6028 rooms
  • 4819+ rooms
Rooms in renter-occupied apartments in Southeast Osage, Oklahoma
  • Rooms in renter-occupied apartments in Southeast Osage, Oklahoma
  • 201 room
  • 1092 rooms
  • 2653 rooms
  • 2664 rooms
  • 3015 rooms
  • 1956 rooms
  • 487 rooms
  • 388 rooms
  • 259+ rooms
Year house built
Breakdown of mean house values by ages of householders
Owners and renters by unit type in Southeast Osage, OK
  • Southeast Osage, OK household income distribution

  • Distribution of median household income in Southeast Osage, OK in 2022
  • 60,032Less than $10,000
  • 82,746$10,000 to $19,999
  • 85,951$20,000 to $29,999
  • 84,426$30,000 to $39,999
  • 83,483$40,000 to $49,999
  • 76,069$50,000 to $59,999
  • 95,064$60,000 to $74,999
  • 117,347$75,000 to $99,999
  • 85,497$100,000 to $124,999
  • 54,965$125,000 to $149,999
  • 59,184$150,000 to $199,999
  • 58,538$200,000 or more

Percentage of workers working in this county: 16.1%
Number of people working at home: 1,015 (9.1% of all workers)

Travel time to work (commute)

  • Less than 5 minutes: 249
  • 5 to 9 minutes: 750
  • 10 to 14 minutes: 1,045
  • 15 to 19 minutes: 1,185
  • 20 to 24 minutes: 1,348
  • 25 to 29 minutes: 666
  • 30 to 34 minutes: 1,908
  • 35 to 39 minutes: 532
  • 40 to 44 minutes: 384
  • 45 to 59 minutes: 734
  • 60 to 89 minutes: 272
  • 90 or more minutes: 121

Means of transportation to work:

  • Drove a car alone: 7,724 (81.5%)
  • Carpooled: 1,314 (13.9%)
  • Bus or trolley bus: 29 (0.3%)
  • Taxi: 4 (0.0%)
  • Bicycle: 18 (0.2%)
  • Walked: 53 (0.6%)
  • Other means: 52 (0.5%)
  • Worked at home: 278 (2.9%)
Class of Workers in 2000
Year of entry for the foreign-born population in Southeast Osage, Oklahoma
  • Year of entry for the foreign-born population in Southeast Osage, Oklahoma
  • 871995 to March 2000
  • 291990 to 1994
  • 81985 to 1989
  • 31980 to 1984
  • 341975 to 1979
  • 161970 to 1974
  • 141965 to 1969
  • 34Before 1965

Most common places of birth for foreign-born residents (%):

Mexico
Southeast Osage:

46.7% (105)
Oklahoma:

42.5% (55,971)

Pakistan
Southeast Osage:

7.6% (17)
Oklahoma:

0.9% (1,151)

Honduras
Southeast Osage:

5.3% (12)
Oklahoma:

0.7% (930)

Turkey
Southeast Osage:

4.4% (10)
Oklahoma:

0.3% (418)

Cuba
Southeast Osage:

4.0% (9)
Oklahoma:

0.5% (668)

Other Caribbean
Southeast Osage:

3.6% (8)
Oklahoma:

0.3% (366)

France
Southeast Osage:

3.1% (7)
Oklahoma:

0.5% (699)

Taiwan
Southeast Osage:

3.1% (7)
Oklahoma:

1.0% (1,335)

Korea
Southeast Osage:

3.1% (7)
Oklahoma:

3.1% (4,146)

Ghana
Southeast Osage:

3.1% (7)
Oklahoma:

0.3% (456)

Canada
Southeast Osage:

3.1% (7)
Oklahoma:

2.8% (3,710)

United Kingdom
Southeast Osage:

2.7% (6)
Oklahoma:

2.9% (3,814)

Jamaica
Southeast Osage:

2.2% (5)
Oklahoma:

0.4% (562)

El Salvador
Southeast Osage:

2.2% (5)
Oklahoma:

0.4% (546)

Philippines
Southeast Osage:

1.8% (4)
Oklahoma:

2.4% (3,221)

Place of birth for U.S.-born residents:

  • This state: 14,361
  • Other state: 5,834
  • Northeast: 349
  • Midwest: 2,036
  • South: 2,347
  • West: 1,102

63% of Southeast Osage residents lived in the same house 5 years ago.
   Out of people who lived in different houses, 23% lived in this county.
   Out of people who lived in different counties, 79% lived in Oklahoma.

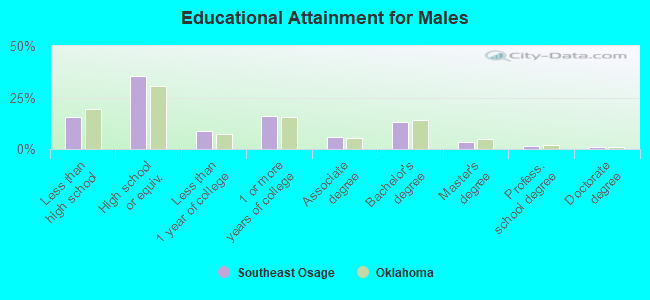
Education attainment for males 25 years and older:

  • No schooling: 42
  • Nursery to 4th grade: 42
  • 5th and 6th grade: 27
  • 7th and 8th grade: 165
  • 9th grade: 129
  • 10th grade: 183
  • 11th grade: 227
  • 12th grade, no diploma: 154
  • High school graduate (or equivalency): 2,222
  • Less than 1 year of college: 561
  • Some college more than 1 year, no degree: 999
  • Associate degree: 372
  • Bachelor's degree: 831
  • Master's degree: 206
  • Professional school degree: 89
  • Doctorate degree: 46
Educational Attainment for Males

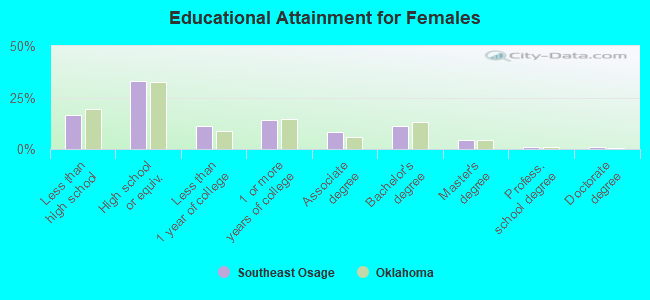
Education attainment for females 25 years and older:

  • No schooling: 69
  • Nursery to 4th grade: 21
  • 5th and 6th grade: 23
  • 7th and 8th grade: 221
  • 9th grade: 125
  • 10th grade: 304
  • 11th grade: 214
  • 12th grade, no diploma: 152
  • High school graduate (or equivalency): 2,275
  • Less than 1 year of college: 774
  • Some college more than 1 year, no degree: 979
  • Associate degree: 561
  • Bachelor's degree: 786
  • Master's degree: 310
  • Professional school degree: 71
  • Doctorate degree: 52
Educational Attainment for Females
Southeast Osage marital status for males
Southeast Osage marital status for females

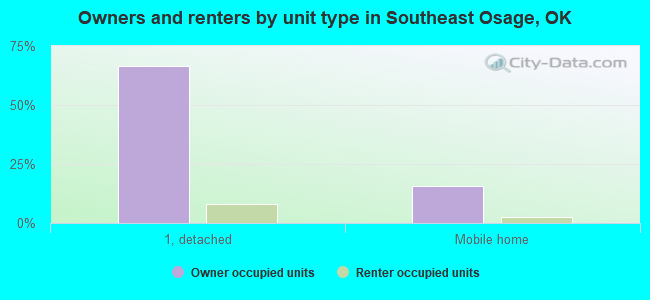
Housing units in structures:

  • One, detached: 5,890
  • One, attached: 110
  • Two: 78
  • 3 or 4: 136
  • 5 to 9: 105
  • 10 to 19: 53
  • 20 to 49: 58
  • 50 or more: 71
  • Mobile homes: 1,546
  • Boats, RVs, vans, etc.: 24

Median worth of mobile homes: $72,288

Housing units lacking complete plumbing facilities: 0.7%

Housing units lacking complete kitchen facilities: 0.5%
Year householders moved into residence in Southeast Osage
Houses and condos Apartments
Most commonly used house heating fuel in houses and condos in Southeast Osage, OK
  • 45.1%Utility gas
  • 25.9%Electricity
  • 25.7%Bottled, tank, or LP gas
  • 2.7%Wood
  • 0.6%Other fuel
Most commonly used house heating fuel in apartments in Southeast Osage, OK
  • 56.4%Utility gas
  • 24.5%Electricity
  • 16.6%Bottled, tank, or LP gas
  • 1.7%Wood
  • 0.7%No fuel used
  • 0.2%Other fuel

Private vs. public school enrollment:

Students in private schools in grades 1 to 8 (elementary and middle school): 196
Here:

7.0%
Oklahoma:

6.4%

Students in private schools in grades 9 to 12 (high school): 78
Here:

5.7%
Oklahoma:

6.2%

Students in private undergraduate colleges: 83
Here:

13.7%
Oklahoma:

16.6%
School Enrollment by Level of School for Male Students
School Enrollment by Level of School for Female Students
Age and Sex of Sensory-Disabled Noninstitutionalized Residents
Age and Sex of Physically-Disabled Noninstitutionalized Residents
Age and Sex of Mentally-Disabled Noninstitutionalized Residents
Age and Sex of Self-Care Disabled Noninstitutionalized Residents
Age and Sex of Go-Outside-Home Disabled Noninstitutionalized Residents
Age and Sex of Noninstitutionalized Residents with Employment Disability