St. Andrews, SC (South Carolina) Houses and Residents
Estimated median house or condo value in 2022: $147,633 (it was $81,500 in 2000 )
St. Andrews:
$147,633South Carolina:
$254,600
Lower value quartile - upper value quartile: $113,597 - $179,450Mean price in 2022: Detached houses: $162,058 Here:
$162,058State:
$368,255
Townhouses or other attached units: $119,659 Here:
$119,659State:
$292,023
In 3-to-4-unit structures: $107,596 Here:
$107,596State:
$230,702
In 5-or-more-unit structures: $99,002 Here:
$99,002State:
$326,361
Mobile homes: $62,235 Here:
$62,235State:
$102,531
Total population: 20,493 (All urban)
Houses: 12,075 (10,459 occupied: 3,037 owner occupied, 7,542 renter occupied )
% of renters here:
71%State:
28%
Housing density: 1,754 houses/condos per square mile
Median price asked for vacant for-sale houses and condos in 2022: $212,506.
Median contract rent in 2022: $858 (lower quartile is $754, upper quartile is $990)
Median rent asked for vacant for-rent units in 2022: $1,896
Median gross rent in St. Andrews, SC in 2022: $1,053
Housing units in St. Andrews with a mortgage: 1,966 (118 second mortgage, 0 home equity loan, 73 both second mortgage and home equity loan )Houses without a mortgage: 59
Median household income for houses/condos with a mortgage: $68,793
Median household income for apartments without a mortgage: $56,680
Median monthly housing costs: $969
Data:
Median house or condo value ($)
Median house or condo value ($ change since 2000)
Median house or condo value ($) - White
Median house or condo value ($) - Black or African American
Median house or condo value ($) - Asian
Median house or condo value ($) - Hispanic or Latino
Median house or condo value ($) - American Indian and Alaska Native
Median house or condo value ($) - Multirace
Median house or condo value ($) - Other Race
Median price asked for mobile homes ($)
Household density (households per square mile)
Mean house or condo value by units in structure - 1, detached ($)
Mean house or condo value by units in structure - 1, attached ($)
Mean house or condo value by units in structure - 2 ($)
Mean house or condo value by units in structure by units in structure - 3 or 4 ($)
Mean house or condo value by units in structure - 5 or more ($)
Mean house or condo value by units in structure - Boat, RV, van, etc. ($)
Mean house or condo value by units in structure - Mobile home ($)
Median contract rent ($)
Median contract rent - Lower quartile ($)
Median contract rent - Upper quartile ($)
Median gross rent ($)
Urban houses (%)
Rural houses (%)
Houses occupied (%)
Houses occupied (% change since 2000)
Houses owner occupied (%)
Houses owner occupied (% change since 2000)
Houses renter occupied (%)
Houses renter occupied (% change since 2000)
Vacant housing units - For rent (%)
Vacant housing units - For rent (% change since 2000)
Vacant housing units - For sale only (%)
Vacant housing units - For sale only (% change since 2000)
Vacant housing units - Rented or sold, not occupied (%)
Vacant housing units - Rented or sold, not occupied (% change since 2000)
Vacant housing units - For seasonal, recreational, or occasional use (%)
Vacant housing units - For seasonal, recreational, or occasional use (% change since 2000)
Vacant housing units - For migrant workers (%)
Vacant housing units - For migrant workers (% change since 2000)
Vacant housing units - Other vacant (%)
Vacant housing units - Other vacant (% change since 2000)
Median monthly housing costs ($)
Median household income for houses/condos with a mortgage ($)
Median household income for houses/condos without a mortgage ($)
Median household income ($)
Median household income ($) - White
Median household income ($) - Black or African American
Median household income ($) - Asian
Median household income ($) - Hispanic or Latino
Median household income ($) - American Indian and Alaska Native
Median household income ($) - Multirace
Median household income ($) - Other Race
Mortgage status - with mortgage (%)
Mortgage status - with second mortgage (%)
Mortgage status - with home equity loan (%)
Mortgage status - with both second mortgage and home equity loan (%)
Mortgage status - without a mortgage (%)
Median year house/condo built
Median year apartment built
Household type by relationship - Male householder living alone (%)
Household type by relationship - Male householder not living alone (%)
Household type by relationship - Female householder living alone (%)
Household type by relationship - Female householder not living alone (%)
Household type by relationship - Opposite-Sex spouse (%)
Household type by relationship - Same-Sex spouse (%)
Household type by relationship - Opposite-Sex unmarried partner (%)
Household type by relationship - Same-Sex unmarried partner (%)
Household type by relationship - In group quarters (%)
Size of family households - 2-person household (%)
Size of family households - 3-person household (%)
Size of family households - 4-person household (%)
Size of family households - 5-person household (%)
Size of family households - 6-person household (%)
Size of family households - 7-or-more-person household (%)
Size of nonfamily households - 1-person household (%)
Size of nonfamily households - 2-person household (%)
Size of nonfamily households - 3-person household (%)
Size of nonfamily households - 4-person household (%)
Size of nonfamily households - 5-person household (%)
Size of nonfamily households - 6-person household (%)
Size of nonfamily households - 7-or-moreperson household (%)
Year house built - Built 2010 or later (%)
Year house built - Built 2000 to 2009 (%)
Year house built - Built 1990 to 1999 (%)
Year house built - Built 1980 to 1989 (%)
Year house built - Built 1970 to 1979 (%)
Year house built - Built 1960 to 1969 (%)
Year house built - Built 1950 to 1959 (%)
Year house built - Built 1940 to 1949 (%)
Year house built - Built 1939 or earlier (%)
Median number of rooms in houses and condos
Median number of rooms in apartments
Median number of bedrooms in owner occupied houses
Mean number of bedrooms in owner occupied houses
Median number of bedrooms in renter occupied houses
Mean number of bedrooms in renter occupied houses
Median number of vehichles in owner occupied houses
Mean number of vehichles in owner occupied houses
Median number of vehichles in renter occupied houses
Mean number of vehichles in renter occupied houses
Rooms in owner-occupied houses - 1 room (%)
Rooms in owner-occupied houses - 2 rooms (%)
Rooms in owner-occupied houses - 3 rooms (%)
Rooms in owner-occupied houses - 4 rooms (%)
Rooms in owner-occupied houses - 5 rooms (%)
Rooms in owner-occupied houses - 6 rooms (%)
Rooms in owner-occupied houses - 7 rooms (%)
Rooms in owner-occupied houses - 8 rooms (%)
Rooms in owner-occupied houses - 9+ rooms (%)
Rooms in renter-occupied houses - 1 room (%)
Rooms in renter-occupied houses - 2 rooms (%)
Rooms in renter-occupied houses - 3 rooms (%)
Rooms in renter-occupied houses - 4 rooms (%)
Rooms in renter-occupied houses - 5 rooms (%)
Rooms in renter-occupied houses - 6 rooms (%)
Rooms in renter-occupied houses - 7 rooms (%)
Rooms in renter-occupied houses - 8 rooms (%)
Rooms in renter-occupied houses - 9+ rooms (%)
Bedrooms in owner-occupied houses - no bedrooms (%)
Bedrooms in owner-occupied houses - 1 bedroom (%)
Bedrooms in owner-occupied houses - 2 bedrooms (%)
Bedrooms in owner-occupied houses - 3 bedrooms (%)
Bedrooms in owner-occupied houses - 4 bedrooms (%)
Bedrooms in owner-occupied houses - 5+ bedrooms (%)
Bedrooms in renter-occupied houses - no bedrooms (%)
Bedrooms in renter-occupied houses - 1 bedroom (%)
Bedrooms in renter-occupied houses - 2 bedrooms (%)
Bedrooms in renter-occupied houses - 3 bedrooms (%)
Bedrooms in renter-occupied houses - 4 bedrooms (%)
Bedrooms in renter-occupied houses - 5+ bedrooms (%)
Vehicles available in owner-occupied houses - no vehicle available (%)
Vehicles available in owner-occupied houses - 1 vehicle available(%)
Vehicles available in owner-occupied houses - 2 Vehicles available (%)
Vehicles available in owner-occupied houses - 3 Vehicles available (%)
Vehicles available in owner-occupied houses - 4 Vehicles available (%)
Vehicles available in owner-occupied houses - 5+ Vehicles available (%)
Vehicles available in renter-occupied houses - no vehicle available (%)
Vehicles available in renter-occupied houses - 1 vehicle available (%)
Vehicles available in renter-occupied houses - 2 Vehicles available (%)
Vehicles available in renter-occupied houses - 3 Vehicles available (%)
Vehicles available in renter-occupied houses - 4 Vehicles available (%)
Vehicles available in renter-occupied houses - 5+ Vehicles available (%)
Housing units in structures - 1, detached (%)
Housing units in structures - 1, attached (%)
Housing units in structures - 2 (%)
Housing units in structures - 3 or 4 (%)
Housing units in structures - 5 to 9 (%)
Housing units in structures - 10 to 19 (%)
Housing units in structures - 20 to 49 (%)
Housing units in structures - 50 or more (%)
Housing units in structures - Mobile home (%)
Housing units in structures - Boat, RV, van, etc. (%)
Housing units in structures - Owners - 1, detached (%)
Housing units in structures - Owners - 1, attached (%)
Housing units in structures - Owners - 2 (%)
Housing units in structures - Owners - 3 or 4 (%)
Housing units in structures - Owners - 5 to 9 (%)
Housing units in structures - Owners - 10 to 19 (%)
Housing units in structures - Owners - 20 to 49 (%)
Housing units in structures - Owners - 50 or more (%)
Housing units in structures - Owners - Mobile home (%)
Housing units in structures - Owners - Boat, RV, van, etc. (%)
Housing units in structures - Renters - 1, detached (%)
Housing units in structures - Renters - 1, attached (%)
Housing units in structures - Renters - 2 (%)
Housing units in structures - Renters - 3 or 4 (%)
Housing units in structures - Renters - 5 to 9 (%)
Housing units in structures - Renters - 10 to 19 (%)
Housing units in structures - Renters - 20 to 49 (%)
Housing units in structures - Renters - 50 or more (%)
Housing units in structures - Renters - Mobile home (%)
Housing units in structures - Renters - Boat, RV, van, etc. (%)
House/condo owner moved in on average (years ago)
Renter moved in on average (years ago)
Year householder moved into unit - Moved in 1999 to March 2000 (%)
Year householder moved into unit - Moved in 1999 to March 2000 (%) - White
Year householder moved into unit - Moved in 1999 to March 2000 (%) - Black or African American
Year householder moved into unit - Moved in 1999 to March 2000 (%) - Asian
Year householder moved into unit - Moved in 1999 to March 2000 (%) - Hispanic or Latino
Year householder moved into unit - Moved in 1999 to March 2000 (%) - American Indian and Alaska Native
Year householder moved into unit - Moved in 1999 to March 2000 (%) - Multirace
Year householder moved into unit - Moved in 1999 to March 2000 (%) - Other Race
Year householder moved into unit - Moved in 1995 to 1998 (%)
Year householder moved into unit - Moved in 1995 to 1998 (%) - White
Year householder moved into unit - Moved in 1995 to 1998 (%) - Black or African American
Year householder moved into unit - Moved in 1995 to 1998 (%) - Asian
Year householder moved into unit - Moved in 1995 to 1998 (%) - Hispanic or Latino
Year householder moved into unit - Moved in 1995 to 1998 (%) - American Indian and Alaska Native
Year householder moved into unit - Moved in 1995 to 1998 (%) - Multirace
Year householder moved into unit - Moved in 1995 to 1998 (%) - Other Race
Year householder moved into unit - Moved in 1990 to 1994 (%)
Year householder moved into unit - Moved in 1990 to 1994 (%) - White
Year householder moved into unit - Moved in 1990 to 1994 (%) - Black or African American
Year householder moved into unit - Moved in 1990 to 1994 (%) - Asian
Year householder moved into unit - Moved in 1990 to 1994 (%) - Hispanic or Latino
Year householder moved into unit - Moved in 1990 to 1994 (%) - American Indian and Alaska Native
Year householder moved into unit - Moved in 1990 to 1994 (%) - Multirace
Year householder moved into unit - Moved in 1990 to 1994 (%) - Other Race
Year householder moved into unit - Moved in 1980 to 1989 (%)
Year householder moved into unit - Moved in 1980 to 1989 (%) - White
Year householder moved into unit - Moved in 1980 to 1989 (%) - Black or African American
Year householder moved into unit - Moved in 1980 to 1989 (%) - Asian
Year householder moved into unit - Moved in 1980 to 1989 (%) - Hispanic or Latino
Year householder moved into unit - Moved in 1980 to 1989 (%) - American Indian and Alaska Native
Year householder moved into unit - Moved in 1980 to 1989 (%) - Multirace
Year householder moved into unit - Moved in 1980 to 1989 (%) - Other Race
Year householder moved into unit - Moved in 1970 to 1979 (%)
Year householder moved into unit - Moved in 1970 to 1979 (%) - White
Year householder moved into unit - Moved in 1970 to 1979 (%) - Black or African American
Year householder moved into unit - Moved in 1970 to 1979 (%) - Asian
Year householder moved into unit - Moved in 1970 to 1979 (%) - Hispanic or Latino
Year householder moved into unit - Moved in 1970 to 1979 (%) - American Indian and Alaska Native
Year householder moved into unit - Moved in 1970 to 1979 (%) - Multirace
Year householder moved into unit - Moved in 1970 to 1979 (%) - Other Race
Year householder moved into unit - Moved in 1969 or earlier (%)
Year householder moved into unit - Moved in 1969 or earlier (%) - White
Year householder moved into unit - Moved in 1969 or earlier (%) - Black or African American
Year householder moved into unit - Moved in 1969 or earlier (%) - Asian
Year householder moved into unit - Moved in 1969 or earlier (%) - Hispanic or Latino
Year householder moved into unit - Moved in 1969 or earlier (%) - American Indian and Alaska Native
Year householder moved into unit - Moved in 1969 or earlier (%) - Multirace
Year householder moved into unit - Moved in 1969 or earlier (%) - Other Race
Housing units lacking complete plumbing facilities (%)
Housing units lacking complete kitchen facilities (%)
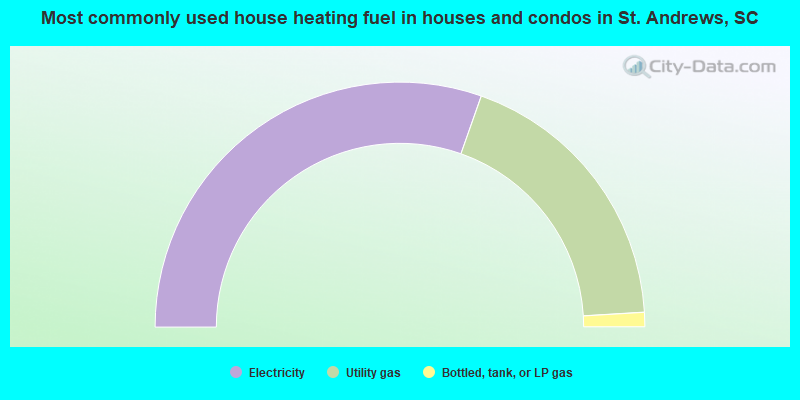
House heating fuel used in houses and condos - Utility gas (%)
House heating fuel used in houses and condos - Bottled, tank, or LP gas (%)
House heating fuel used in houses and condos - Electricity (%)
House heating fuel used in houses and condos - Fuel oil, kerosene, etc. (%)
House heating fuel used in houses and condos - Coal or coke (%)
House heating fuel used in houses and condos - Wood (%)
House heating fuel used in houses and condos - Solar energy (%)
House heating fuel used in houses and condos - Other fuel (%)
House heating fuel used in houses and condos - No fuel used (%)
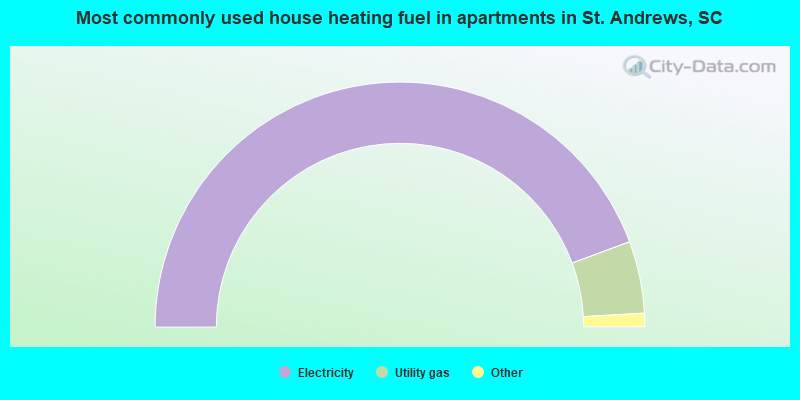
House heating fuel used in apartments - Utility gas (%)
House heating fuel used in apartments - Bottled, tank, or LP gas (%)
House heating fuel used in apartments - Electricity (%)
House heating fuel used in apartments - Fuel oil, kerosene, etc. (%)
House heating fuel used in apartments - Coal or coke (%)
House heating fuel used in apartments - Wood (%)
House heating fuel used in apartments - Solar energy (%)
House heating fuel used in apartments - Other fuel (%)
House heating fuel used in apartments - No fuel used (%)
Median year house/condo built: 1971Median year apartment built: 1980Household type by relationship:
Households: 22,193
Male householders: 3,887 (1,821 living alone ), Female householders: 6,439 (2,482 living alone )2,212 spouses (2,013 opposite-sex spouses ), 967 unmarried partners , (936 opposite-sex unmarried partners ), 5,617 children (5,414 natural , 6 adopted , 196 stepchildren ), 773 grandchildren , 491 brothers or sisters , 417 parents , 0 foster children , 453 other relatives , 821 non-relatives In group quarters: 111
Size of family households: 2,448 2-persons , 1,332 3-persons , 763 4-persons , 463 5-persons , 29 6-persons , 106 7-or-more-persons .
Size of nonfamily households: 4,371 1-person , 932 2-persons , 70 3-persons , 32 4-persons .
1,435 married couples with children. single-parent households (587 men , 2,180 women ).
92.5% of residents of St. Andrews speak English at home. of residents speak Spanish at home (73% speak English very well , 10% speak English well , 17% speak English not well ).of residents speak other Indo-European language at home (80% speak English very well , 3% speak English well , 17% speak English not well ).of residents speak Asian or Pacific Island language at home (17% speak English very well , 72% speak English well , 11% speak English not well ).of residents speak other language at home (39% speak English very well , 44% speak English well , 14% speak English not well , 3% don't speak English at all ).
Foreign born population: 1,531 (6.9%)of them are naturalized citizens )
Median number of rooms in houses and condos:
Median number of rooms in apartments
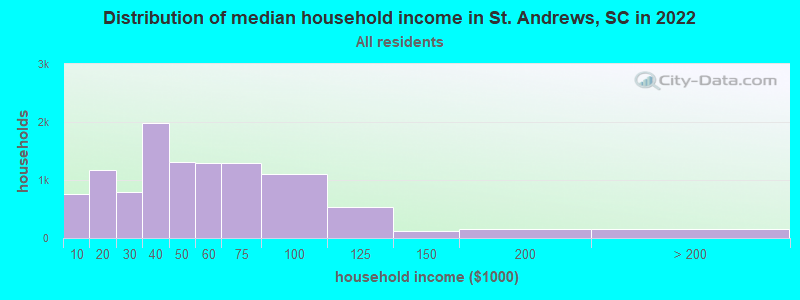
St. Andrews, SC household income distribution 757 Less than $10,0001,181 $10,000 to $19,999794 $20,000 to $29,9991,981 $30,000 to $39,9991,304 $40,000 to $49,9991,289 $50,000 to $59,9991,292 $60,000 to $74,9991,098 $75,000 to $99,999533 $100,000 to $124,999116 $125,000 to $149,999161 $150,000 to $199,999156 $200,000 or more
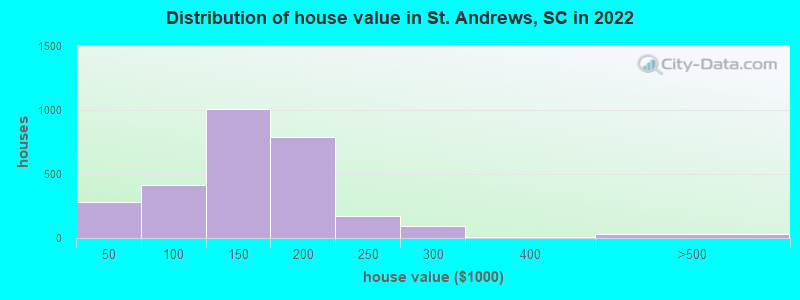
Home value of owner - occupied houses in 2022 in St. Andrews, SC 20 Less than $10,00065 $10,000 to $14,99957 $15,000 to $19,9999 $20,000 to $24,9997 $30,000 to $34,99978 $35,000 to $39,99945 $40,000 to $49,99946 $50,000 to $59,99978 $60,000 to $69,99952 $70,000 to $79,99953 $80,000 to $89,999139 $90,000 to $99,999532 $100,000 to $124,999475 $125,000 to $149,999508 $150,000 to $174,999283 $175,000 to $199,999174 $200,000 to $249,99993 $250,000 to $299,99911 $300,000 to $399,99914 $400,000 to $499,9999 $500,000 to $749,9994 $1,000,000 to $1,499,999Rent paid by renters in 2022 in St. Andrews, SC 17 Less than $10020 $100 to $149108 $150 to $19936 $200 to $24941 $250 to $29939 $300 to $34920 $350 to $3991 $400 to $4495 $450 to $499150 $500 to $54967 $550 to $599179 $600 to $649643 $650 to $6991,195 $700 to $749883 $750 to $7991,573 $800 to $899920 $900 to $999931 $1,000 to $1,249355 $1,250 to $1,49951 $1,500 to $1,999120 $3,500 or more122 No cash rent
Percentage of workers working in this county: 61.3%Number of people working at home: 1,045 (9.8% of all workers )
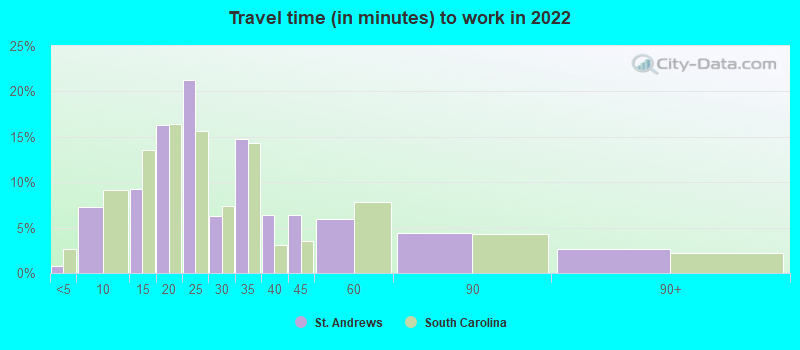
Travel time to work (commute)
Less than 5 minutes: 555 to 9 minutes: 1,06210 to 14 minutes: 1,68415 to 19 minutes: 2,59020 to 24 minutes: 1,82925 to 29 minutes: 56330 to 34 minutes: 1,02635 to 39 minutes: 9340 to 44 minutes: 20345 to 59 minutes: 23460 to 89 minutes: 23690 or more minutes: 133
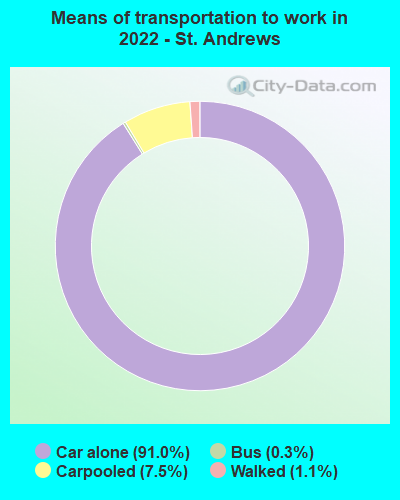
Means of transportation to work:
Drove a car alone: 4,663 (77.0%)Carpooled: 485 (8.0%)Bus : 18 (0.3%)Walked: 33 (0.5%)Worked at home: 1,045 (17.2%)
Unemployment by race in 2022
Unemployment rate for White non-Hispanic residents 9.5% Males0.9% FemalesUnemployment rate for Black residents 7.2% Males11.6% FemalesUnemployment rate for Asian residents 13.3% FemalesUnemployment rate for other race residents 24.6% FemalesUnemployment rate for two or more race residents 39.8% MalesUnemployment rate for Hispanic or Latino residents 22.8% Females
Year of entry for the foreign-born population in St. Andrews, South Carolina
1,263 2010 or later 240 2000 to 2009 109 1990 to 1999 155 1980 to 1989 104 1970 to 1979 111 Before 1970
First ancestries reported:
American: 432 (3.3%)
Jamaican: 367 (2.8%)
German: 364 (2.8%)
African: 347 (2.7%)
English: 332 (2.5%)
Moroccan: 179 (1.4%)
Irish: 153 (1.2%)
Ghanaian: 121 (0.9%)
Iraqi: 110 (0.8%)
Iranian: 95 (0.7%)
Ukrainian: 76 (0.6%)
Eastern European: 70 (0.5%)
Scotch-Irish: 62 (0.5%)
Scottish: 54 (0.4%)
Welsh: 54 (0.4%)
European: 53 (0.4%)
French: 53 (0.4%)
Polish: 47 (0.4%)
Norwegian: 46 (0.4%)
Italian: 43 (0.3%)
British: 41 (0.3%)
Ethiopian: 24 (0.2%)
Canadian: 19 (0.1%)
Trinidadian and Tobagonian: 18 (0.1%)
Nigerian: 13 (0.10%)
Latvian: 12 (0.09%)
Russian: 12 (0.09%)
Pennsylvania German: 7 (0.05%)
U.S. Virgin Islander: 7 (0.05%)
Swedish: 6 (0.05%) Most common places of birth for foreign-born residents (%): Jamaica St. Andrews:
19.3% (322)South Carolina:
2.6% (7,073)
Philippines St. Andrews:
8.9% (149)South Carolina:
4.1% (11,031)
Mexico St. Andrews:
7.8% (131)South Carolina:
22.5% (60,774)
Iran St. Andrews:
6.6% (111)South Carolina:
0.5% (1,270)
India St. Andrews:
6.3% (106)South Carolina:
6.8% (18,307)
Ghana St. Andrews:
6.3% (105)South Carolina:
0.2% (540)
Other Eastern Africa St. Andrews:
4.5% (76)South Carolina:
0.2% (427)
Ukraine St. Andrews:
3.5% (58)South Carolina:
1.4% (3,877)
Korea St. Andrews:
3.3% (55)South Carolina:
1.7% (4,513)
Congo St. Andrews:
2.7% (45)South Carolina:
0.1% (170)
Iraq St. Andrews:
2.5% (42)South Carolina:
0.3% (855)
Bangladesh St. Andrews:
2.3% (38)South Carolina:
0.2% (628)
Canada St. Andrews:
2.1% (35)South Carolina:
3.0% (8,193)
Guatemala St. Andrews:
1.7% (29)South Carolina:
3.4% (9,058)
Place of birth for U.S.-born residents:
This state: 13,028Other state: 7,251Northeast: 2,555Midwest: 1,418South: 2,726West: 653 74.5% of St. Andrews residents lived in the same house 1 years ago.
Out of people who lived in different houses, 34.9% lived in this county.
Out of people who lived in different counties, 62.0% lived in South Carolina.
St. Andrews:
74.5%State average:
86.5%
Education attainment for males 25 years and older:
No schooling: 69Nursery to 4th grade: 95th and 6th grade: 47th and 8th grade: 469th grade: 1510th grade: 5211th grade: 7512th grade, no diploma: 31High school graduate (or equivalency): 2,525Less than 1 year of college: 560Some college more than 1 year, no degree: 796Associate degree: 425Bachelor's degree: 971Master's degree: 273Professional school degree: 19Doctorate degree: 25
Education attainment for females 25 years and older:
No schooling: 75Nursery to 4th grade: 05th and 6th grade: 727th and 8th grade: 389th grade: 1010th grade: 8411th grade: 14412th grade, no diploma: 415High school graduate (or equivalency): 2,136Less than 1 year of college: 776Some college more than 1 year, no degree: 1,661Associate degree: 1,000Bachelor's degree: 1,250Master's degree: 781Professional school degree: 18Doctorate degree: 27
Housing units in structures:
One, detached: 3,653One, attached: 692Two: 6343 or 4: 1,4255 to 9: 2,38710 to 19: 2,18420 to 49: 61550 or more: 428Mobile homes: 54Housing units lacking complete plumbing facilities in 2022: 0.2%Housing units lacking complete kitchen facilities in 2022: 0.7%House/condo owner moved in on average 17 years ago
Renter moved in on average 3 years ago
Private vs. public school enrollment:
Students in private schools in grades 1 to 8 (elementary and middle school): 146 Here:
7.9%South Carolina:
14.4%
Students in private schools in grades 9 to 12 (high school): 67 Here:
6.8%South Carolina:
11.1%
Students in private undergraduate colleges: 452 Here:
37.0%South Carolina:
21.9%