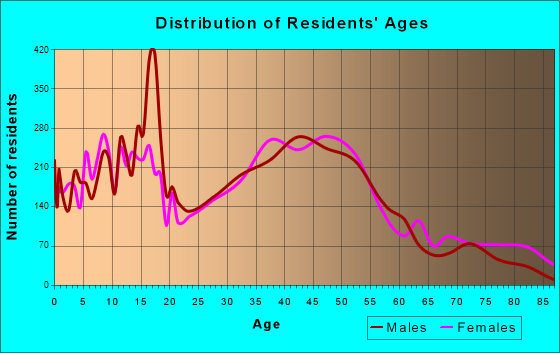
St. Charles, IL (Illinois) Houses and Residents
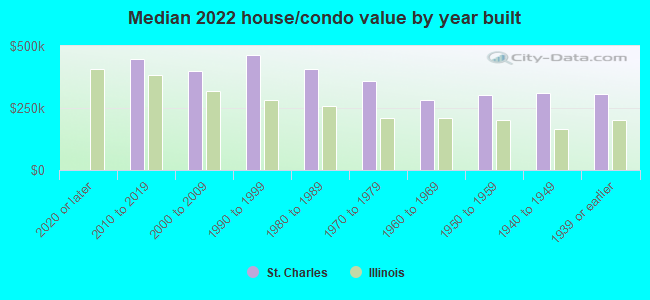
| St. Charles: | $372,492 |
| Illinois: | $251,600 |
Mean price in 2022:
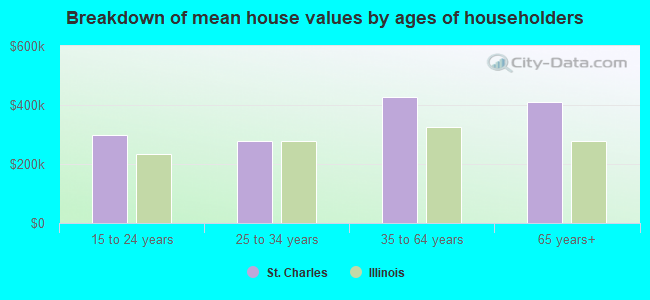
Detached houses: $437,202
Here: $437,202 State: $310,164 Townhouses or other attached units: $340,301
Here: $340,301 State: $286,230 In 2-unit structures: $347,571
Here: $347,571 State: $299,638 In 3-to-4-unit structures: $155,368
Here: $155,368 State: $330,907 In 5-or-more-unit structures: $227,412
Here: $227,412 State: $318,887
Total population: 33,387 (Urban population: 27,811, Rural population: 144 (all nonfarm))
Houses: 14,159 (13,416 occupied: 9,506 owner occupied, 3,912 renter occupied)
| % of renters here: | 29% |
| State: | 33% |
Housing density: 1,012 houses/condos per square mile
Median price asked for vacant for-sale houses and condos in 2022: $398,836.
Median contract rent in 2022: $1,431 (lower quartile is $1,140, upper quartile is $1,893)
Median rent asked for vacant for-rent units in 2022: $1,808
Median gross rent in St. Charles, IL in 2022: $1,596
Housing units in St. Charles with a mortgage: 6,171 (736 second mortgage, 11 home equity loan, 730 both second mortgage and home equity loan)
Houses without a mortgage: 112
Median household income for houses/condos with a mortgage: $136,832
Median household income for apartments without a mortgage: $115,360
Median monthly housing costs: $1,696
Compare current foreclosures near St. Charles, IL:
| Photo | Address | Area | Beds / Baths | Price | Details |
|---|---|---|---|---|---|

|
#1
Tall Oaks Dr
Aurora, IL 60505
|
685 sq. feet
|
1 baths 1 beds |
$127,000
|
show details |

|
#2
W809 Bending Ln
Elgin, IL 60124
|
4,100 sq. feet
|
3 baths 4 beds |
$589,900
|
show details |

|
#3
Kathleen Cir
Montgomery, IL 60538
|
920 sq. feet
|
1 baths 2 beds |
$285,000
|
show details |

|
#4
Corron Rd
Elgin, IL 60124
|
3,352 sq. feet
|
3 baths 4 beds |
$685,000
|
show details |

|
#5
Amsterdam Cir
Montgomery, IL 60538
|
2,793 sq. feet
|
2 baths 4 beds |
$459,900
|
show details |

|
#6
Briar Hill Dr
Schaumburg, IL 60194
|
1,600 sq. feet
|
2 baths 4 beds |
$410,400
|
show details |

|
#7
Farrier Point Lane
Saint Charles, IL 60175
|
- sq. feet
|
3 baths 5 beds |
$561,600
|
show details |

|
#8
Serendipity Dr
Aurora, IL 60504
|
- sq. feet
|
1 baths 3 beds |
$213,200
|
show details |

|
#9
Scarsdale Ct Unit C2
Schaumburg, IL 60193
|
950 sq. feet
|
1 baths 2 beds |
show details | |

|
#10
Hesterman Dr
Glendale Heights, IL 60139
|
1,263 sq. feet
|
2 baths 2 beds |
show details |
| Photo | Address | Area | Beds / Baths | Price | Details |
|---|---|---|---|---|---|

|
#11
N Westwood Ave
Lombard, IL 60148
|
1,208 sq. feet
|
2 baths 3 beds |
show details | |

|
#12
Crystal Ave
South Elgin, IL 60177
|
720 sq. feet
|
1 baths 2 beds |
show details | |

|
#13
Palomino Dr.
Naperville, IL 60540
|
2,550 sq. feet
|
5 baths 5 beds |
show details | |

|
#14
Wilson St
Hanover Park, IL 60133
|
1,040 sq. feet
|
2 baths 2 beds |
show details | |

|
#15
Light Rd Apt 106
Oswego, IL 60543
|
724 sq. feet
|
1 baths 2 beds |
show details | |

|
#16
Laurel Dr
Aurora, IL 60506
|
1,600 sq. feet
|
2 baths 4 beds |
show details | |

|
#17
N River St
Aurora, IL 60506
|
2,240 sq. feet
|
2 baths 4 beds |
show details | |

|
#18
N Braintree Dr
Schaumburg, IL 60194
|
2,265 sq. feet
|
3 baths 4 beds |
show details | |

|
#19
Douglas Ave
Elgin, IL 60120
|
3,302 sq. feet
|
2 baths 5 beds |
show details | |

|
#20
Pine St
Sugar Grove, IL 60554
|
2,840 sq. feet
|
4 baths 4 beds |
show details |
| Photo | Address | Area | Beds / Baths | Price | Details |
|---|---|---|---|---|---|

|
#21
Breckenridge Cir
Aurora, IL 60504
|
2,250 sq. feet
|
2 baths 4 beds |
show details | |

|
#22
Otis Rd
Barrington, IL 60010
|
5,900 sq. feet
|
9 baths 7 beds |
show details | |

|
#23
Kate Dr
Montgomery, IL 60538
|
2,667 sq. feet
|
3 baths 4 beds |
show details | |

|
#24
W 104 Vly View Drive
Glen Ellyn, IL 60137
|
- sq. feet
|
1 baths 3 beds |
show details | |

|
#25
W Wrightwood Ave
Glendale Heights, IL 60139
|
1,104 sq. feet
|
1 baths 3 beds |
show details | |

|
#26
Willoughby Ct Unit D
Yorkville, IL 60560
|
1,590 sq. feet
|
2 baths 3 beds |
show details | |

|
#27
Grace Ln
Schaumburg, IL 60193
|
976 sq. feet
|
1 baths 3 beds |
show details | |

|
#28
Indian Dr
Glen Ellyn, IL 60137
|
1,327 sq. feet
|
1 baths 3 beds |
show details | |

|
#29
Winston Dr
Schaumburg, IL 60192
|
1,379 sq. feet
|
2 baths 3 beds |
show details | |

|
#30
Newcastle Dr
Roselle, IL 60172
|
1,743 sq. feet
|
3 baths 3 beds |
show details |
| Photo | Address | Area | Beds / Baths | Price | Details |
|---|---|---|---|---|---|

|
#31
Pond Gate Dr
Barrington, IL 60010
|
4,996 sq. feet
|
2 baths 4 beds |
show details | |

|
#32
Fernwood Ln
Algonquin, IL 60102
|
5,776 sq. feet
|
5 baths 5 beds |
show details | |

|
#33
Upper Pond Rd
Barrington, IL 60010
|
2,820 sq. feet
|
3 baths 4 beds |
show details | |

|
#34
W Marilyn Ter
Addison, IL 60101
|
1,004 sq. feet
|
2 baths 3 beds |
show details | |

|
#35
Shawnee Dr
Carol Stream, IL 60188
|
1,827 sq. feet
|
2 baths 4 beds |
show details | |

|
#36
Morgan Ln
Hoffman Estates, IL 60169
|
1,252 sq. feet
|
1 baths 3 beds |
show details | |

|
#37
E State St
North Aurora, IL 60542
|
2,070 sq. feet
|
1 baths 5 beds |
show details | |

|
#38
E Fullerton Ave Apt 104
Glendale Heights, IL 60139
|
804 sq. feet
|
1 baths 2 beds |
show details | |

|
#39
N Oltendorf Rd
Streamwood, IL 60107
|
1,235 sq. feet
|
1 baths 2 beds |
show details | |

|
#40
Hamlet Cir
Montgomery, IL 60538
|
1,338 sq. feet
|
2 baths 2 beds |
show details |
| Photo | Address | Area | Beds / Baths | Price | Details |
|---|---|---|---|---|---|

|
#41
Garritano St Unit B
Yorkville, IL 60560
|
1,551 sq. feet
|
2 baths 2 beds |
show details | |

|
#42
Dumoulin Ave
Lisle, IL 60532
|
808 sq. feet
|
1 baths 2 beds |
show details | |

|
#43
Meadow View Dr
Saint Charles, IL 60175
|
3,560 sq. feet
|
2 baths 4 beds |
show details | |

|
#44
2nd Ave
Aurora, IL 60505
|
864 sq. feet
|
1 baths 3 beds |
show details | |

|
#45
Jameson Ct E
Carol Stream, IL 60188
|
1,766 sq. feet
|
2 baths 3 beds |
show details | |

|
#46
Swift Rd Unit 1b
Glen Ellyn, IL 60137
|
1,076 sq. feet
|
2 baths 2 beds |
show details | |

|
#47
Edgewood Ave
Hampshire, IL 60140
|
1,359 sq. feet
|
1 baths 3 beds |
show details | |

|
#48
Foran Ln
Aurora, IL 60506
|
864 sq. feet
|
1 baths 3 beds |
show details | |

|
#49
Cherry Ave
Hanover Park, IL 60133
|
1,246 sq. feet
|
1 baths 3 beds |
show details | |

|
Check over 1 million property listings on Foreclosure.com!
|
browse all offers | |||


 | What will happen when houses get their final pick? (9 replies) |
| House/Townhouse/Apartment for Rent in Cary, Crystal Lake, or St. Charles? (2 replies) |
| Churchill Condos in Glen Ellyn (515 N. Main St.) (6 replies) |
| St. Charles and Environs from the near west burbs (21 replies) |
| St. Charles or Geneva Apartments? (8 replies) |
| St. Charles Home Values ??? (24 replies) |
Median year apartment built: 1983
Household type by relationship:
Households: 32,581- Male householders: 6,721 (1,340 living alone), Female householders: 6,478 (1,997 living alone)
7,431 spouses (7,376 opposite-sex spouses), 1,031 unmarried partners, (1,015 opposite-sex unmarried partners), 9,237 children (8,571 natural, 513 adopted, 152 stepchildren), 220 grandchildren, 130 brothers or sisters, 288 parents, 60 foster children, 162 other relatives, 425 non-relatives
- In group quarters: 392
Size of family households: 4,384 2-persons, 2,574 3-persons, 1,658 4-persons, 426 5-persons, 219 6-persons, 85 7-or-more-persons.
Size of nonfamily households: 3,369 1-person, 751 2-persons, 131 3-persons, 17 4-persons.
4,476 married couples with children.
1,289 single-parent households (444 men, 845 women).
83.7% of residents of St. Charles speak English at home.
7.6% of residents speak Spanish at home (71% speak English very well, 23% speak English well, 5% speak English not well, 1% don't speak English at all).
7.4% of residents speak other Indo-European language at home (76% speak English very well, 15% speak English well, 7% speak English not well, 2% don't speak English at all).
1.8% of residents speak Asian or Pacific Island language at home (79% speak English very well, 10% speak English well, 11% speak English not well).
Foreign born population: 3,561 (10.9%)
(73.9% of them are naturalized citizens)
| Here: | 7.5 |
| State: | 6.4 |
| Here: | 3.9 |
| State: | 4.1 |
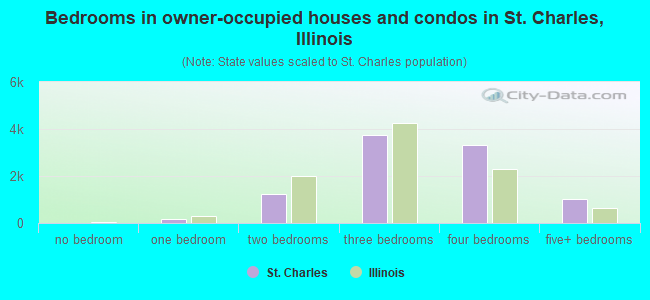
- Bedrooms in owner-occupied houses and condos in St. Charles, Illinois
- 0no bedroom
- 1491 bedroom
- 1,2292 bedrooms
- 3,7633 bedrooms
- 3,3364 bedrooms
- 1,0305+ bedrooms
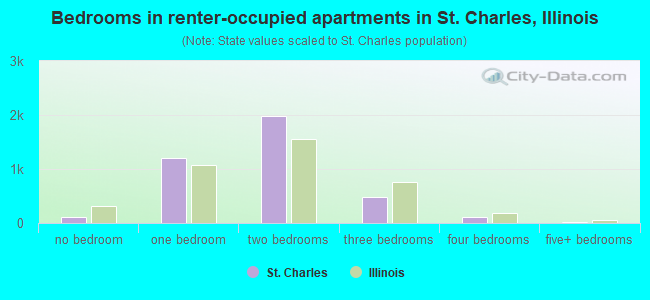
- Bedrooms in renter-occupied apartments in St. Charles, Illinois
- 107no bedroom
- 1,2101 bedroom
- 1,9882 bedrooms
- 4843 bedrooms
- 1144 bedrooms
- 105+ bedrooms
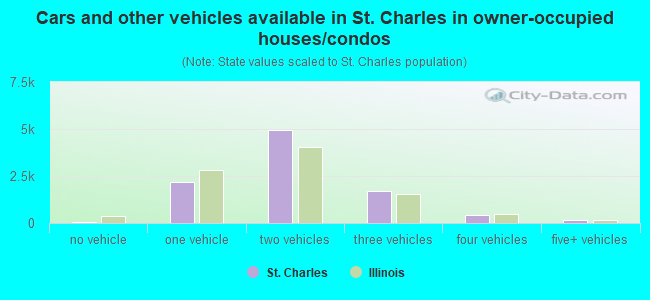
- Cars and other vehicles available in St. Charles in owner-occupied houses/condos
- 73no vehicle
- 2,1791 vehicle
- 4,9702 vehicles
- 1,7043 vehicles
- 4464 vehicles
- 1355+ vehicles
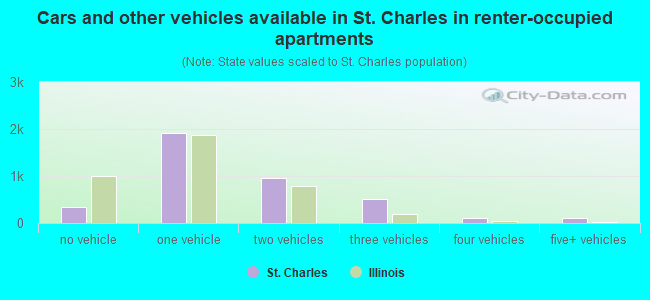
- Cars and other vehicles available in St. Charles in renter-occupied apartments
- 336no vehicle
- 1,9101 vehicle
- 9522 vehicles
- 5123 vehicles
- 1064 vehicles
- 975+ vehicles
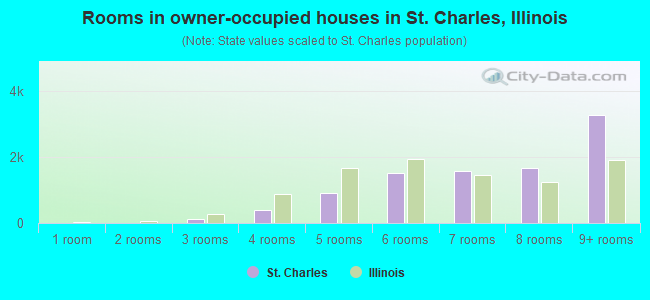
- Rooms in owner-occupied houses in St. Charles, Illinois
- 01 room
- 02 rooms
- 1233 rooms
- 4054 rooms
- 9145 rooms
- 1,5216 rooms
- 1,5917 rooms
- 1,6708 rooms
- 3,2829+ rooms
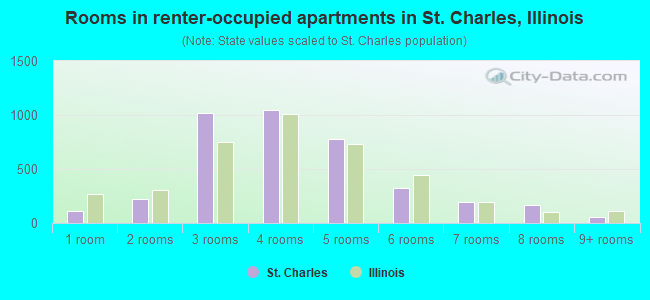
- Rooms in renter-occupied apartments in St. Charles, Illinois
- 1071 room
- 2202 rooms
- 1,0193 rooms
- 1,0454 rooms
- 7805 rooms
- 3236 rooms
- 1937 rooms
- 1688 rooms
- 589+ rooms
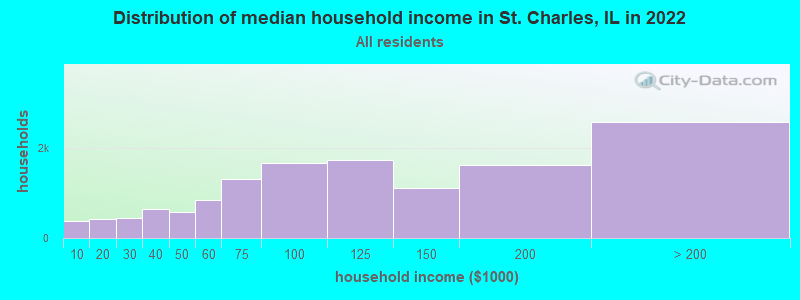
St. Charles, IL household income distribution

- 384Less than $10,000
- 428$10,000 to $19,999
- 437$20,000 to $29,999
- 653$30,000 to $39,999
- 583$40,000 to $49,999
- 845$50,000 to $59,999
- 1,317$60,000 to $74,999
- 1,675$75,000 to $99,999
- 1,740$100,000 to $124,999
- 1,107$125,000 to $149,999
- 1,629$150,000 to $199,999
- 2,580$200,000 or more
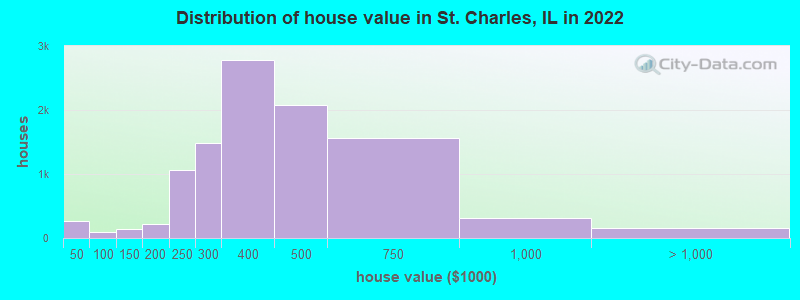
Home value of owner - occupied houses in 2022 in St. Charles, IL
-
- 80Less than $10,000
- 41$10,000 to $14,999
- 20$15,000 to $19,999
- 42$20,000 to $24,999
- 22$25,000 to $29,999
- 14$30,000 to $34,999
- 38$40,000 to $49,999
- 15$60,000 to $69,999
- 17$70,000 to $79,999
- 24$80,000 to $89,999
- 61$100,000 to $124,999
- 72$125,000 to $149,999
- 44$150,000 to $174,999
- 178$175,000 to $199,999
- 1,068$200,000 to $249,999
- 1,491$250,000 to $299,999
- 2,780$300,000 to $399,999
- 2,081$400,000 to $499,999
- 1,560$500,000 to $749,999
- 309$750,000 to $999,999
- 82$1,000,000 to $1,499,999
- 31$1,500,000 to $1,999,999
- 36$2,000,000 or more
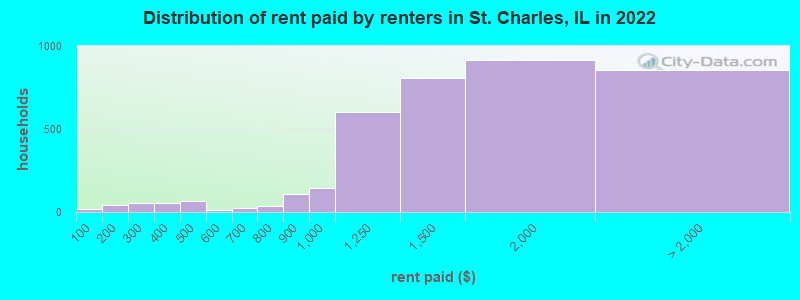
Rent paid by renters in 2022 in St. Charles, IL
-
- 21Less than $100
- 37$100 to $149
- 6$150 to $199
- 53$200 to $249
- 24$300 to $349
- 29$350 to $399
- 63$400 to $449
- 10$550 to $599
- 5$600 to $649
- 18$650 to $699
- 38$700 to $749
- 108$800 to $899
- 143$900 to $999
- 603$1,000 to $1,249
- 809$1,250 to $1,499
- 914$1,500 to $1,999
- 580$2,000 to $2,499
- 145$2,500 to $2,999
- 44$3,000 to $3,499
- 16$3,500 or more
- 71No cash rent
Percentage of workers working in this county: 59.4%
Number of people working at home: 2,510 (13.9% of all workers)
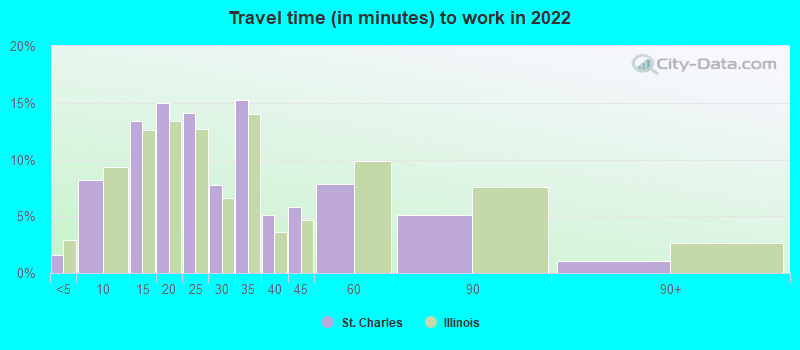
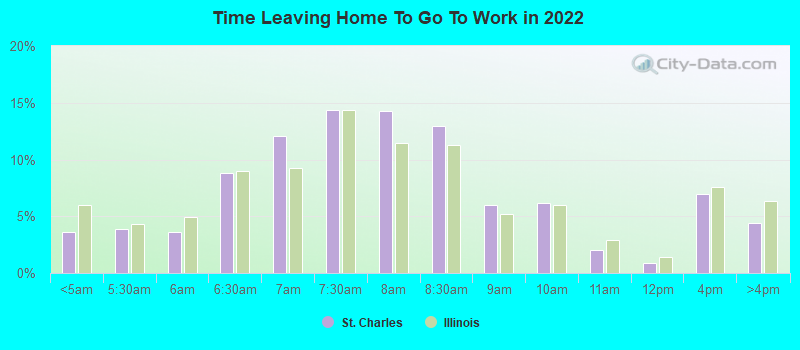
Travel time to work (commute)
- Less than 5 minutes: 329
- 5 to 9 minutes: 1,769
- 10 to 14 minutes: 2,183
- 15 to 19 minutes: 2,245
- 20 to 24 minutes: 1,296
- 25 to 29 minutes: 704
- 30 to 34 minutes: 2,620
- 35 to 39 minutes: 552
- 40 to 44 minutes: 814
- 45 to 59 minutes: 1,399
- 60 to 89 minutes: 1,125
- 90 or more minutes: 417
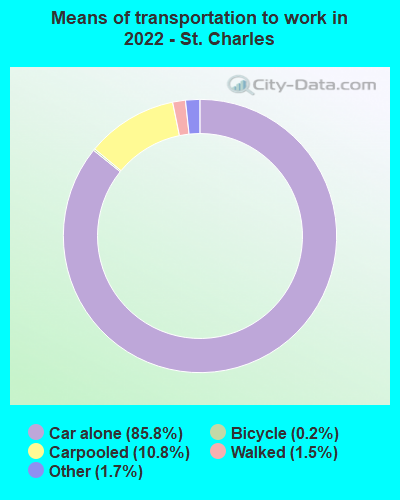
Means of transportation to work:
- Drove a car alone: 21,741 (76.9%)
- Carpooled: 2,907 (10.3%)
- Bus: 15 (0.1%)
- Long-distance train or commuter rail: 5 (0.0%)
- Taxi: 572 (2.0%)
- Bicycle: 78 (0.3%)
- Walked: 313 (1.1%)
- Worked at home: 2,510 (8.9%)
- Unemployment by race in 2022
- Unemployment rate for White non-Hispanic residents
- 2.2%Males
- 3.3%Females
- Unemployment rate for Black residents
- 70.7%Males
- 2.5%Females
- Unemployment rate for Asian residents
- 3.7%Males
- Unemployment rate for two or more race residents
- 4.9%Males
- 8.9%Females
- Unemployment rate for Hispanic or Latino residents
- 3.9%Males
- 1.5%Females
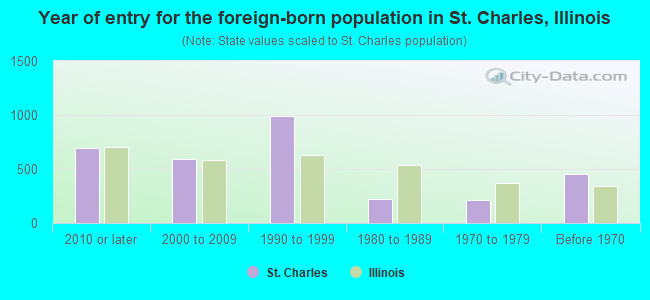
- Year of entry for the foreign-born population in St. Charles, Illinois
- 6982010 or later
- 5952000 to 2009
- 9881990 to 1999
- 2211980 to 1989
- 2161970 to 1979
- 455Before 1970
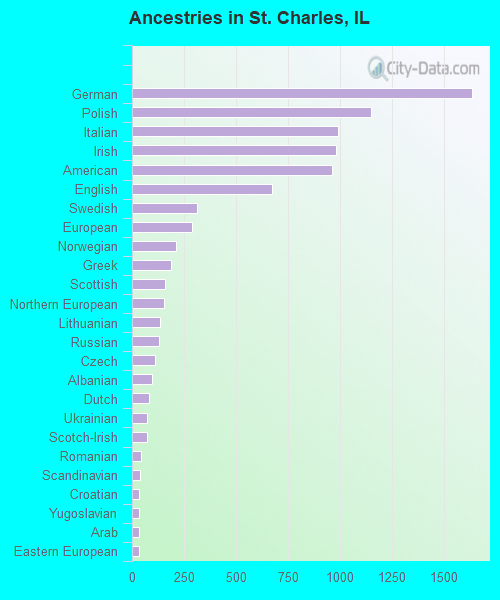
First ancestries reported:
- German: 1,637 (12.1%)
- Polish: 1,150 (8.5%)
- Italian: 992 (7.3%)
- Irish: 984 (7.3%)
- American: 962 (7.1%)
- English: 672 (5.0%)
- Swedish: 315 (2.3%)
- European: 291 (2.2%)
- Norwegian: 211 (1.6%)
- Greek: 190 (1.4%)
- Scottish: 160 (1.2%)
- Northern European: 154 (1.1%)
- Lithuanian: 136 (1.0%)
- Russian: 129 (1.0%)
- Czech: 109 (0.8%)
- Albanian: 96 (0.7%)
- Dutch: 84 (0.6%)
- Ukrainian: 73 (0.5%)
- Scotch-Irish: 72 (0.5%)
- Romanian: 41 (0.3%)
- Scandinavian: 40 (0.3%)
- Croatian: 36 (0.3%)
- Yugoslavian: 36 (0.3%)
- Arab: 35 (0.3%)
- Eastern European: 32 (0.2%)
- Slovak: 27 (0.2%)
- Danish: 26 (0.2%)
- Hungarian: 22 (0.2%)
- Canadian: 21 (0.2%)
- Lebanese: 16 (0.1%)
- Macedonian: 15 (0.1%)
- Austrian: 13 (0.10%)
- French: 13 (0.10%)
- Portuguese: 13 (0.10%)
- Slovene: 12 (0.09%)
- French Canadian: 11 (0.08%)
- Pennsylvania German: 8 (0.06%)
- Swiss: 5 (0.04%)
- Belgian: 4 (0.03%)
- British: 3 (0.02%)
Most common places of birth for foreign-born residents (%):
| St. Charles: | 23.5% (811) |
| Illinois: | 34.7% (626,958) |
| St. Charles: | 19.3% (667) |
| Illinois: | 9.2% (166,409) |
| St. Charles: | 11.2% (389) |
| Illinois: | 6.9% (124,474) |
| St. Charles: | 5.4% (188) |
| Illinois: | 5.2% (93,003) |
| St. Charles: | 4.8% (167) |
| Illinois: | 0.9% (15,679) |
| St. Charles: | 4.4% (152) |
| Illinois: | 0.9% (16,553) |
| St. Charles: | 4.4% (152) |
| Illinois: | 1.0% (18,753) |
| St. Charles: | 4.2% (144) |
| Illinois: | 0.6% (10,249) |
| St. Charles: | 3.9% (135) |
| Illinois: | 0.9% (16,308) |
| St. Charles: | 2.3% (78) |
| Illinois: | 2.2% (40,393) |
| St. Charles: | 1.9% (65) |
| Illinois: | 0.4% (7,171) |
| St. Charles: | 1.7% (59) |
| Illinois: | 0.6% (10,720) |
| St. Charles: | 1.5% (52) |
| Illinois: | 1.1% (19,306) |
Place of birth for U.S.-born residents:
- This state: 23,300
- Other state: 5,306
- Northeast: 1,233
- Midwest: 2,695
- South: 779
- West: 710
85.5% of St. Charles residents lived in the same house 1 years ago.
Out of people who lived in different houses, 32.0% lived in this county.
Out of people who lived in different counties, 74.4% lived in Illinois.
| St. Charles: | 85.5% |
| State average: | 88.3% |
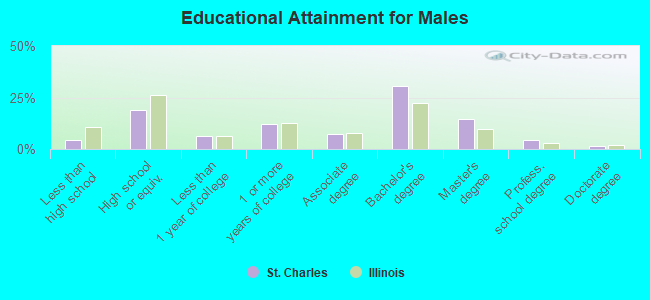
Education attainment for males 25 years and older:
- No schooling: 69
- Nursery to 4th grade: 0
- 5th and 6th grade: 64
- 7th and 8th grade: 14
- 9th grade: 5
- 10th grade: 119
- 11th grade: 80
- 12th grade, no diploma: 132
- High school graduate (or equivalency): 2,138
- Less than 1 year of college: 740
- Some college more than 1 year, no degree: 1,349
- Associate degree: 834
- Bachelor's degree: 3,464
- Master's degree: 1,649
- Professional school degree: 488
- Doctorate degree: 152
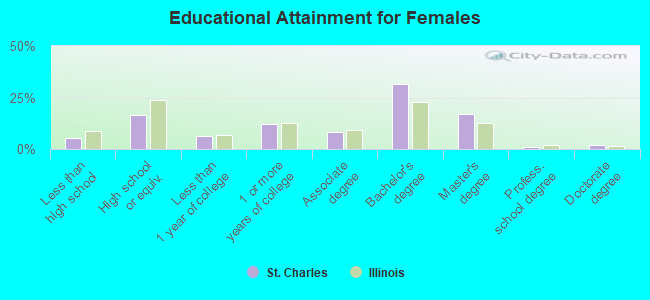
Education attainment for females 25 years and older:
- No schooling: 120
- Nursery to 4th grade: 48
- 5th and 6th grade: 0
- 7th and 8th grade: 47
- 9th grade: 28
- 10th grade: 41
- 11th grade: 105
- 12th grade, no diploma: 235
- High school graduate (or equivalency): 1,903
- Less than 1 year of college: 760
- Some college more than 1 year, no degree: 1,389
- Associate degree: 953
- Bachelor's degree: 3,680
- Master's degree: 2,004
- Professional school degree: 126
- Doctorate degree: 224
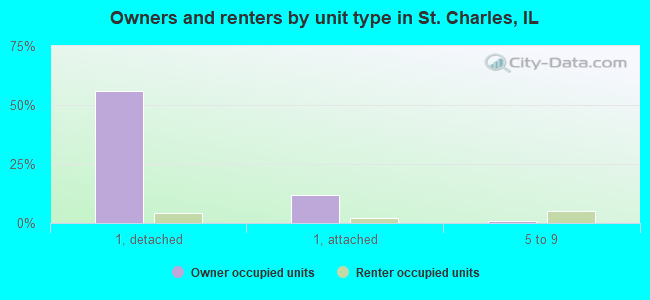
Housing units in structures:
- One, detached: 8,430
- One, attached: 1,980
- Two: 282
- 3 or 4: 760
- 5 to 9: 775
- 10 to 19: 734
- 20 to 49: 250
- 50 or more: 943
Housing units lacking complete kitchen facilities in 2022: 1.8%
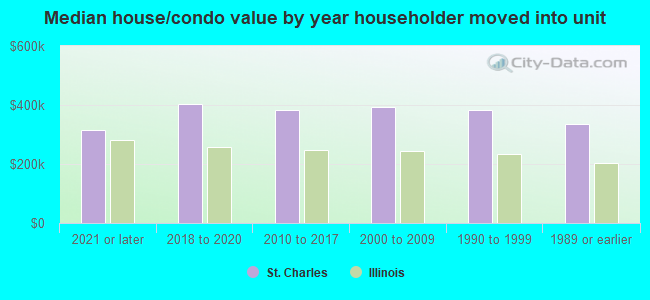
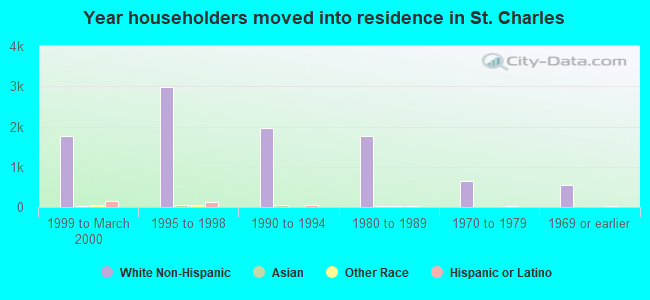
House/condo owner moved in on average 11 years ago
Renter moved in on average 1 years ago
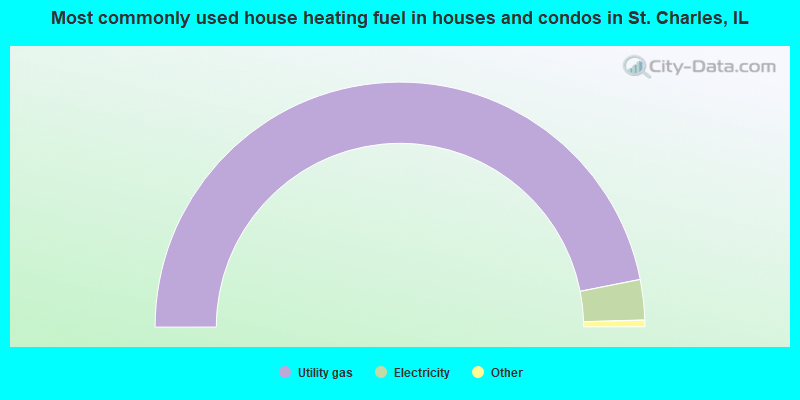
- 93.8%Utility gas
- 5.3%Electricity
- 0.6%Bottled, tank, or LP gas
- 0.1%Wood
- 0.1%No fuel used
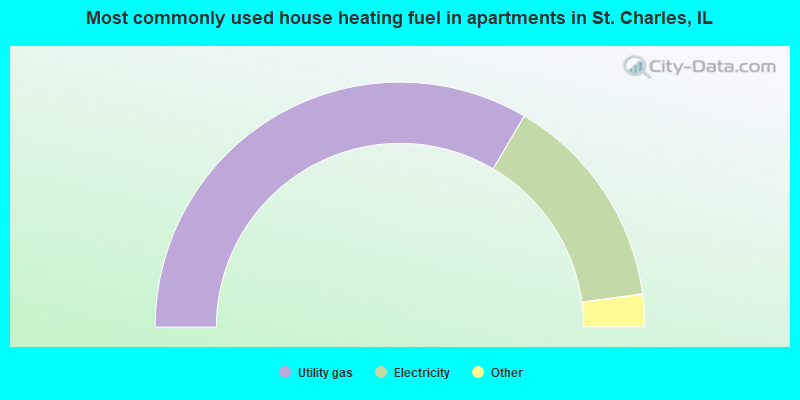
- 66.9%Utility gas
- 28.7%Electricity
- 2.7%No fuel used
- 1.6%Bottled, tank, or LP gas
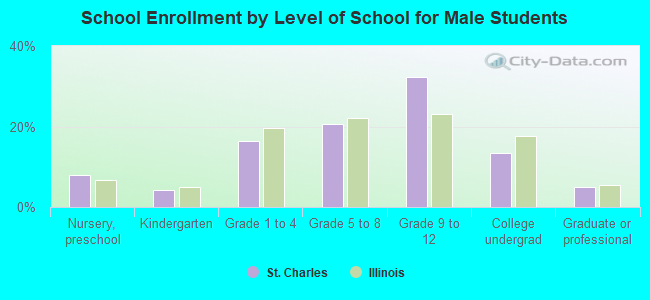
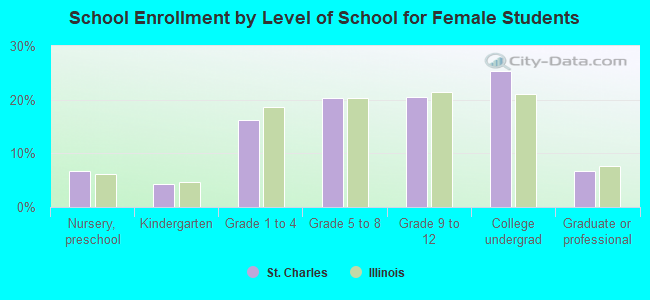
Private vs. public school enrollment:
| Here: | 8.9% |
| Illinois: | 13.3% |
| Here: | 10.2% |
| Illinois: | 9.9% |
| Here: | 30.6% |
| Illinois: | 27.4% |