St. Clair Shores, MI (Michigan) Houses and Residents
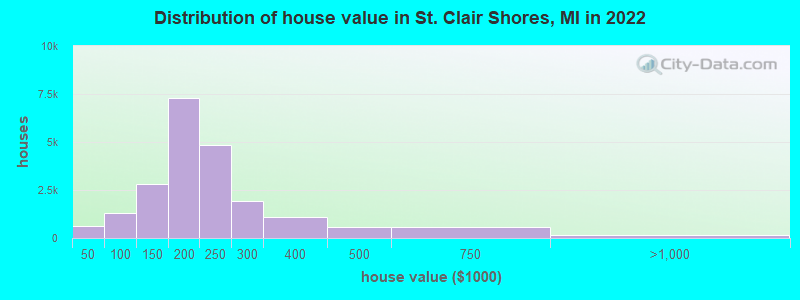
Estimated median house or condo value in 2022: $201,594 (it was $122,500 in 2000 )
St. Clair Shores:
$201,594Michigan:
$224,400
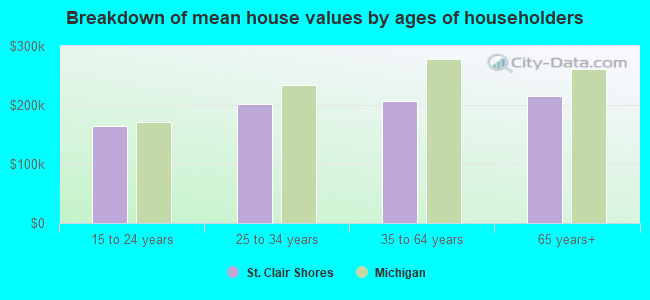
Lower value quartile - upper value quartile: $160,417 - $251,691Mean price in 2022: Detached houses: $221,274 Here:
$221,274State:
$280,038
Townhouses or other attached units: $187,806 Here:
$187,806State:
$239,520
In 2-unit structures: $290,385 Here:
$290,385State:
$219,481
In 3-to-4-unit structures: $107,365 Here:
$107,365State:
$207,067
In 5-or-more-unit structures: $80,615 Here:
$80,615State:
$192,733
Mobile homes: $24,783 Here:
$24,783State:
$72,868
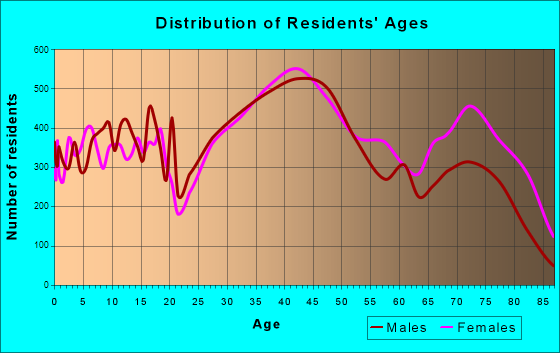
Total population: 60,036 (All urban)
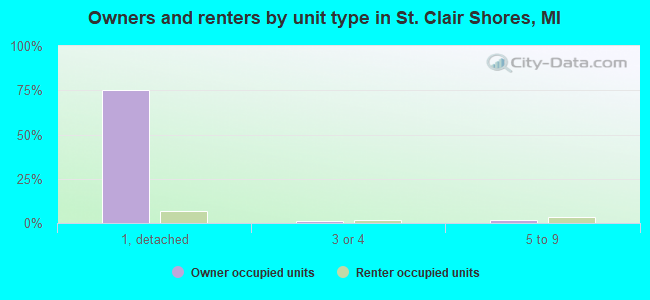
Houses: 28,638 (27,557 occupied: 23,018 owner occupied, 4,649 renter occupied )
% of renters here:
17%State:
27%
Housing density: 2,484 houses/condos per square mile
Median price asked for vacant for-sale houses and condos in 2022: $162,792.
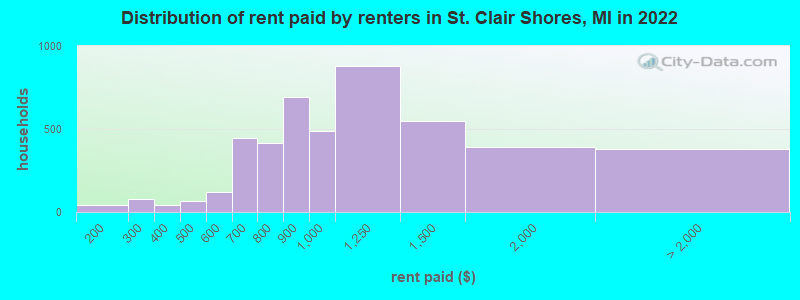
Median contract rent in 2022: $964 (lower quartile is $773, upper quartile is $1,238)
Median rent asked for vacant for-rent units in 2022: $2,641
Median gross rent in St. Clair Shores, MI in 2022: $1,127
Housing units in St. Clair Shores with a mortgage: 13,990 (1,272 second mortgage, 25 home equity loan, 1,095 both second mortgage and home equity loan )Houses without a mortgage: 492
Median household income for houses/condos with a mortgage: $92,213
Median household income for apartments without a mortgage: $52,498
Median monthly housing costs: $1,057
Data:
Median house or condo value ($)
Median house or condo value ($ change since 2000)
Median house or condo value ($) - White
Median house or condo value ($) - Black or African American
Median house or condo value ($) - Asian
Median house or condo value ($) - Hispanic or Latino
Median house or condo value ($) - American Indian and Alaska Native
Median house or condo value ($) - Multirace
Median house or condo value ($) - Other Race
Median price asked for mobile homes ($)
Household density (households per square mile)
Mean house or condo value by units in structure - 1, detached ($)
Mean house or condo value by units in structure - 1, attached ($)
Mean house or condo value by units in structure - 2 ($)
Mean house or condo value by units in structure by units in structure - 3 or 4 ($)
Mean house or condo value by units in structure - 5 or more ($)
Mean house or condo value by units in structure - Boat, RV, van, etc. ($)
Mean house or condo value by units in structure - Mobile home ($)
Median contract rent ($)
Median contract rent - Lower quartile ($)
Median contract rent - Upper quartile ($)
Median gross rent ($)
Urban houses (%)
Rural houses (%)
Houses occupied (%)
Houses occupied (% change since 2000)
Houses owner occupied (%)
Houses owner occupied (% change since 2000)
Houses renter occupied (%)
Houses renter occupied (% change since 2000)
Vacant housing units - For rent (%)
Vacant housing units - For rent (% change since 2000)
Vacant housing units - For sale only (%)
Vacant housing units - For sale only (% change since 2000)
Vacant housing units - Rented or sold, not occupied (%)
Vacant housing units - Rented or sold, not occupied (% change since 2000)
Vacant housing units - For seasonal, recreational, or occasional use (%)
Vacant housing units - For seasonal, recreational, or occasional use (% change since 2000)
Vacant housing units - For migrant workers (%)
Vacant housing units - For migrant workers (% change since 2000)
Vacant housing units - Other vacant (%)
Vacant housing units - Other vacant (% change since 2000)
Median monthly housing costs ($)
Median household income for houses/condos with a mortgage ($)
Median household income for houses/condos without a mortgage ($)
Median household income ($)
Median household income ($) - White
Median household income ($) - Black or African American
Median household income ($) - Asian
Median household income ($) - Hispanic or Latino
Median household income ($) - American Indian and Alaska Native
Median household income ($) - Multirace
Median household income ($) - Other Race
Mortgage status - with mortgage (%)
Mortgage status - with second mortgage (%)
Mortgage status - with home equity loan (%)
Mortgage status - with both second mortgage and home equity loan (%)
Mortgage status - without a mortgage (%)
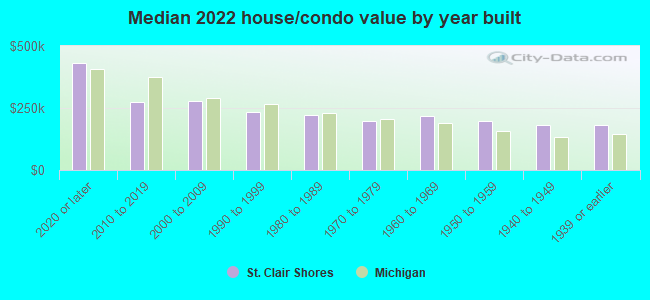
Median year house/condo built
Median year apartment built
Household type by relationship - Male householder living alone (%)
Household type by relationship - Male householder not living alone (%)
Household type by relationship - Female householder living alone (%)
Household type by relationship - Female householder not living alone (%)
Household type by relationship - Opposite-Sex spouse (%)
Household type by relationship - Same-Sex spouse (%)
Household type by relationship - Opposite-Sex unmarried partner (%)
Household type by relationship - Same-Sex unmarried partner (%)
Household type by relationship - In group quarters (%)
Size of family households - 2-person household (%)
Size of family households - 3-person household (%)
Size of family households - 4-person household (%)
Size of family households - 5-person household (%)
Size of family households - 6-person household (%)
Size of family households - 7-or-more-person household (%)
Size of nonfamily households - 1-person household (%)
Size of nonfamily households - 2-person household (%)
Size of nonfamily households - 3-person household (%)
Size of nonfamily households - 4-person household (%)
Size of nonfamily households - 5-person household (%)
Size of nonfamily households - 6-person household (%)
Size of nonfamily households - 7-or-moreperson household (%)
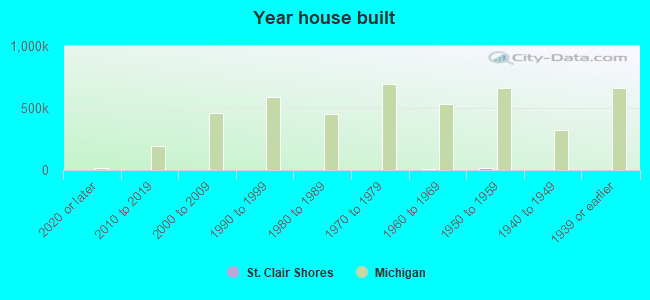
Year house built - Built 2010 or later (%)
Year house built - Built 2000 to 2009 (%)
Year house built - Built 1990 to 1999 (%)
Year house built - Built 1980 to 1989 (%)
Year house built - Built 1970 to 1979 (%)
Year house built - Built 1960 to 1969 (%)
Year house built - Built 1950 to 1959 (%)
Year house built - Built 1940 to 1949 (%)
Year house built - Built 1939 or earlier (%)
Median number of rooms in houses and condos
Median number of rooms in apartments
Median number of bedrooms in owner occupied houses
Mean number of bedrooms in owner occupied houses
Median number of bedrooms in renter occupied houses
Mean number of bedrooms in renter occupied houses
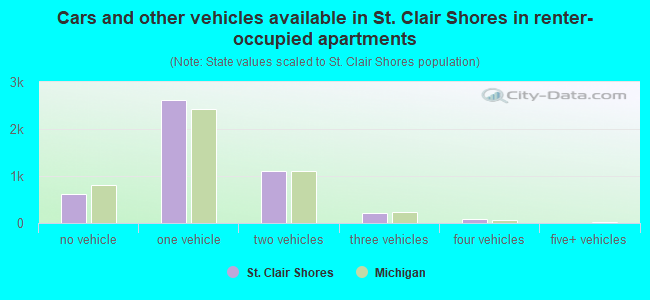
Median number of vehichles in owner occupied houses
Mean number of vehichles in owner occupied houses
Median number of vehichles in renter occupied houses
Mean number of vehichles in renter occupied houses
Rooms in owner-occupied houses - 1 room (%)
Rooms in owner-occupied houses - 2 rooms (%)
Rooms in owner-occupied houses - 3 rooms (%)
Rooms in owner-occupied houses - 4 rooms (%)
Rooms in owner-occupied houses - 5 rooms (%)
Rooms in owner-occupied houses - 6 rooms (%)
Rooms in owner-occupied houses - 7 rooms (%)
Rooms in owner-occupied houses - 8 rooms (%)
Rooms in owner-occupied houses - 9+ rooms (%)
Rooms in renter-occupied houses - 1 room (%)
Rooms in renter-occupied houses - 2 rooms (%)
Rooms in renter-occupied houses - 3 rooms (%)
Rooms in renter-occupied houses - 4 rooms (%)
Rooms in renter-occupied houses - 5 rooms (%)
Rooms in renter-occupied houses - 6 rooms (%)
Rooms in renter-occupied houses - 7 rooms (%)
Rooms in renter-occupied houses - 8 rooms (%)
Rooms in renter-occupied houses - 9+ rooms (%)
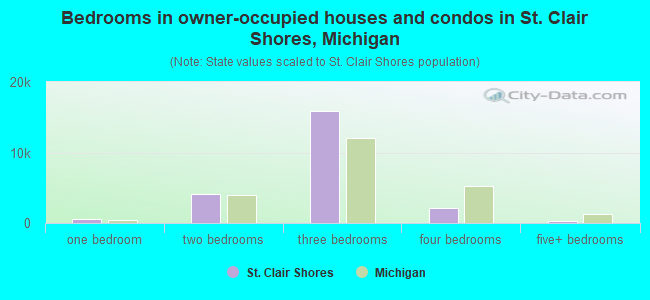
Bedrooms in owner-occupied houses - no bedrooms (%)
Bedrooms in owner-occupied houses - 1 bedroom (%)
Bedrooms in owner-occupied houses - 2 bedrooms (%)
Bedrooms in owner-occupied houses - 3 bedrooms (%)
Bedrooms in owner-occupied houses - 4 bedrooms (%)
Bedrooms in owner-occupied houses - 5+ bedrooms (%)
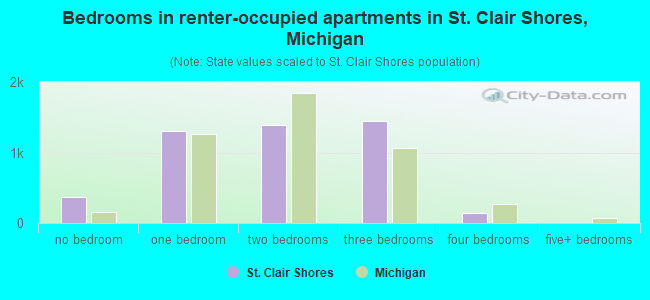
Bedrooms in renter-occupied houses - no bedrooms (%)
Bedrooms in renter-occupied houses - 1 bedroom (%)
Bedrooms in renter-occupied houses - 2 bedrooms (%)
Bedrooms in renter-occupied houses - 3 bedrooms (%)
Bedrooms in renter-occupied houses - 4 bedrooms (%)
Bedrooms in renter-occupied houses - 5+ bedrooms (%)
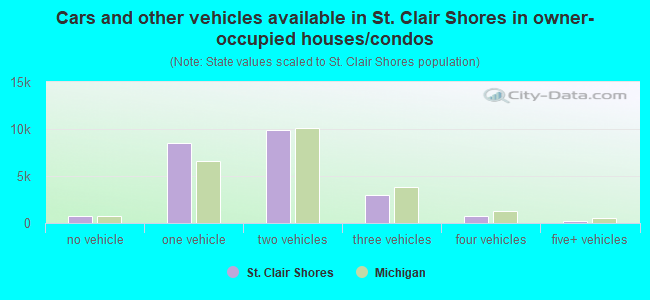
Vehicles available in owner-occupied houses - no vehicle available (%)
Vehicles available in owner-occupied houses - 1 vehicle available(%)
Vehicles available in owner-occupied houses - 2 Vehicles available (%)
Vehicles available in owner-occupied houses - 3 Vehicles available (%)
Vehicles available in owner-occupied houses - 4 Vehicles available (%)
Vehicles available in owner-occupied houses - 5+ Vehicles available (%)
Vehicles available in renter-occupied houses - no vehicle available (%)
Vehicles available in renter-occupied houses - 1 vehicle available (%)
Vehicles available in renter-occupied houses - 2 Vehicles available (%)
Vehicles available in renter-occupied houses - 3 Vehicles available (%)
Vehicles available in renter-occupied houses - 4 Vehicles available (%)
Vehicles available in renter-occupied houses - 5+ Vehicles available (%)
Housing units in structures - 1, detached (%)
Housing units in structures - 1, attached (%)
Housing units in structures - 2 (%)
Housing units in structures - 3 or 4 (%)
Housing units in structures - 5 to 9 (%)
Housing units in structures - 10 to 19 (%)
Housing units in structures - 20 to 49 (%)
Housing units in structures - 50 or more (%)
Housing units in structures - Mobile home (%)
Housing units in structures - Boat, RV, van, etc. (%)
Housing units in structures - Owners - 1, detached (%)
Housing units in structures - Owners - 1, attached (%)
Housing units in structures - Owners - 2 (%)
Housing units in structures - Owners - 3 or 4 (%)
Housing units in structures - Owners - 5 to 9 (%)
Housing units in structures - Owners - 10 to 19 (%)
Housing units in structures - Owners - 20 to 49 (%)
Housing units in structures - Owners - 50 or more (%)
Housing units in structures - Owners - Mobile home (%)
Housing units in structures - Owners - Boat, RV, van, etc. (%)
Housing units in structures - Renters - 1, detached (%)
Housing units in structures - Renters - 1, attached (%)
Housing units in structures - Renters - 2 (%)
Housing units in structures - Renters - 3 or 4 (%)
Housing units in structures - Renters - 5 to 9 (%)
Housing units in structures - Renters - 10 to 19 (%)
Housing units in structures - Renters - 20 to 49 (%)
Housing units in structures - Renters - 50 or more (%)
Housing units in structures - Renters - Mobile home (%)
Housing units in structures - Renters - Boat, RV, van, etc. (%)
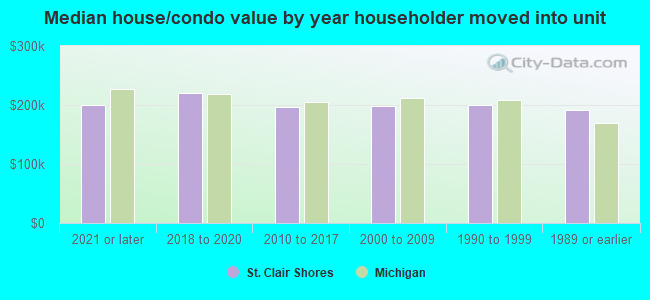
House/condo owner moved in on average (years ago)
Renter moved in on average (years ago)
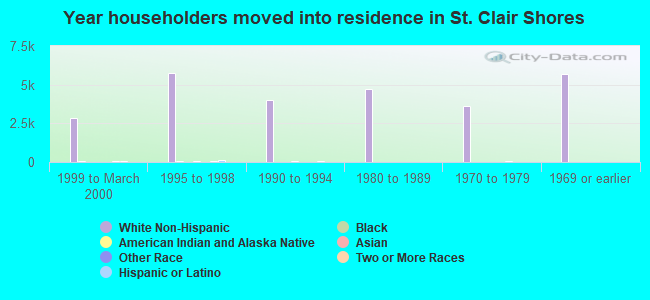
Year householder moved into unit - Moved in 1999 to March 2000 (%)
Year householder moved into unit - Moved in 1999 to March 2000 (%) - White
Year householder moved into unit - Moved in 1999 to March 2000 (%) - Black or African American
Year householder moved into unit - Moved in 1999 to March 2000 (%) - Asian
Year householder moved into unit - Moved in 1999 to March 2000 (%) - Hispanic or Latino
Year householder moved into unit - Moved in 1999 to March 2000 (%) - American Indian and Alaska Native
Year householder moved into unit - Moved in 1999 to March 2000 (%) - Multirace
Year householder moved into unit - Moved in 1999 to March 2000 (%) - Other Race
Year householder moved into unit - Moved in 1995 to 1998 (%)
Year householder moved into unit - Moved in 1995 to 1998 (%) - White
Year householder moved into unit - Moved in 1995 to 1998 (%) - Black or African American
Year householder moved into unit - Moved in 1995 to 1998 (%) - Asian
Year householder moved into unit - Moved in 1995 to 1998 (%) - Hispanic or Latino
Year householder moved into unit - Moved in 1995 to 1998 (%) - American Indian and Alaska Native
Year householder moved into unit - Moved in 1995 to 1998 (%) - Multirace
Year householder moved into unit - Moved in 1995 to 1998 (%) - Other Race
Year householder moved into unit - Moved in 1990 to 1994 (%)
Year householder moved into unit - Moved in 1990 to 1994 (%) - White
Year householder moved into unit - Moved in 1990 to 1994 (%) - Black or African American
Year householder moved into unit - Moved in 1990 to 1994 (%) - Asian
Year householder moved into unit - Moved in 1990 to 1994 (%) - Hispanic or Latino
Year householder moved into unit - Moved in 1990 to 1994 (%) - American Indian and Alaska Native
Year householder moved into unit - Moved in 1990 to 1994 (%) - Multirace
Year householder moved into unit - Moved in 1990 to 1994 (%) - Other Race
Year householder moved into unit - Moved in 1980 to 1989 (%)
Year householder moved into unit - Moved in 1980 to 1989 (%) - White
Year householder moved into unit - Moved in 1980 to 1989 (%) - Black or African American
Year householder moved into unit - Moved in 1980 to 1989 (%) - Asian
Year householder moved into unit - Moved in 1980 to 1989 (%) - Hispanic or Latino
Year householder moved into unit - Moved in 1980 to 1989 (%) - American Indian and Alaska Native
Year householder moved into unit - Moved in 1980 to 1989 (%) - Multirace
Year householder moved into unit - Moved in 1980 to 1989 (%) - Other Race
Year householder moved into unit - Moved in 1970 to 1979 (%)
Year householder moved into unit - Moved in 1970 to 1979 (%) - White
Year householder moved into unit - Moved in 1970 to 1979 (%) - Black or African American
Year householder moved into unit - Moved in 1970 to 1979 (%) - Asian
Year householder moved into unit - Moved in 1970 to 1979 (%) - Hispanic or Latino
Year householder moved into unit - Moved in 1970 to 1979 (%) - American Indian and Alaska Native
Year householder moved into unit - Moved in 1970 to 1979 (%) - Multirace
Year householder moved into unit - Moved in 1970 to 1979 (%) - Other Race
Year householder moved into unit - Moved in 1969 or earlier (%)
Year householder moved into unit - Moved in 1969 or earlier (%) - White
Year householder moved into unit - Moved in 1969 or earlier (%) - Black or African American
Year householder moved into unit - Moved in 1969 or earlier (%) - Asian
Year householder moved into unit - Moved in 1969 or earlier (%) - Hispanic or Latino
Year householder moved into unit - Moved in 1969 or earlier (%) - American Indian and Alaska Native
Year householder moved into unit - Moved in 1969 or earlier (%) - Multirace
Year householder moved into unit - Moved in 1969 or earlier (%) - Other Race
Housing units lacking complete plumbing facilities (%)
Housing units lacking complete kitchen facilities (%)
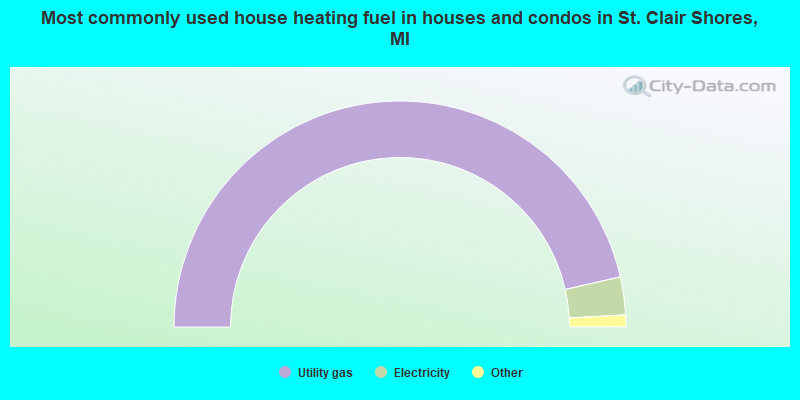
House heating fuel used in houses and condos - Utility gas (%)
House heating fuel used in houses and condos - Bottled, tank, or LP gas (%)
House heating fuel used in houses and condos - Electricity (%)
House heating fuel used in houses and condos - Fuel oil, kerosene, etc. (%)
House heating fuel used in houses and condos - Coal or coke (%)
House heating fuel used in houses and condos - Wood (%)
House heating fuel used in houses and condos - Solar energy (%)
House heating fuel used in houses and condos - Other fuel (%)
House heating fuel used in houses and condos - No fuel used (%)
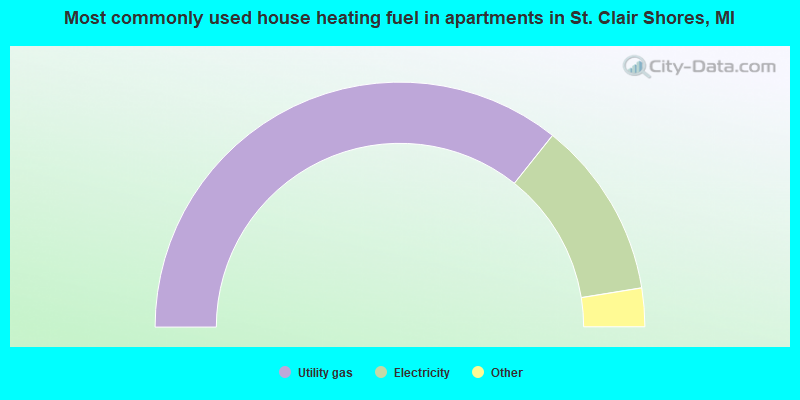
House heating fuel used in apartments - Utility gas (%)
House heating fuel used in apartments - Bottled, tank, or LP gas (%)
House heating fuel used in apartments - Electricity (%)
House heating fuel used in apartments - Fuel oil, kerosene, etc. (%)
House heating fuel used in apartments - Coal or coke (%)
House heating fuel used in apartments - Wood (%)
House heating fuel used in apartments - Solar energy (%)
House heating fuel used in apartments - Other fuel (%)
House heating fuel used in apartments - No fuel used (%)
Median year house/condo built: 1957Median year apartment built: 1966Household type by relationship:
Households: 58,371
Male householders: 13,245 (4,644 living alone ), Female householders: 13,917 (5,674 living alone )11,361 spouses (11,212 opposite-sex spouses ), 1,884 unmarried partners , (1,862 opposite-sex unmarried partners ), 14,016 children (13,244 natural , 283 adopted , 488 stepchildren ), 1,350 grandchildren , 445 brothers or sisters , 465 parents , 4 foster children , 388 other relatives , 918 non-relatives In group quarters: 372
Size of family households: 8,173 2-persons , 3,914 3-persons , 2,510 4-persons , 639 5-persons , 379 6-persons , 96 7-or-more-persons .
Size of nonfamily households: 10,132 1-person , 1,675 2-persons , 66 3-persons , 72 4-persons .
6,077 married couples with children. single-parent households (804 men , 1,613 women ).
95.2% of residents of St. Clair Shores speak English at home. of residents speak Spanish at home (70% speak English very well , 28% speak English well , 2% speak English not well ).of residents speak other Indo-European language at home (70% speak English very well , 16% speak English well , 13% speak English not well , 1% don't speak English at all ).of residents speak Asian or Pacific Island language at home (85% speak English very well , 3% speak English well , 11% speak English not well ).of residents speak other language at home (75% speak English very well , 19% speak English well , 7% speak English not well ).
Foreign born population: 2,443 (4.2%)of them are naturalized citizens )
Median number of rooms in houses and condos:
Median number of rooms in apartments
Owner-occupied Renter-occupied
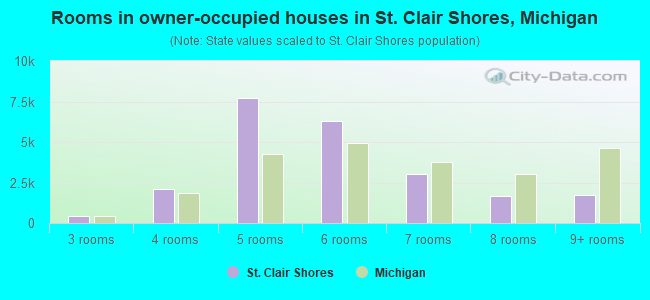
Rooms in owner-occupied houses in St. Clair Shores, Michigan
19 1 room 18 2 rooms 453 3 rooms 2,073 4 rooms 7,733 5 rooms 6,296 6 rooms 3,039 7 rooms 1,650 8 rooms 1,736 9+ rooms
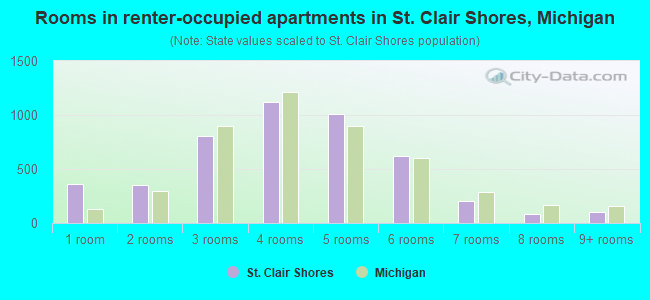
Rooms in renter-occupied apartments in St. Clair Shores, Michigan
358 1 room 350 2 rooms 810 3 rooms 1,116 4 rooms 1,012 5 rooms 616 6 rooms 200 7 rooms 83 8 rooms 105 9+ rooms
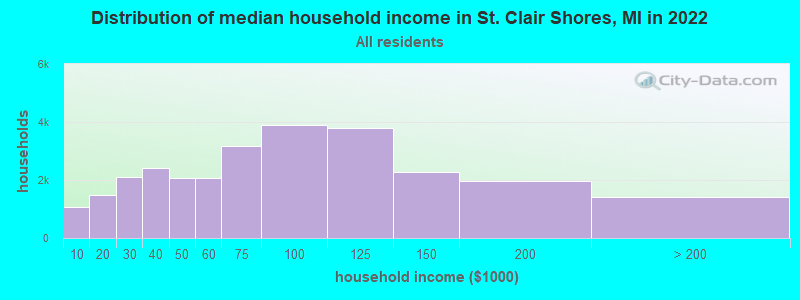
St. Clair Shores, MI household income distribution 1,072 Less than $10,0001,491 $10,000 to $19,9992,099 $20,000 to $29,9992,414 $30,000 to $39,9992,081 $40,000 to $49,9992,085 $50,000 to $59,9993,161 $60,000 to $74,9993,894 $75,000 to $99,9993,780 $100,000 to $124,9992,268 $125,000 to $149,9991,953 $150,000 to $199,9991,402 $200,000 or more
Home value of owner - occupied houses in 2022 in St. Clair Shores, MI 100 Less than $10,00072 $10,000 to $14,999140 $15,000 to $19,99974 $20,000 to $24,99939 $25,000 to $29,99914 $30,000 to $34,99936 $35,000 to $39,999165 $40,000 to $49,999257 $50,000 to $59,999206 $60,000 to $69,999257 $70,000 to $79,999217 $80,000 to $89,999186 $90,000 to $99,9991,341 $100,000 to $124,9991,492 $125,000 to $149,9993,961 $150,000 to $174,9993,333 $175,000 to $199,9994,839 $200,000 to $249,9991,904 $250,000 to $299,9991,108 $300,000 to $399,999572 $400,000 to $499,999562 $500,000 to $749,99981 $750,000 to $999,99916 $1,000,000 to $1,499,99910 $1,500,000 to $1,999,99939 $2,000,000 or moreRent paid by renters in 2022 in St. Clair Shores, MI 2 $100 to $14939 $150 to $19937 $200 to $24939 $250 to $29918 $300 to $34923 $350 to $39910 $400 to $44958 $450 to $49935 $500 to $54983 $550 to $599132 $600 to $649312 $650 to $699221 $700 to $749193 $750 to $799690 $800 to $899487 $900 to $999876 $1,000 to $1,249551 $1,250 to $1,499389 $1,500 to $1,99910 $2,000 to $2,49923 $2,500 to $2,99967 $3,000 to $3,49916 $3,500 or more262 No cash rent
Percentage of workers working in this county: 59.1%Number of people working at home: 4,973 (16.3% of all workers )
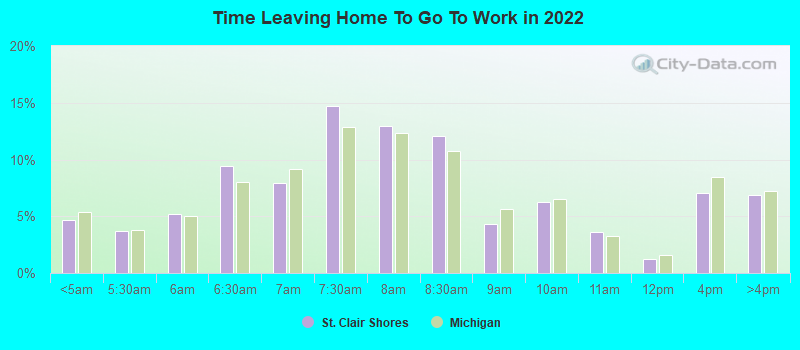
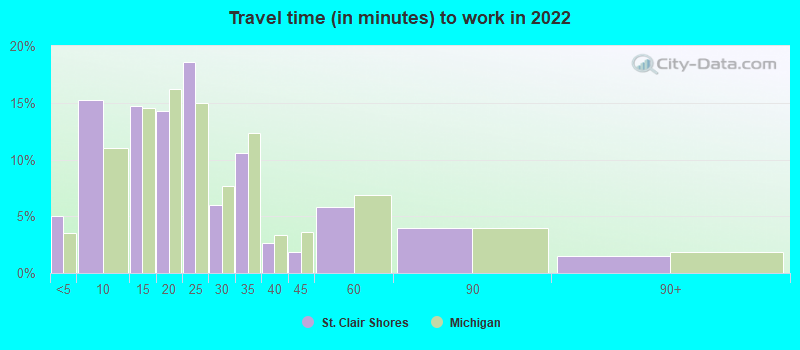
Travel time to work (commute)
Less than 5 minutes: 7195 to 9 minutes: 2,22610 to 14 minutes: 2,27015 to 19 minutes: 4,16220 to 24 minutes: 4,08725 to 29 minutes: 2,39330 to 34 minutes: 3,84335 to 39 minutes: 1,17140 to 44 minutes: 1,48845 to 59 minutes: 2,27360 to 89 minutes: 69390 or more minutes: 573
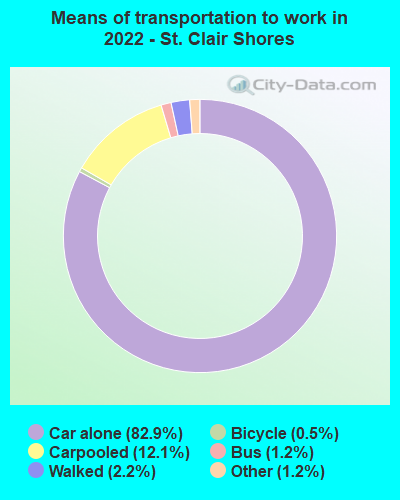
Means of transportation to work:
Drove a car alone: 11,678 (63.4%)Carpooled: 1,798 (9.8%)Bus : 132 (0.7%)Taxi: 189 (1.0%)Bicycle: 118 (0.6%)Walked: 330 (1.8%)Worked at home: 4,973 (27.0%)
Unemployment by race in 2022
Unemployment rate for White non-Hispanic residents 2.8% Males3.7% FemalesUnemployment rate for Black residents 9.9% Males5.3% FemalesUnemployment rate for two or more race residents 5.3% Males0.9% FemalesUnemployment rate for Hispanic or Latino residents 3.7% Males1.4% Females
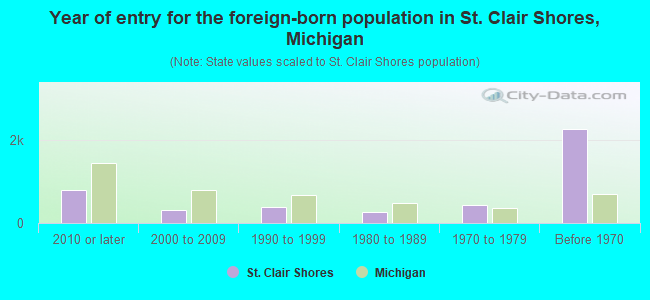
Year of entry for the foreign-born population in St. Clair Shores, Michigan
803 2010 or later 313 2000 to 2009 392 1990 to 1999 254 1980 to 1989 422 1970 to 1979 2,259 Before 1970
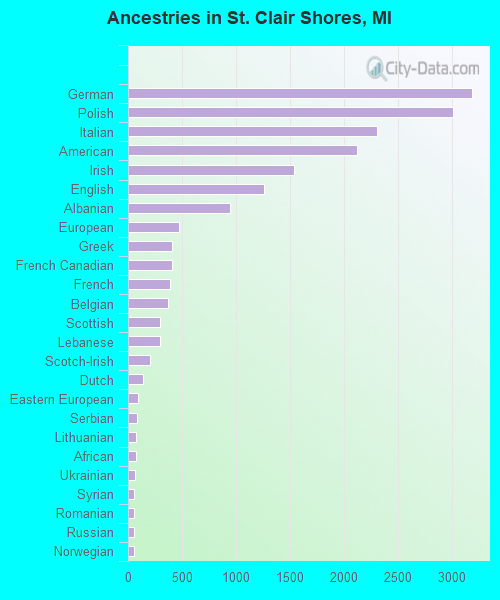
First ancestries reported:
German: 3,185 (13.8%)
Polish: 3,008 (13.1%)
Italian: 2,311 (10.0%)
American: 2,126 (9.2%)
Irish: 1,542 (6.7%)
English: 1,258 (5.5%)
Albanian: 948 (4.1%)
European: 468 (2.0%)
Greek: 410 (1.8%)
French Canadian: 404 (1.8%)
French: 385 (1.7%)
Belgian: 367 (1.6%)
Scottish: 299 (1.3%)
Lebanese: 294 (1.3%)
Scotch-Irish: 206 (0.9%)
Dutch: 139 (0.6%)
Eastern European: 97 (0.4%)
Serbian: 83 (0.4%)
Lithuanian: 73 (0.3%)
African: 72 (0.3%)
Ukrainian: 68 (0.3%)
Syrian: 60 (0.3%)
Romanian: 56 (0.2%)
Russian: 53 (0.2%)
Norwegian: 52 (0.2%)
Scandinavian: 44 (0.2%)
Canadian: 43 (0.2%)
Hungarian: 37 (0.2%)
British: 34 (0.1%)
Macedonian: 29 (0.1%)
Haitian: 28 (0.1%)
Maltese: 26 (0.1%)
Kenyan: 26 (0.1%)
Slovak: 23 (0.10%)
Austrian: 20 (0.09%)
Finnish: 19 (0.08%)
Czech: 18 (0.08%)
Portuguese: 17 (0.07%)
Arab: 17 (0.07%)
Egyptian: 16 (0.07%)
Swedish: 16 (0.07%)
Croatian: 15 (0.07%)
Armenian: 13 (0.06%)
Welsh: 13 (0.06%)
Slovene: 12 (0.05%)
Yugoslavian: 12 (0.05%)
Swiss: 9 (0.04%)
Jordanian: 9 (0.04%)
Danish: 8 (0.03%)
Jamaican: 8 (0.03%)
Assyrian: 7 (0.03%)
Northern European: 6 (0.03%)
Pennsylvania German: 6 (0.03%)
Celtic: 5 (0.02%)
Ethiopian: 5 (0.02%)
Most common places of birth for foreign-born residents (%): Albania St. Clair Shores:
22.3% (554)Michigan:
1.9% (12,910)
Canada St. Clair Shores:
12.5% (311)Michigan:
5.0% (35,052)
Greece St. Clair Shores:
6.9% (172)Michigan:
0.4% (2,721)
Colombia St. Clair Shores:
6.2% (155)Michigan:
0.6% (3,969)
Philippines St. Clair Shores:
5.5% (138)Michigan:
2.8% (19,112)
Poland St. Clair Shores:
5.2% (129)Michigan:
1.6% (10,857)
Germany St. Clair Shores:
3.9% (96)Michigan:
2.3% (16,126)
Mexico St. Clair Shores:
3.7% (92)Michigan:
10.9% (75,965)
Italy St. Clair Shores:
3.3% (82)Michigan:
1.1% (7,792)
Lebanon St. Clair Shores:
2.9% (71)Michigan:
3.7% (25,634)
United Kingdom, excluding England and Scotland St. Clair Shores:
1.9% (48)Michigan:
0.8% (5,492)
Romania St. Clair Shores:
1.9% (47)Michigan:
1.2% (8,563)
China, excluding Hong Kong and Taiwan St. Clair Shores:
1.8% (46)Michigan:
4.9% (34,295)
Place of birth for U.S.-born residents:
This state: 49,100Other state: 6,391Northeast: 1,278Midwest: 2,169South: 1,670West: 1,290 91.9% of St. Clair Shores residents lived in the same house 1 years ago.
Out of people who lived in different houses, 31.0% lived in this county.
Out of people who lived in different counties, 67.8% lived in Michigan.
St. Clair Shores:
91.9%State average:
88.4%
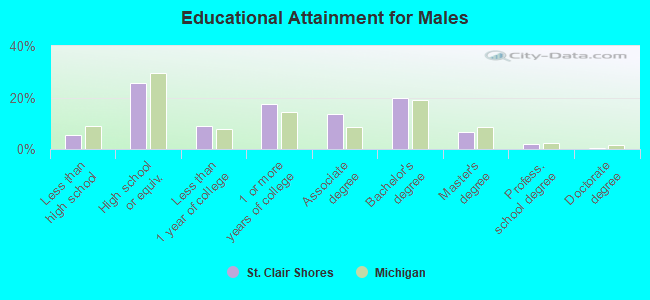
Education attainment for males 25 years and older:
No schooling: 193Nursery to 4th grade: 95th and 6th grade: 177th and 8th grade: 1049th grade: 10110th grade: 24211th grade: 23412th grade, no diploma: 294High school graduate (or equivalency): 5,591Less than 1 year of college: 1,983Some college more than 1 year, no degree: 3,798Associate degree: 3,003Bachelor's degree: 4,297Master's degree: 1,424Professional school degree: 462Doctorate degree: 87
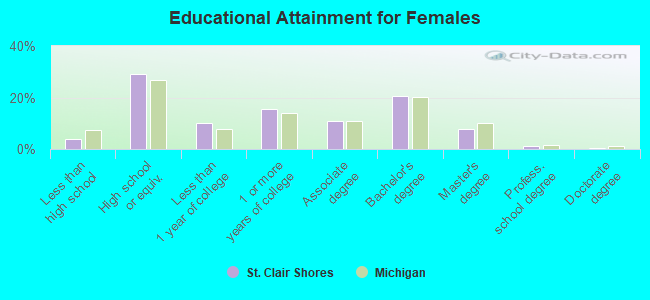
Education attainment for females 25 years and older:
No schooling: 154Nursery to 4th grade: 355th and 6th grade: 197th and 8th grade: 479th grade: 5610th grade: 9311th grade: 27012th grade, no diploma: 249High school graduate (or equivalency): 6,829Less than 1 year of college: 2,366Some college more than 1 year, no degree: 3,639Associate degree: 2,563Bachelor's degree: 4,799Master's degree: 1,856Professional school degree: 311Doctorate degree: 107
Housing units in structures:
One, detached: 23,229One, attached: 1,531Two: 1803 or 4: 7265 to 9: 1,44310 to 19: 51320 to 49: 38750 or more: 525Mobile homes: 98Median worth of mobile homes: $21,042
Housing units lacking complete plumbing facilities in 2022: 0.5%Housing units lacking complete kitchen facilities in 2022: 1.2%House/condo owner moved in on average 12 years ago
Renter moved in on average 5 years ago
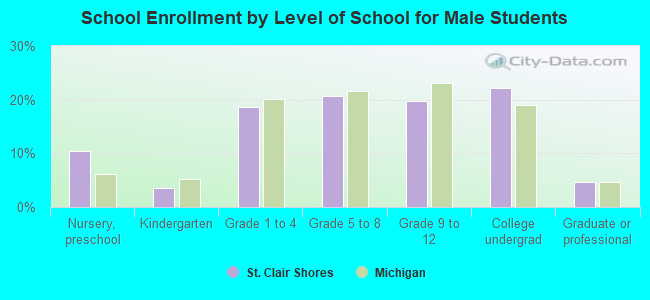
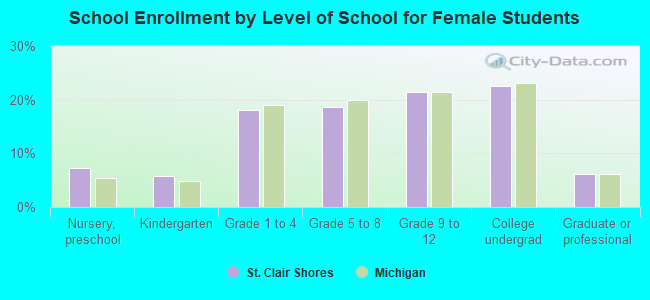
Private vs. public school enrollment:
Students in private schools in grades 1 to 8 (elementary and middle school): 328 Students in private schools in grades 9 to 12 (high school): 111 Students in private undergraduate colleges: 289