St. Joseph, MI (Michigan) Houses and Residents
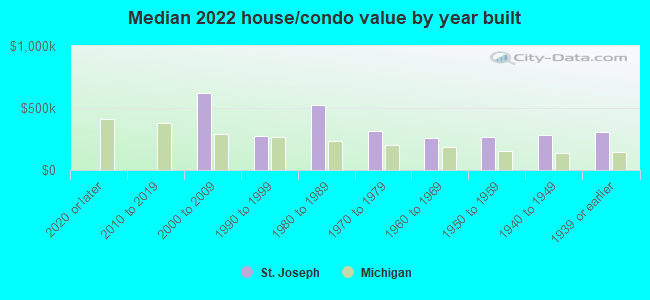
| St. Joseph: | $287,317 |
| Michigan: | $224,400 |
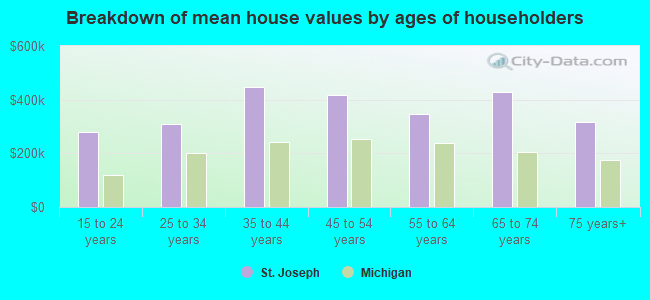
Mean price in 2022:
Detached houses: $334,446
Here: $334,446 State: $280,038 Townhouses or other attached units: $222,385
Here: $222,385 State: $239,520 In 2-unit structures: $190,794
Here: $190,794 State: $219,481 In 3-to-4-unit structures: $700,463
Here: $700,463 State: $207,067 In 5-or-more-unit structures: $359,571
Here: $359,571 State: $192,733
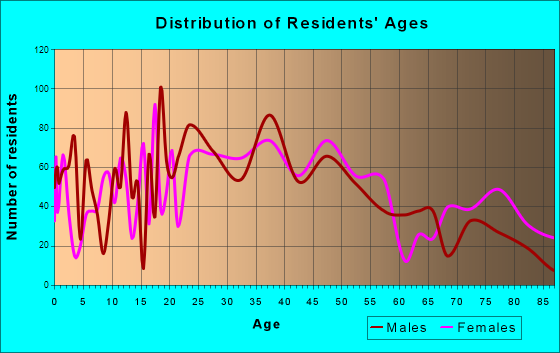
Total population: 8,325 (All urban)
Houses: 4,851 (4,013 occupied: 2,477 owner occupied, 1,504 renter occupied)
| % of renters here: | 38% |
| State: | 27% |
Housing density: 1,414 houses/condos per square mile
Median price asked for vacant for-sale houses and condos in 2022: $380,196.
Median contract rent in 2022: $885 (lower quartile is $691, upper quartile is $1,121)
Median rent asked for vacant for-rent units in 2022: $3,860
Median gross rent in St. Joseph, MI in 2022: $948
Housing units in St. Joseph with a mortgage: 1,661 (236 second mortgage, 0 home equity loan, 238 both second mortgage and home equity loan)
Houses without a mortgage: 72
Median household income for houses/condos with a mortgage: $114,831
Median household income for apartments without a mortgage: $82,015
Median monthly housing costs: $1,103
Compare current foreclosures near St. Joseph, MI:
| Photo | Address | Area | Beds / Baths | Price | Details |
|---|---|---|---|---|---|

|
#1
67 1/2 St
Hartford, MI 49057
|
1,100 sq. feet
|
2 baths 3 beds |
show details | |

|
#2
Kingsley Ave
Saint Joseph, MI 49085
|
1,170 sq. feet
|
1 baths 2 beds |
show details | |

|
#3
Lake Rd
Coloma, MI 49038
|
- sq. feet
|
1 baths 4 beds |
show details | |

|
#4
Bishop Ave
Benton Harbor, MI 49022
|
1,040 sq. feet
|
1 baths 4 beds |
show details | |

|
#5
Monroe St
Benton Harbor, MI 49022
|
- sq. feet
|
2 baths 3 beds |
show details | |

|
#6
Hurd Ave
Benton Harbor, MI 49022
|
- sq. feet
|
1 baths 2 beds |
show details | |

|
#7
Garr Rd
Buchanan, MI 49107
|
- sq. feet
|
1 baths 3 beds |
show details | |

|
#8
N Prospect Ct
Watervliet, MI 49098
|
- sq. feet
|
2 baths 3 beds |
show details | |

|
#9
Defield Rd
Coloma, MI 49038
|
- sq. feet
|
1 baths 2 beds |
show details | |

|
#10
S Euclid Ave
Benton Harbor, MI 49022
|
1,889 sq. feet
|
1 baths - beds |
show details |
| Photo | Address | Area | Beds / Baths | Price | Details |
|---|---|---|---|---|---|

|
#11
Edgecumbe Ave
Benton Harbor, MI 49022
|
- sq. feet
|
- baths - beds |
show details | |

|
#12
Paw Paw Ave
Benton Harbor, MI 49022
|
- sq. feet
|
- baths - beds |
show details | |

|
#13
Plaza Dr Apt 319
Benton Harbor, MI 49022
|
- sq. feet
|
- baths - beds |
show details | |

|
#14
Lake Pine Dr
Saint Joseph, MI 49085
|
- sq. feet
|
- baths - beds |
show details | |

|
#15
Church St # 1
Saint Joseph, MI 49085
|
- sq. feet
|
- baths - beds |
show details | |

|
#16
S Pipestone Rd
Sodus, MI 49126
|
- sq. feet
|
- baths - beds |
show details | |

|
#17
Little Paw Paw Lake Rd Lot 146
Coloma, MI 49038
|
- sq. feet
|
- baths - beds |
show details | |

|
#18
Chabot Rd
Benton Harbor, MI 49022
|
- sq. feet
|
- baths - beds |
show details | |

|
#19
Pheasant Run
Baroda, MI 49101
|
- sq. feet
|
- baths - beds |
show details | |

|
#20
Thresher Ave
Benton Harbor, MI 49022
|
- sq. feet
|
- baths - beds |
show details |
| Photo | Address | Area | Beds / Baths | Price | Details |
|---|---|---|---|---|---|

|
#21
Red Arrow, Lot 121
Bridgman, MI 49106
|
- sq. feet
|
- baths - beds |
show details | |

|
#22
Elm
Watervliet, MI 49098
|
- sq. feet
|
- baths - beds |
show details | |

|
#23
Red Arrow Hwy Lot 84
Bridgman, MI 49106
|
- sq. feet
|
- baths - beds |
show details | |

|
#24
County Road 376
Coloma, MI 49038
|
- sq. feet
|
- baths - beds |
show details | |

|
#25
Red Arrow Hwy
Hartford, MI 49057
|
- sq. feet
|
- baths - beds |
show details | |

|
#26
Us Highway 31, Apt 2
Berrien Springs, MI 49103
|
- sq. feet
|
- baths - beds |
show details | |

|
#27
Hills Haven Rd Lot 50
Buchanan, MI 49107
|
- sq. feet
|
- baths - beds |
show details | |

|
#28
N Shore Dr
Benton Harbor, MI 49022
|
- sq. feet
|
- baths - beds |
show details | |

|
#29
Sanctuary Dr
Stevensville, MI 49127
|
- sq. feet
|
- baths - beds |
show details | |

|
#30
Union Ave Apt 3a
Benton Harbor, MI 49022
|
- sq. feet
|
- baths - beds |
show details |
| Photo | Address | Area | Beds / Baths | Price | Details |
|---|---|---|---|---|---|

|
#31
Hastings Ave
Benton Harbor, MI 49022
|
- sq. feet
|
- baths - beds |
show details | |

|
#32
Ridgeway St
Saint Joseph, MI 49085
|
- sq. feet
|
- baths - beds |
show details | |

|
#33
Bishop Ave
Benton Harbor, MI 49022
|
- sq. feet
|
- baths - beds |
show details | |

|
#34
Vineyard Ave
Benton Harbor, MI 49022
|
- sq. feet
|
- baths - beds |
show details | |

|
#35
Monroe St
Benton Harbor, MI 49022
|
- sq. feet
|
- baths - beds |
show details | |

|
#36
Union Ave
Benton Harbor, MI 49022
|
- sq. feet
|
- baths - beds |
show details | |

|
#37
Eloise Dr
Benton Harbor, MI 49022
|
- sq. feet
|
- baths - beds |
show details | |

|
#38
Lakeshore Dr
Saint Joseph, MI 49085
|
- sq. feet
|
- baths - beds |
show details | |

|
#39
Truman Dr
Benton Harbor, MI 49022
|
- sq. feet
|
- baths - beds |
show details | |

|
#40
E Berrien St
Eau Claire, MI 49111
|
- sq. feet
|
- baths - beds |
show details |
| Photo | Address | Area | Beds / Baths | Price | Details |
|---|---|---|---|---|---|

|
#41
Pavone St
Benton Harbor, MI 49022
|
- sq. feet
|
- baths - beds |
show details | |

|
#42
S Maple St
Eau Claire, MI 49111
|
- sq. feet
|
- baths - beds |
show details | |

|
#43
Baldwin Rd
Bridgman, MI 49106
|
- sq. feet
|
- baths - beds |
show details | |

|
#44
Park St
Watervliet, MI 49098
|
- sq. feet
|
- baths - beds |
show details | |

|
#45
Downey Dr
Benton Harbor, MI 49022
|
- sq. feet
|
- baths - beds |
show details | |

|
#46
Us Highway 31
Berrien Springs, MI 49103
|
- sq. feet
|
- baths - beds |
show details | |

|
#47
Van Atter Ct
Watervliet, MI 49098
|
- sq. feet
|
- baths - beds |
show details | |

|
#48
Gast Rd
Bridgman, MI 49106
|
- sq. feet
|
- baths - beds |
show details | |

|
#49
Pavone St
Benton Harbor, MI 49022
|
- sq. feet
|
- baths - beds |
show details | |

|
Check over 1 million property listings on Foreclosure.com!
|
browse all offers | |||


 | Moving to southwest Michigan, near Buchanan NEED recommendations (6 replies) |
| Moving to Michigan (14 replies) |
| Grand Rapids: bad areas? (122 replies) |
| Possible move to MI from CA (11 replies) |
| Commuting from South Bend to Benton Habor (6 replies) |
| Since everyone else is doing it . . . (51 replies) |
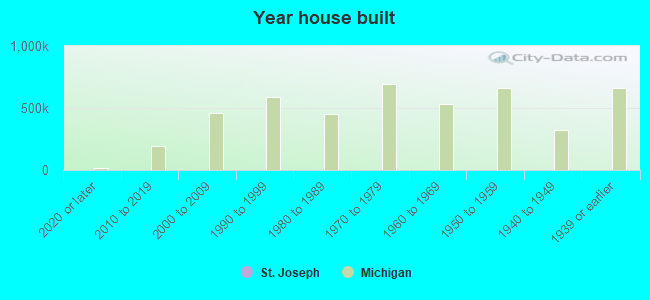
Median year apartment built: 1956
Household type by relationship:
Households: 7,799- Male householders: 2,144 (819 living alone), Female householders: 1,822 (1,005 living alone)
1,495 spouses (1,481 opposite-sex spouses), 265 unmarried partners, (259 opposite-sex unmarried partners), 1,395 children (1,295 natural, 18 adopted, 81 stepchildren), 50 grandchildren, 59 brothers or sisters, 104 parents, 0 foster children, 12 other relatives, 48 non-relatives
- In group quarters: 399
Size of family households: 968 2-persons, 391 3-persons, 296 4-persons, 42 5-persons, 47 6-persons, 34 7-or-more-persons.
Size of nonfamily households: 1,929 1-person, 289 2-persons, 5 3-persons.
1,009 married couples with children.
62 single-parent households (46 men, 16 women).
90.8% of residents of St. Joseph speak English at home.
1.7% of residents speak Spanish at home (96% speak English very well, 4% speak English well).
5.7% of residents speak other Indo-European language at home (91% speak English very well, 8% speak English well, 2% don't speak English at all).
2.1% of residents speak Asian or Pacific Island language at home (49% speak English very well, 50% speak English well, 1% speak English not well).
Foreign born population: 595 (7.6%)
(30.4% of them are naturalized citizens)
| Here: | 6.6 |
| State: | 6.5 |
| Here: | 3.3 |
| State: | 4.3 |
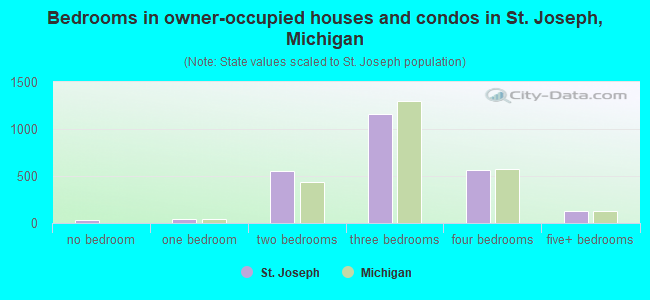
- Bedrooms in owner-occupied houses and condos in St. Joseph, Michigan
- 31no bedroom
- 391 bedroom
- 5522 bedrooms
- 1,1583 bedrooms
- 5684 bedrooms
- 1295+ bedrooms
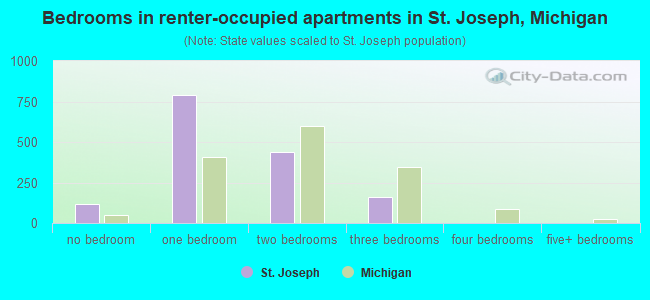
- Bedrooms in renter-occupied apartments in St. Joseph, Michigan
- 115no bedroom
- 7931 bedroom
- 4362 bedrooms
- 1603 bedrooms
- 04 bedrooms
- 05+ bedrooms
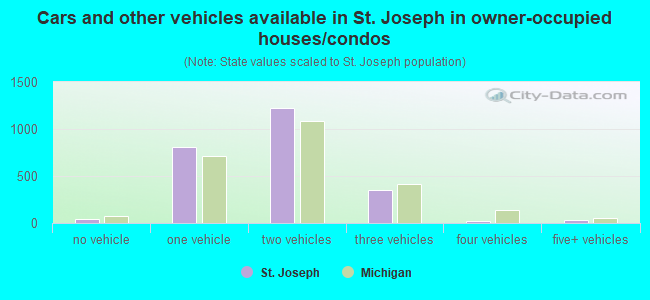
- Cars and other vehicles available in St. Joseph in owner-occupied houses/condos
- 38no vehicle
- 8121 vehicle
- 1,2222 vehicles
- 3503 vehicles
- 224 vehicles
- 335+ vehicles
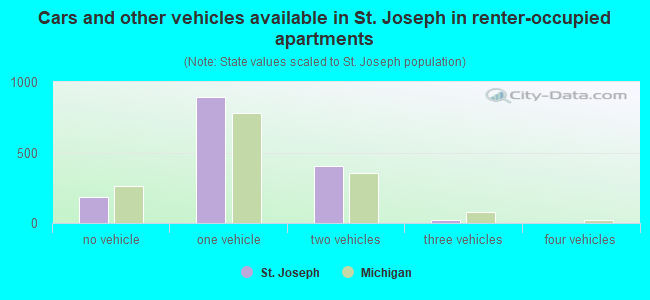
- Cars and other vehicles available in St. Joseph in renter-occupied apartments
- 184no vehicle
- 8971 vehicle
- 4052 vehicles
- 183 vehicles
- 04 vehicles
- 05+ vehicles
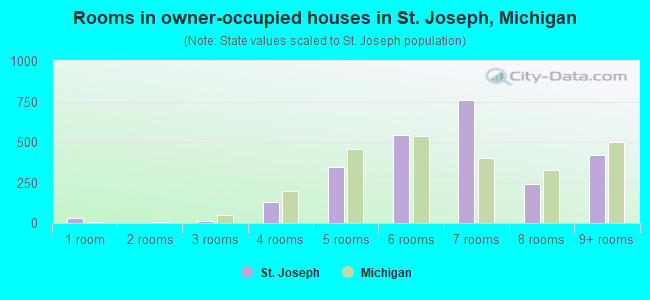
- Rooms in owner-occupied houses in St. Joseph, Michigan
- 311 room
- 02 rooms
- 113 rooms
- 1274 rooms
- 3485 rooms
- 5436 rooms
- 7587 rooms
- 2388 rooms
- 4229+ rooms
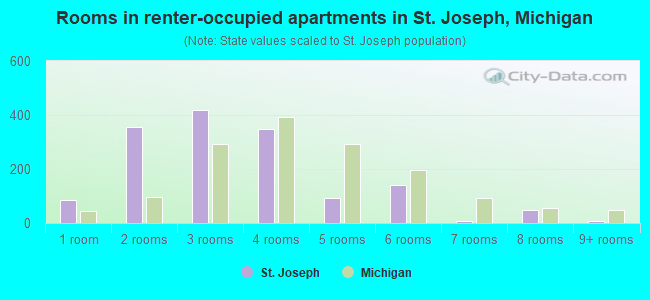
- Rooms in renter-occupied apartments in St. Joseph, Michigan
- 871 room
- 3572 rooms
- 4183 rooms
- 3474 rooms
- 945 rooms
- 1406 rooms
- 77 rooms
- 478 rooms
- 99+ rooms
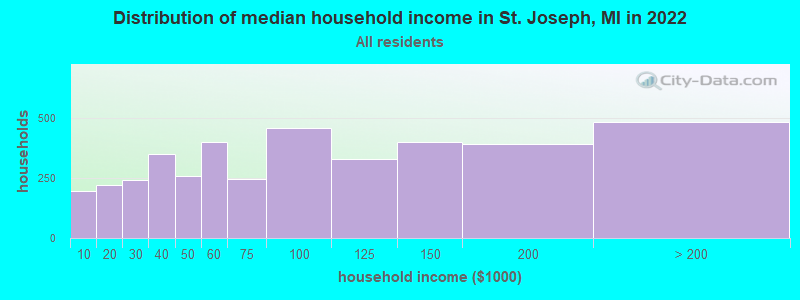
St. Joseph, MI household income distribution

- 197Less than $10,000
- 220$10,000 to $19,999
- 242$20,000 to $29,999
- 351$30,000 to $39,999
- 260$40,000 to $49,999
- 399$50,000 to $59,999
- 247$60,000 to $74,999
- 460$75,000 to $99,999
- 328$100,000 to $124,999
- 401$125,000 to $149,999
- 391$150,000 to $199,999
- 484$200,000 or more
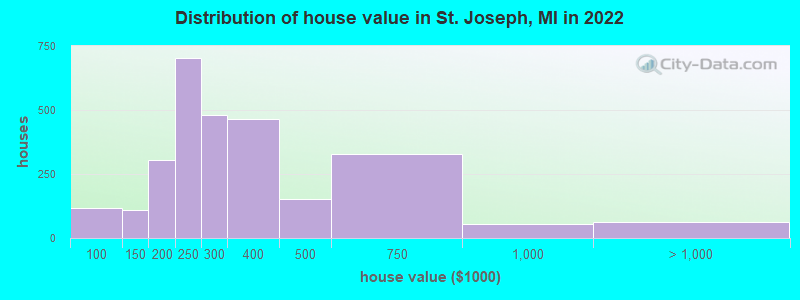
Home value of owner - occupied houses in 2022 in St. Joseph, MI
-
- 2$20,000 to $24,999
- 3$25,000 to $29,999
- 15$50,000 to $59,999
- 66$60,000 to $69,999
- 9$70,000 to $79,999
- 10$80,000 to $89,999
- 15$90,000 to $99,999
- 50$100,000 to $124,999
- 58$125,000 to $149,999
- 173$150,000 to $174,999
- 131$175,000 to $199,999
- 702$200,000 to $249,999
- 482$250,000 to $299,999
- 465$300,000 to $399,999
- 153$400,000 to $499,999
- 330$500,000 to $749,999
- 53$750,000 to $999,999
- 43$1,000,000 to $1,499,999
- 19$1,500,000 to $1,999,999
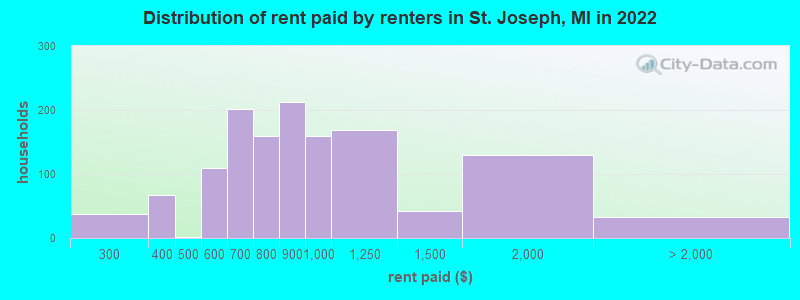
Rent paid by renters in 2022 in St. Joseph, MI
-
- 38$250 to $299
- 66$300 to $349
- 2$450 to $499
- 95$500 to $549
- 14$550 to $599
- 59$600 to $649
- 142$650 to $699
- 88$700 to $749
- 69$750 to $799
- 212$800 to $899
- 160$900 to $999
- 168$1,000 to $1,249
- 42$1,250 to $1,499
- 129$1,500 to $1,999
- 25$2,000 to $2,499
- 7No cash rent
Percentage of workers working in this county: 90.1%
Number of people working at home: 519 (13.0% of all workers)
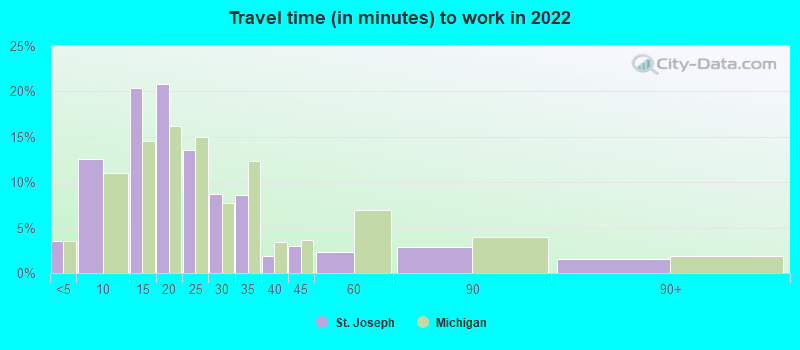
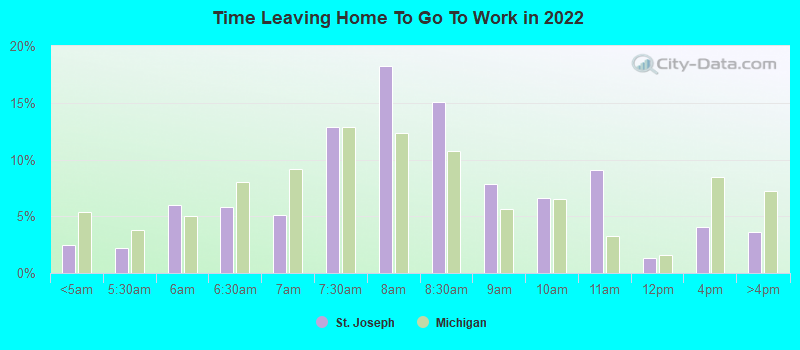
Travel time to work (commute)
- Less than 5 minutes: 267
- 5 to 9 minutes: 701
- 10 to 14 minutes: 799
- 15 to 19 minutes: 636
- 20 to 24 minutes: 280
- 25 to 29 minutes: 145
- 30 to 34 minutes: 210
- 35 to 39 minutes: 16
- 40 to 44 minutes: 60
- 45 to 59 minutes: 88
- 60 to 89 minutes: 110
- 90 or more minutes: 54
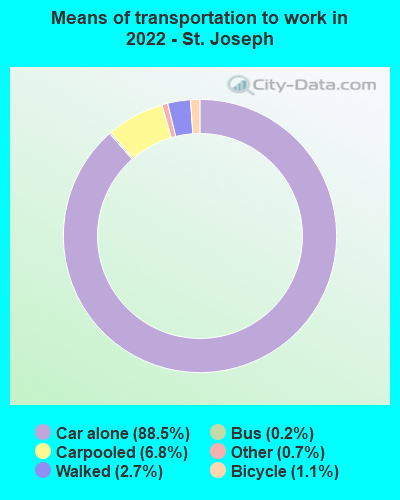
Means of transportation to work:
- Drove a car alone: 6,406 (78.9%)
- Carpooled: 672 (8.3%)
- Bus: 10 (0.1%)
- Taxi: 39 (0.5%)
- Bicycle: 119 (1.5%)
- Walked: 204 (2.5%)
- Worked at home: 519 (6.4%)
- Unemployment by race in 2022
- Unemployment rate for White non-Hispanic residents
- 1.3%Males
- 1.4%Females
- Unemployment rate for Black residents
- 5.1%Females
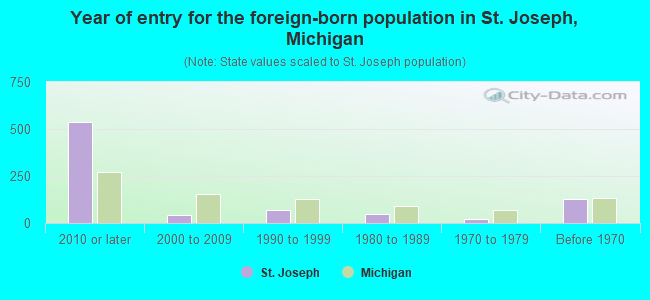
- Year of entry for the foreign-born population in St. Joseph, Michigan
- 5352010 or later
- 432000 to 2009
- 701990 to 1999
- 471980 to 1989
- 201970 to 1979
- 130Before 1970
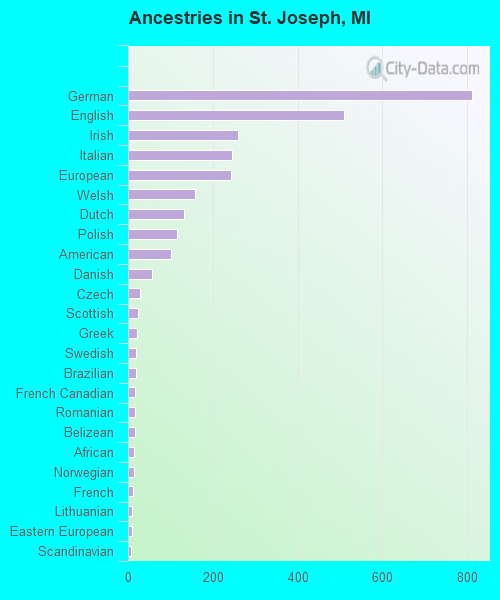
First ancestries reported:
- German: 811 (20.1%)
- English: 510 (12.6%)
- Irish: 260 (6.4%)
- Italian: 246 (6.1%)
- European: 242 (6.0%)
- Welsh: 159 (3.9%)
- Dutch: 133 (3.3%)
- Polish: 115 (2.9%)
- American: 102 (2.5%)
- Danish: 56 (1.4%)
- Czech: 29 (0.7%)
- Scottish: 24 (0.6%)
- Greek: 21 (0.5%)
- Swedish: 19 (0.5%)
- Brazilian: 18 (0.4%)
- French Canadian: 17 (0.4%)
- Romanian: 16 (0.4%)
- Belizean: 16 (0.4%)
- African: 15 (0.4%)
- Norwegian: 13 (0.3%)
- French: 11 (0.3%)
- Lithuanian: 10 (0.2%)
- Eastern European: 9 (0.2%)
- Scandinavian: 8 (0.2%)
- Serbian: 6 (0.1%)
- Russian: 4 (0.10%)
- Scotch-Irish: 3 (0.07%)
Most common places of birth for foreign-born residents (%):
| St. Joseph: | 69.2% (450) |
| Michigan: | 11.1% (77,240) |
| St. Joseph: | 7.8% (51) |
| Michigan: | 10.9% (75,965) |
| St. Joseph: | 4.5% (29) |
| Michigan: | 4.9% (34,295) |
| St. Joseph: | 2.9% (19) |
| Michigan: | 0.2% (1,062) |
| St. Joseph: | 2.8% (18) |
| Michigan: | 1.1% (7,485) |
| St. Joseph: | 2.6% (17) |
| Michigan: | 0.0% (225) |
| St. Joseph: | 2.3% (15) |
| Michigan: | 3.0% (20,884) |
| St. Joseph: | 2.0% (13) |
| Michigan: | 0.2% (1,298) |
| St. Joseph: | 1.5% (10) |
| Michigan: | 1.2% (8,563) |
Place of birth for U.S.-born residents:
- This state: 4,653
- Other state: 2,415
- Northeast: 238
- Midwest: 1,447
- South: 446
- West: 293
86.6% of St. Joseph residents lived in the same house 1 years ago.
Out of people who lived in different houses, 41.1% lived in this county.
Out of people who lived in different counties, 59.5% lived in Michigan.
| St. Joseph: | 86.6% |
| State average: | 88.4% |
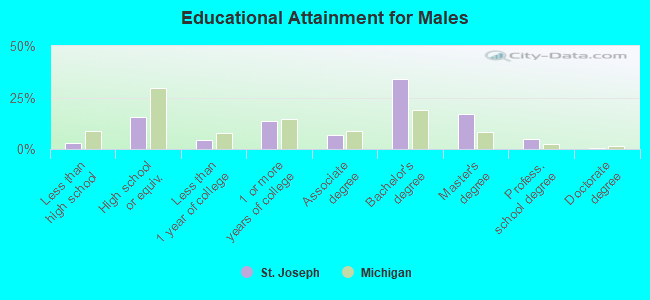
Education attainment for males 25 years and older:
- No schooling: 2
- Nursery to 4th grade: 0
- 5th and 6th grade: 0
- 7th and 8th grade: 9
- 9th grade: 9
- 10th grade: 5
- 11th grade: 67
- 12th grade, no diploma: 0
- High school graduate (or equivalency): 492
- Less than 1 year of college: 139
- Some college more than 1 year, no degree: 422
- Associate degree: 216
- Bachelor's degree: 1,072
- Master's degree: 530
- Professional school degree: 158
- Doctorate degree: 22
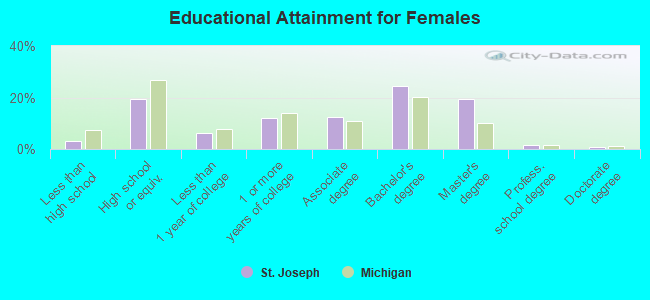
Education attainment for females 25 years and older:
- No schooling: 38
- Nursery to 4th grade: 0
- 5th and 6th grade: 0
- 7th and 8th grade: 0
- 9th grade: 10
- 10th grade: 12
- 11th grade: 9
- 12th grade, no diploma: 24
- High school graduate (or equivalency): 563
- Less than 1 year of college: 176
- Some college more than 1 year, no degree: 351
- Associate degree: 361
- Bachelor's degree: 710
- Master's degree: 561
- Professional school degree: 45
- Doctorate degree: 24
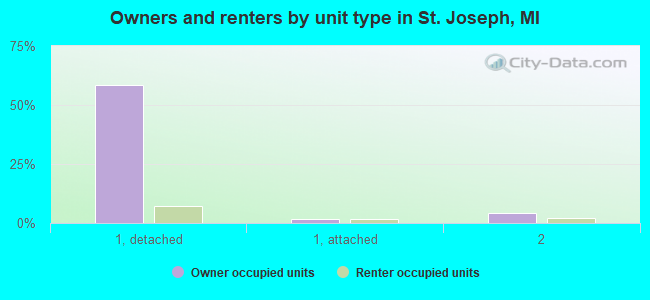
Housing units in structures:
- One, detached: 2,963
- One, attached: 113
- Two: 285
- 3 or 4: 313
- 5 to 9: 134
- 10 to 19: 214
- 20 to 49: 327
- 50 or more: 499
Housing units lacking complete kitchen facilities in 2022: 4.3%
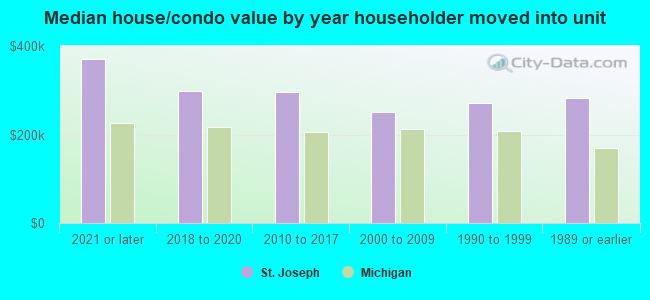
House/condo owner moved in on average 8 years ago
Renter moved in on average 1 years ago
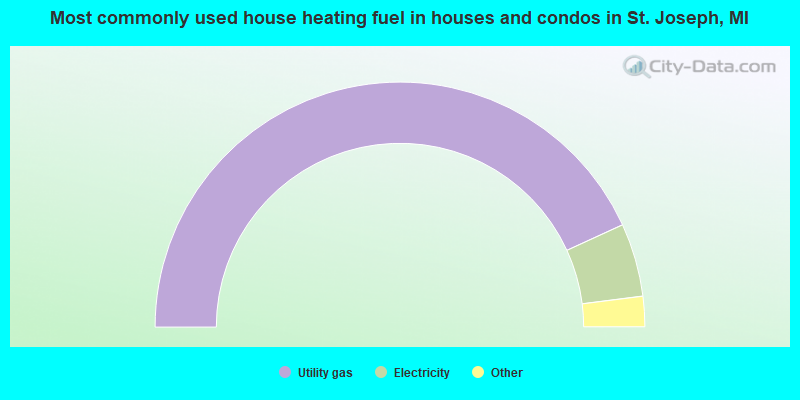
- 86.4%Utility gas
- 9.7%Electricity
- 2.7%Bottled, tank, or LP gas
- 0.6%Fuel oil, kerosene, etc.
- 0.6%Other fuel
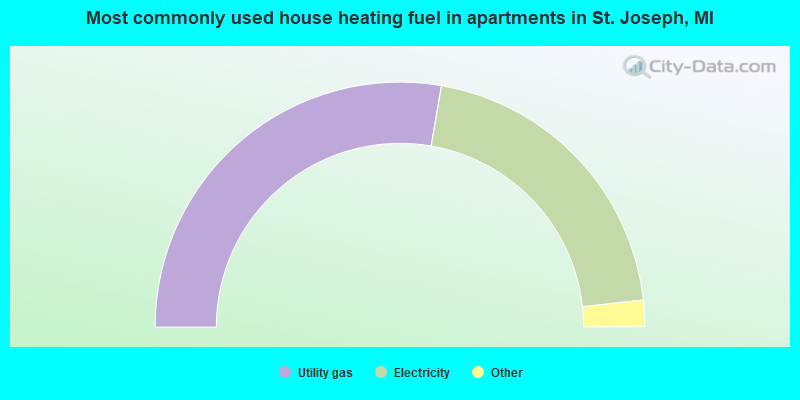
- 55.5%Utility gas
- 41.1%Electricity
- 2.7%Other fuel
- 0.8%Bottled, tank, or LP gas
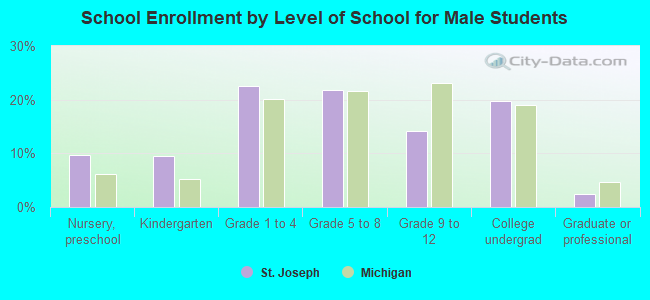
Private vs. public school enrollment:
| Here: | 12.8% |
| Michigan: | 12.4% |
| Here: | 7.4% |
| Michigan: | 9.8% |
| Here: | 1.0% |
| Michigan: | 14.9% |