Stafford, TX (Texas) Houses and Residents
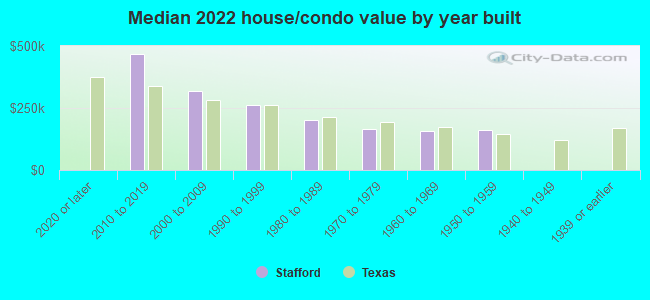
Estimated median house or condo value in 2022: $243,005 (it was $95,000 in 2000 )
Stafford:
$243,005Texas:
$275,400
Lower value quartile - upper value quartile: $166,238 - $337,012Total population: 18,344 (Urban population: 15,620, Rural population: 0)
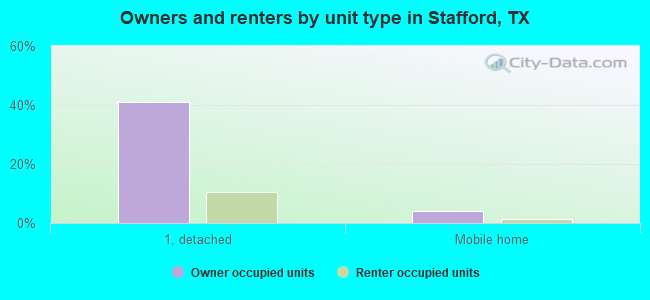
Houses: 7,607 (6,994 occupied: 3,229 owner occupied, 3,825 renter occupied )
% of renters here:
54%State:
38%
Housing density: 1,090 houses/condos per square mile
Median price asked for vacant for-sale houses and condos in 2022 in this county: $301,799.
Median contract rent in 2022: $1,233 (lower quartile is $1,047, upper quartile is $1,574)
Median rent asked for vacant for-rent units in 2022: $1,507
Median gross rent in Stafford, TX in 2022: $1,390
Housing units in Stafford with a mortgage: 1,565 (38 second mortgage, 0 home equity loan, 22 both second mortgage and home equity loan )Houses without a mortgage: 29
Median household income for houses/condos with a mortgage: $98,901
Median household income for apartments without a mortgage: $86,948
Median monthly housing costs: $1,230
Data:
Median house or condo value ($)
Median house or condo value ($ change since 2000)
Median house or condo value ($) - White
Median house or condo value ($) - Black or African American
Median house or condo value ($) - Asian
Median house or condo value ($) - Hispanic or Latino
Median house or condo value ($) - American Indian and Alaska Native
Median house or condo value ($) - Multirace
Median house or condo value ($) - Other Race
Median price asked for mobile homes ($)
Household density (households per square mile)
Mean house or condo value by units in structure - 1, detached ($)
Mean house or condo value by units in structure - 1, attached ($)
Mean house or condo value by units in structure - 2 ($)
Mean house or condo value by units in structure by units in structure - 3 or 4 ($)
Mean house or condo value by units in structure - 5 or more ($)
Mean house or condo value by units in structure - Boat, RV, van, etc. ($)
Mean house or condo value by units in structure - Mobile home ($)
Median contract rent ($)
Median contract rent - Lower quartile ($)
Median contract rent - Upper quartile ($)
Median gross rent ($)
Urban houses (%)
Rural houses (%)
Houses occupied (%)
Houses occupied (% change since 2000)
Houses owner occupied (%)
Houses owner occupied (% change since 2000)
Houses renter occupied (%)
Houses renter occupied (% change since 2000)
Vacant housing units - For rent (%)
Vacant housing units - For rent (% change since 2000)
Vacant housing units - For sale only (%)
Vacant housing units - For sale only (% change since 2000)
Vacant housing units - Rented or sold, not occupied (%)
Vacant housing units - Rented or sold, not occupied (% change since 2000)
Vacant housing units - For seasonal, recreational, or occasional use (%)
Vacant housing units - For seasonal, recreational, or occasional use (% change since 2000)
Vacant housing units - For migrant workers (%)
Vacant housing units - For migrant workers (% change since 2000)
Vacant housing units - Other vacant (%)
Vacant housing units - Other vacant (% change since 2000)
Median monthly housing costs ($)
Median household income for houses/condos with a mortgage ($)
Median household income for houses/condos without a mortgage ($)
Median household income ($)
Median household income ($) - White
Median household income ($) - Black or African American
Median household income ($) - Asian
Median household income ($) - Hispanic or Latino
Median household income ($) - American Indian and Alaska Native
Median household income ($) - Multirace
Median household income ($) - Other Race
Mortgage status - with mortgage (%)
Mortgage status - with second mortgage (%)
Mortgage status - with home equity loan (%)
Mortgage status - with both second mortgage and home equity loan (%)
Mortgage status - without a mortgage (%)
Median year house/condo built
Median year apartment built
Household type by relationship - Male householder living alone (%)
Household type by relationship - Male householder not living alone (%)
Household type by relationship - Female householder living alone (%)
Household type by relationship - Female householder not living alone (%)
Household type by relationship - Opposite-Sex spouse (%)
Household type by relationship - Same-Sex spouse (%)
Household type by relationship - Opposite-Sex unmarried partner (%)
Household type by relationship - Same-Sex unmarried partner (%)
Household type by relationship - In group quarters (%)
Size of family households - 2-person household (%)
Size of family households - 3-person household (%)
Size of family households - 4-person household (%)
Size of family households - 5-person household (%)
Size of family households - 6-person household (%)
Size of family households - 7-or-more-person household (%)
Size of nonfamily households - 1-person household (%)
Size of nonfamily households - 2-person household (%)
Size of nonfamily households - 3-person household (%)
Size of nonfamily households - 4-person household (%)
Size of nonfamily households - 5-person household (%)
Size of nonfamily households - 6-person household (%)
Size of nonfamily households - 7-or-moreperson household (%)
Year house built - Built 2010 or later (%)
Year house built - Built 2000 to 2009 (%)
Year house built - Built 1990 to 1999 (%)
Year house built - Built 1980 to 1989 (%)
Year house built - Built 1970 to 1979 (%)
Year house built - Built 1960 to 1969 (%)
Year house built - Built 1950 to 1959 (%)
Year house built - Built 1940 to 1949 (%)
Year house built - Built 1939 or earlier (%)
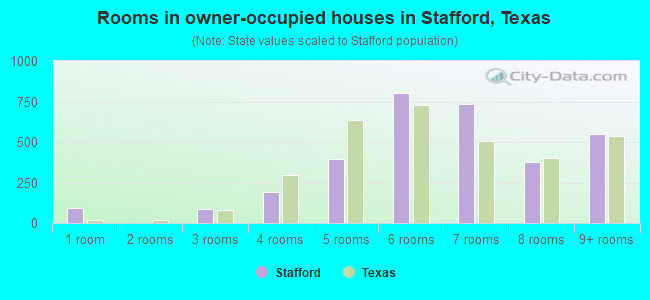
Median number of rooms in houses and condos
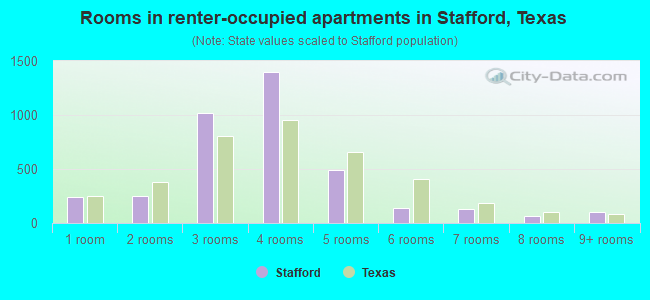
Median number of rooms in apartments
Median number of bedrooms in owner occupied houses
Mean number of bedrooms in owner occupied houses
Median number of bedrooms in renter occupied houses
Mean number of bedrooms in renter occupied houses
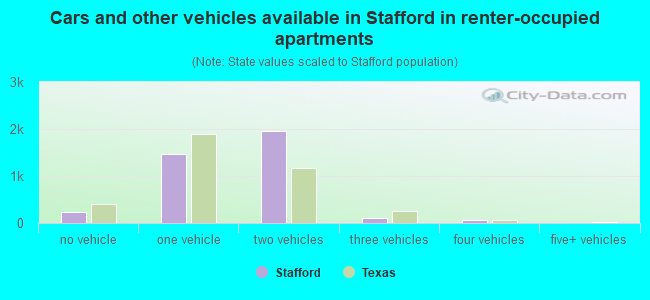
Median number of vehichles in owner occupied houses
Mean number of vehichles in owner occupied houses
Median number of vehichles in renter occupied houses
Mean number of vehichles in renter occupied houses
Rooms in owner-occupied houses - 1 room (%)
Rooms in owner-occupied houses - 2 rooms (%)
Rooms in owner-occupied houses - 3 rooms (%)
Rooms in owner-occupied houses - 4 rooms (%)
Rooms in owner-occupied houses - 5 rooms (%)
Rooms in owner-occupied houses - 6 rooms (%)
Rooms in owner-occupied houses - 7 rooms (%)
Rooms in owner-occupied houses - 8 rooms (%)
Rooms in owner-occupied houses - 9+ rooms (%)
Rooms in renter-occupied houses - 1 room (%)
Rooms in renter-occupied houses - 2 rooms (%)
Rooms in renter-occupied houses - 3 rooms (%)
Rooms in renter-occupied houses - 4 rooms (%)
Rooms in renter-occupied houses - 5 rooms (%)
Rooms in renter-occupied houses - 6 rooms (%)
Rooms in renter-occupied houses - 7 rooms (%)
Rooms in renter-occupied houses - 8 rooms (%)
Rooms in renter-occupied houses - 9+ rooms (%)
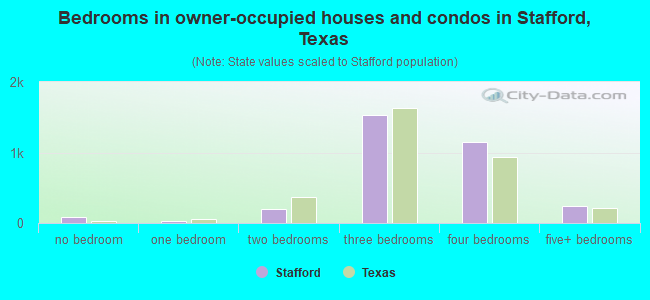
Bedrooms in owner-occupied houses - no bedrooms (%)
Bedrooms in owner-occupied houses - 1 bedroom (%)
Bedrooms in owner-occupied houses - 2 bedrooms (%)
Bedrooms in owner-occupied houses - 3 bedrooms (%)
Bedrooms in owner-occupied houses - 4 bedrooms (%)
Bedrooms in owner-occupied houses - 5+ bedrooms (%)
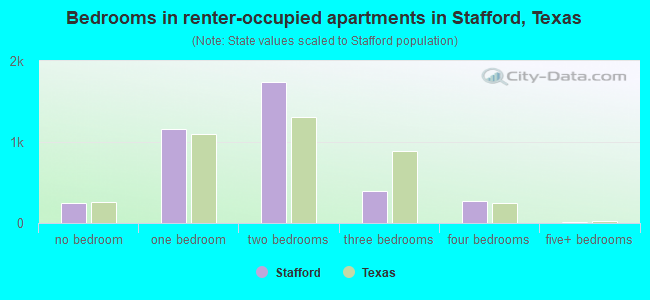
Bedrooms in renter-occupied houses - no bedrooms (%)
Bedrooms in renter-occupied houses - 1 bedroom (%)
Bedrooms in renter-occupied houses - 2 bedrooms (%)
Bedrooms in renter-occupied houses - 3 bedrooms (%)
Bedrooms in renter-occupied houses - 4 bedrooms (%)
Bedrooms in renter-occupied houses - 5+ bedrooms (%)
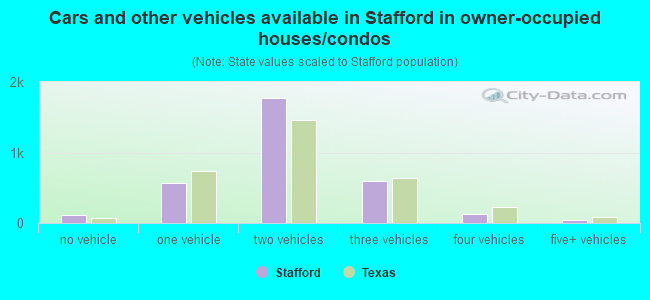
Vehicles available in owner-occupied houses - no vehicle available (%)
Vehicles available in owner-occupied houses - 1 vehicle available(%)
Vehicles available in owner-occupied houses - 2 Vehicles available (%)
Vehicles available in owner-occupied houses - 3 Vehicles available (%)
Vehicles available in owner-occupied houses - 4 Vehicles available (%)
Vehicles available in owner-occupied houses - 5+ Vehicles available (%)
Vehicles available in renter-occupied houses - no vehicle available (%)
Vehicles available in renter-occupied houses - 1 vehicle available (%)
Vehicles available in renter-occupied houses - 2 Vehicles available (%)
Vehicles available in renter-occupied houses - 3 Vehicles available (%)
Vehicles available in renter-occupied houses - 4 Vehicles available (%)
Vehicles available in renter-occupied houses - 5+ Vehicles available (%)
Housing units in structures - 1, detached (%)
Housing units in structures - 1, attached (%)
Housing units in structures - 2 (%)
Housing units in structures - 3 or 4 (%)
Housing units in structures - 5 to 9 (%)
Housing units in structures - 10 to 19 (%)
Housing units in structures - 20 to 49 (%)
Housing units in structures - 50 or more (%)
Housing units in structures - Mobile home (%)
Housing units in structures - Boat, RV, van, etc. (%)
Housing units in structures - Owners - 1, detached (%)
Housing units in structures - Owners - 1, attached (%)
Housing units in structures - Owners - 2 (%)
Housing units in structures - Owners - 3 or 4 (%)
Housing units in structures - Owners - 5 to 9 (%)
Housing units in structures - Owners - 10 to 19 (%)
Housing units in structures - Owners - 20 to 49 (%)
Housing units in structures - Owners - 50 or more (%)
Housing units in structures - Owners - Mobile home (%)
Housing units in structures - Owners - Boat, RV, van, etc. (%)
Housing units in structures - Renters - 1, detached (%)
Housing units in structures - Renters - 1, attached (%)
Housing units in structures - Renters - 2 (%)
Housing units in structures - Renters - 3 or 4 (%)
Housing units in structures - Renters - 5 to 9 (%)
Housing units in structures - Renters - 10 to 19 (%)
Housing units in structures - Renters - 20 to 49 (%)
Housing units in structures - Renters - 50 or more (%)
Housing units in structures - Renters - Mobile home (%)
Housing units in structures - Renters - Boat, RV, van, etc. (%)
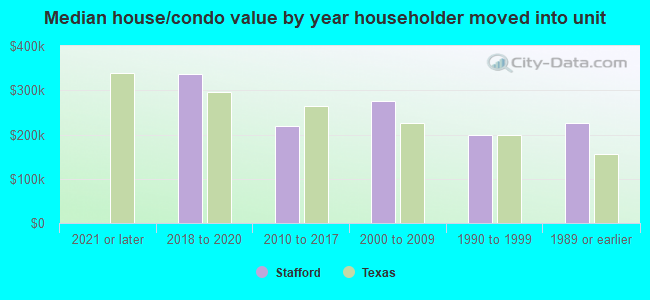
House/condo owner moved in on average (years ago)
Renter moved in on average (years ago)
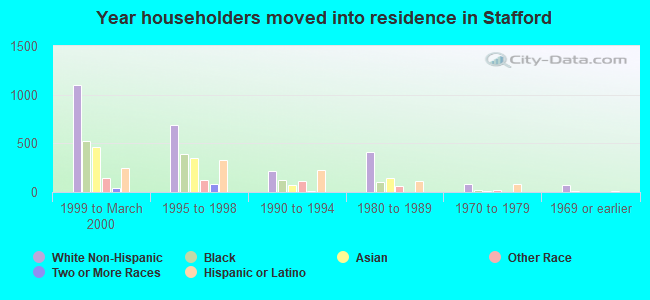
Year householder moved into unit - Moved in 1999 to March 2000 (%)
Year householder moved into unit - Moved in 1999 to March 2000 (%) - White
Year householder moved into unit - Moved in 1999 to March 2000 (%) - Black or African American
Year householder moved into unit - Moved in 1999 to March 2000 (%) - Asian
Year householder moved into unit - Moved in 1999 to March 2000 (%) - Hispanic or Latino
Year householder moved into unit - Moved in 1999 to March 2000 (%) - American Indian and Alaska Native
Year householder moved into unit - Moved in 1999 to March 2000 (%) - Multirace
Year householder moved into unit - Moved in 1999 to March 2000 (%) - Other Race
Year householder moved into unit - Moved in 1995 to 1998 (%)
Year householder moved into unit - Moved in 1995 to 1998 (%) - White
Year householder moved into unit - Moved in 1995 to 1998 (%) - Black or African American
Year householder moved into unit - Moved in 1995 to 1998 (%) - Asian
Year householder moved into unit - Moved in 1995 to 1998 (%) - Hispanic or Latino
Year householder moved into unit - Moved in 1995 to 1998 (%) - American Indian and Alaska Native
Year householder moved into unit - Moved in 1995 to 1998 (%) - Multirace
Year householder moved into unit - Moved in 1995 to 1998 (%) - Other Race
Year householder moved into unit - Moved in 1990 to 1994 (%)
Year householder moved into unit - Moved in 1990 to 1994 (%) - White
Year householder moved into unit - Moved in 1990 to 1994 (%) - Black or African American
Year householder moved into unit - Moved in 1990 to 1994 (%) - Asian
Year householder moved into unit - Moved in 1990 to 1994 (%) - Hispanic or Latino
Year householder moved into unit - Moved in 1990 to 1994 (%) - American Indian and Alaska Native
Year householder moved into unit - Moved in 1990 to 1994 (%) - Multirace
Year householder moved into unit - Moved in 1990 to 1994 (%) - Other Race
Year householder moved into unit - Moved in 1980 to 1989 (%)
Year householder moved into unit - Moved in 1980 to 1989 (%) - White
Year householder moved into unit - Moved in 1980 to 1989 (%) - Black or African American
Year householder moved into unit - Moved in 1980 to 1989 (%) - Asian
Year householder moved into unit - Moved in 1980 to 1989 (%) - Hispanic or Latino
Year householder moved into unit - Moved in 1980 to 1989 (%) - American Indian and Alaska Native
Year householder moved into unit - Moved in 1980 to 1989 (%) - Multirace
Year householder moved into unit - Moved in 1980 to 1989 (%) - Other Race
Year householder moved into unit - Moved in 1970 to 1979 (%)
Year householder moved into unit - Moved in 1970 to 1979 (%) - White
Year householder moved into unit - Moved in 1970 to 1979 (%) - Black or African American
Year householder moved into unit - Moved in 1970 to 1979 (%) - Asian
Year householder moved into unit - Moved in 1970 to 1979 (%) - Hispanic or Latino
Year householder moved into unit - Moved in 1970 to 1979 (%) - American Indian and Alaska Native
Year householder moved into unit - Moved in 1970 to 1979 (%) - Multirace
Year householder moved into unit - Moved in 1970 to 1979 (%) - Other Race
Year householder moved into unit - Moved in 1969 or earlier (%)
Year householder moved into unit - Moved in 1969 or earlier (%) - White
Year householder moved into unit - Moved in 1969 or earlier (%) - Black or African American
Year householder moved into unit - Moved in 1969 or earlier (%) - Asian
Year householder moved into unit - Moved in 1969 or earlier (%) - Hispanic or Latino
Year householder moved into unit - Moved in 1969 or earlier (%) - American Indian and Alaska Native
Year householder moved into unit - Moved in 1969 or earlier (%) - Multirace
Year householder moved into unit - Moved in 1969 or earlier (%) - Other Race
Housing units lacking complete plumbing facilities (%)
Housing units lacking complete kitchen facilities (%)
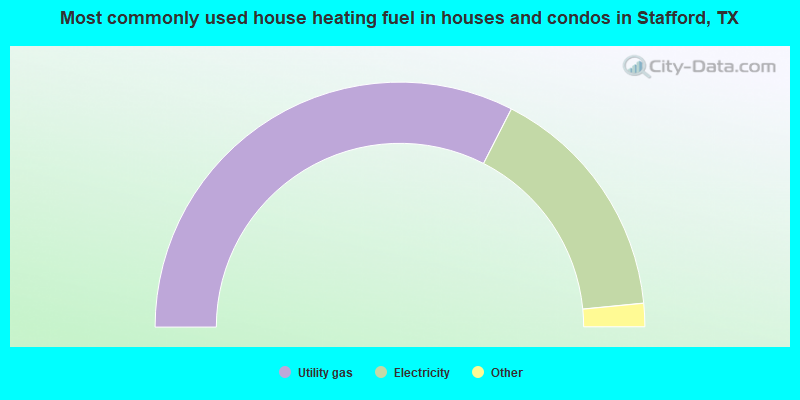
House heating fuel used in houses and condos - Utility gas (%)
House heating fuel used in houses and condos - Bottled, tank, or LP gas (%)
House heating fuel used in houses and condos - Electricity (%)
House heating fuel used in houses and condos - Fuel oil, kerosene, etc. (%)
House heating fuel used in houses and condos - Coal or coke (%)
House heating fuel used in houses and condos - Wood (%)
House heating fuel used in houses and condos - Solar energy (%)
House heating fuel used in houses and condos - Other fuel (%)
House heating fuel used in houses and condos - No fuel used (%)
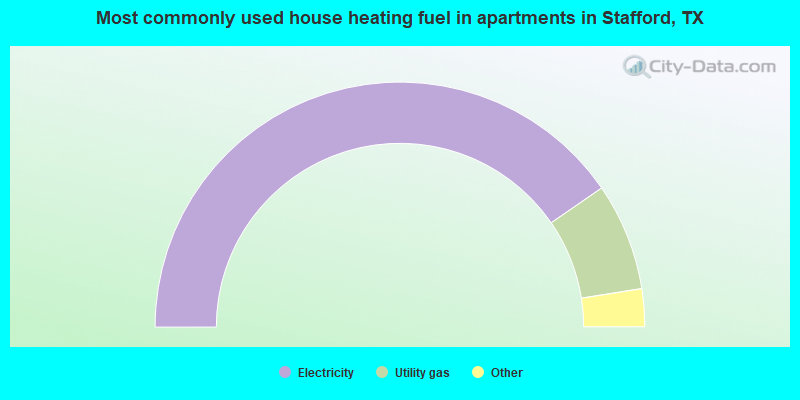
House heating fuel used in apartments - Utility gas (%)
House heating fuel used in apartments - Bottled, tank, or LP gas (%)
House heating fuel used in apartments - Electricity (%)
House heating fuel used in apartments - Fuel oil, kerosene, etc. (%)
House heating fuel used in apartments - Coal or coke (%)
House heating fuel used in apartments - Wood (%)
House heating fuel used in apartments - Solar energy (%)
House heating fuel used in apartments - Other fuel (%)
House heating fuel used in apartments - No fuel used (%)
Latest news about housing in Stafford, TX collected exclusively by city-data.com from local newspapers, TV, and radio stations
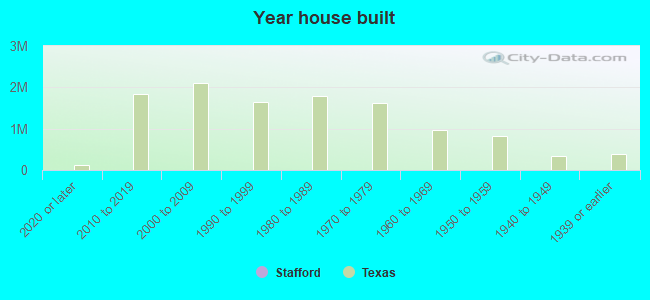
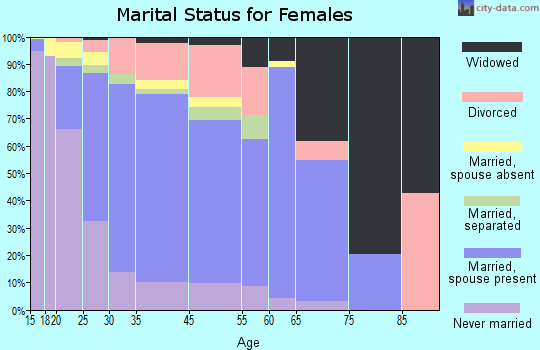
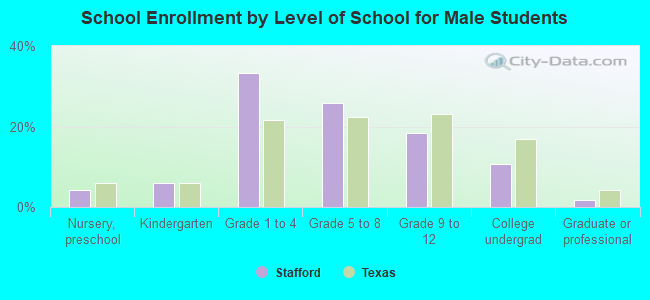
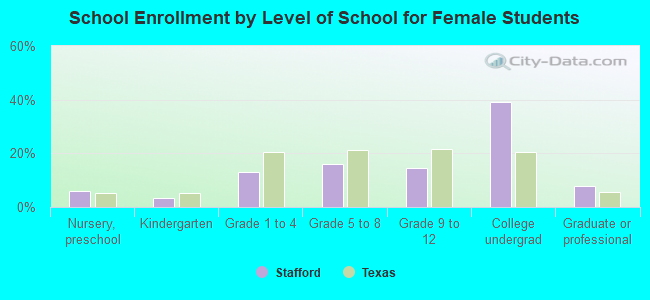
Median year house/condo built: 1991Median year apartment built: 1995Household type by relationship:
Households: 18,410
Male householders: 3,355 (785 living alone ), Female householders: 3,541 (934 living alone )3,075 spouses (2,995 opposite-sex spouses ), 796 unmarried partners , (780 opposite-sex unmarried partners ), 5,891 children (5,366 natural , 168 adopted , 356 stepchildren ), 288 grandchildren , 95 brothers or sisters , 348 parents , 0 foster children , 482 other relatives , 516 non-relatives In group quarters: 19
Size of family households: 1,483 2-persons , 1,599 3-persons , 820 4-persons , 649 5-persons , 160 6-persons , 63 7-or-more-persons .
Size of nonfamily households: 1,865 1-person , 371 2-persons , 215 3-persons .
1,916 married couples with children. single-parent households (431 men , 1,613 women ).
51.8% of residents of Stafford speak English at home. of residents speak Spanish at home (65% speak English very well , 17% speak English well , 14% speak English not well , 4% don't speak English at all ).of residents speak other Indo-European language at home (69% speak English very well , 20% speak English well , 11% speak English not well ).of residents speak Asian or Pacific Island language at home (46% speak English very well , 39% speak English well , 9% speak English not well , 6% don't speak English at all ).of residents speak other language at home (88% speak English very well , 12% speak English well ).
Foreign born population: 6,018 (32.7%)of them are naturalized citizens )
Median number of rooms in houses and condos:
Median number of rooms in apartments
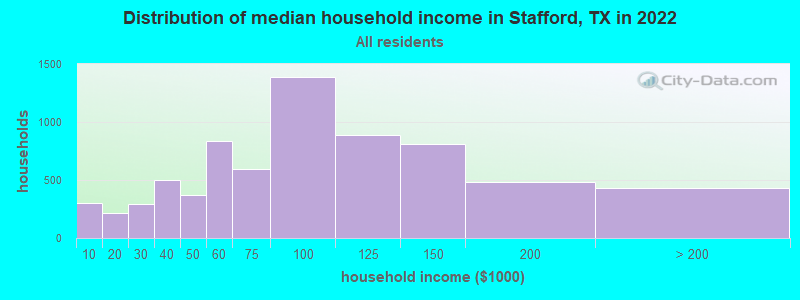
Stafford, TX household income distribution 302 Less than $10,000213 $10,000 to $19,999294 $20,000 to $29,999504 $30,000 to $39,999369 $40,000 to $49,999839 $50,000 to $59,999597 $60,000 to $74,9991,392 $75,000 to $99,999889 $100,000 to $124,999808 $125,000 to $149,999483 $150,000 to $199,999432 $200,000 or more
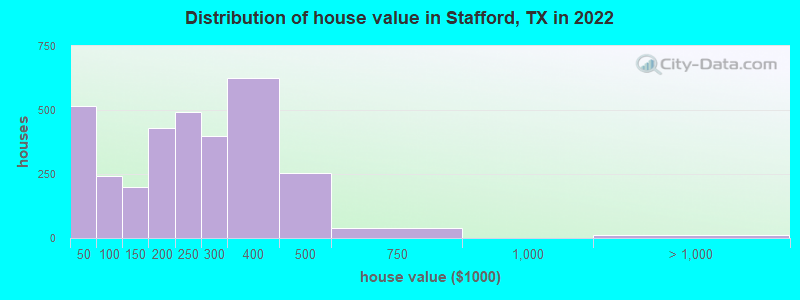
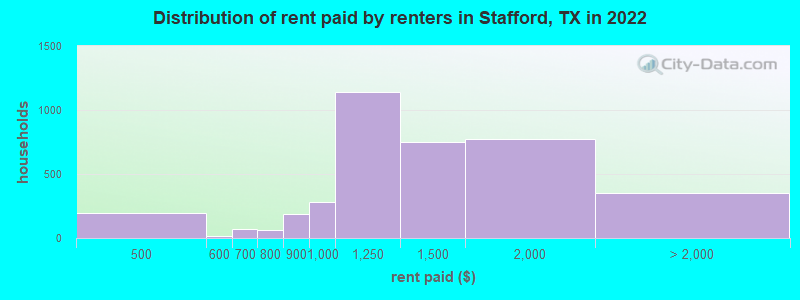
Home value of owner - occupied houses in 2022 in Stafford, TX 333 Less than $10,00042 $10,000 to $14,999135 $25,000 to $29,9992 $30,000 to $34,999143 $60,000 to $69,99926 $70,000 to $79,99973 $80,000 to $89,999108 $100,000 to $124,99990 $125,000 to $149,999265 $150,000 to $174,999163 $175,000 to $199,999492 $200,000 to $249,999400 $250,000 to $299,999623 $300,000 to $399,999253 $400,000 to $499,99939 $500,000 to $749,99912 $1,000,000 to $1,499,999Rent paid by renters in 2022 in Stafford, TX 191 $450 to $49916 $550 to $59967 $600 to $6492 $650 to $69916 $700 to $74942 $750 to $799186 $800 to $899281 $900 to $9991,137 $1,000 to $1,249749 $1,250 to $1,499773 $1,500 to $1,999172 $2,000 to $2,499179 No cash rent
Percentage of workers working in this county: 49.5%Number of people working at home: 986 (9.6% of all workers )
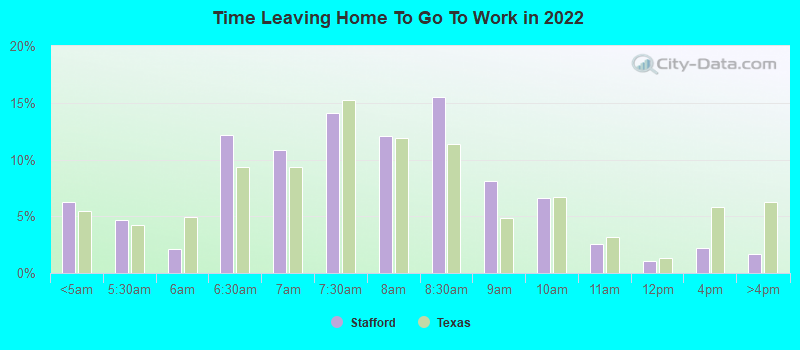
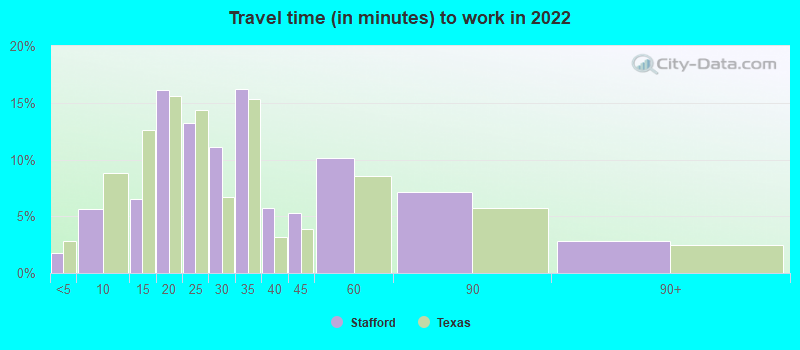
Travel time to work (commute)
Less than 5 minutes: 3825 to 9 minutes: 1,21810 to 14 minutes: 75815 to 19 minutes: 1,51020 to 24 minutes: 1,17325 to 29 minutes: 48730 to 34 minutes: 1,04435 to 39 minutes: 62840 to 44 minutes: 43545 to 59 minutes: 74560 to 89 minutes: 64690 or more minutes: 83
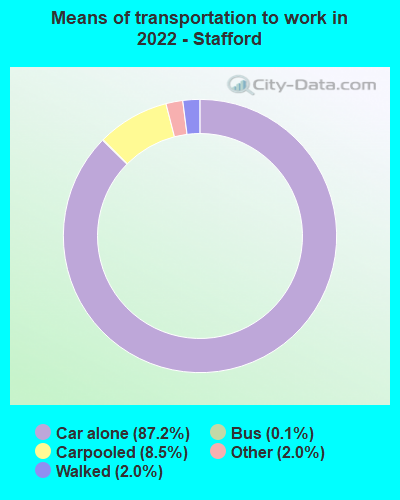
Means of transportation to work:
Drove a car alone: 18,940 (79.3%)Carpooled: 2,185 (9.1%)Bus : 16 (0.1%)Taxi: 531 (2.2%)Bicycle: 9 (0.0%)Walked: 579 (2.4%)Worked at home: 986 (4.1%)
Unemployment by race in 2022
Unemployment rate for White non-Hispanic residents 6.0% Males1.0% FemalesUnemployment rate for Black residents 7.8% Males0.2% FemalesUnemployment rate for American Indian and Alaska Native residents 54.8% MalesUnemployment rate for Asian residents 9.4% Males1.4% FemalesUnemployment rate for Hispanic or Latino residents 5.2% Females
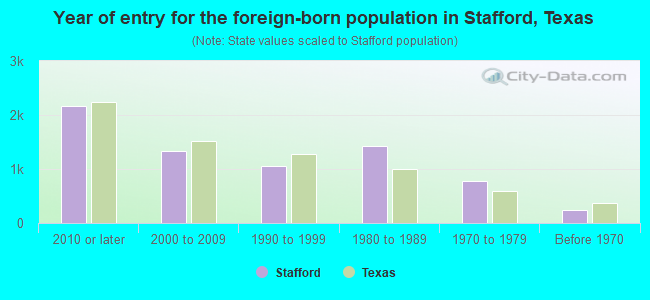
Year of entry for the foreign-born population in Stafford, Texas
2,158 2010 or later 1,329 2000 to 2009 1,064 1990 to 1999 1,432 1980 to 1989 772 1970 to 1979 249 Before 1970
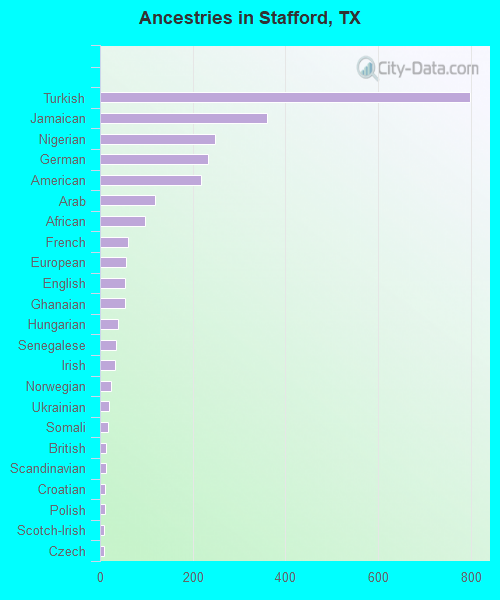
First ancestries reported:
Turkish: 799 (6.7%)
Jamaican: 361 (3.0%)
Nigerian: 247 (2.1%)
German: 233 (2.0%)
American: 218 (1.8%)
Arab: 119 (1.0%)
African: 96 (0.8%)
French: 60 (0.5%)
European: 57 (0.5%)
English: 53 (0.4%)
Ghanaian: 53 (0.4%)
Hungarian: 39 (0.3%)
Senegalese: 34 (0.3%)
Irish: 33 (0.3%)
Norwegian: 23 (0.2%)
Ukrainian: 20 (0.2%)
Somali: 17 (0.1%)
British: 13 (0.1%)
Scandinavian: 13 (0.1%)
Croatian: 11 (0.09%)
Polish: 10 (0.08%)
Scotch-Irish: 9 (0.08%)
Czech: 8 (0.07%) Most common places of birth for foreign-born residents (%): Turkey Stafford:
16.0% (927)Texas:
0.3% (13,298)
Mexico Stafford:
14.7% (854)Texas:
48.4% (2,411,723)
India Stafford:
13.5% (783)Texas:
6.1% (306,347)
Vietnam Stafford:
10.8% (627)Texas:
3.7% (184,770)
Philippines Stafford:
6.4% (369)Texas:
2.1% (103,148)
Pakistan Stafford:
5.2% (302)Texas:
1.2% (62,159)
Jamaica Stafford:
5.2% (302)Texas:
0.4% (17,748)
China, excluding Hong Kong and Taiwan Stafford:
4.8% (276)Texas:
2.3% (115,558)
Honduras Stafford:
4.5% (260)Texas:
3.0% (147,182)
Malaysia Stafford:
3.8% (221)Texas:
0.2% (8,227)
United Arab Emirates Stafford:
2.9% (166)Texas:
0.1% (5,595)
Nigeria Stafford:
2.4% (138)Texas:
1.9% (96,110)
Cambodia Stafford:
2.1% (124)Texas:
0.2% (9,997)
Hong Kong Stafford:
2.0% (115)Texas:
0.2% (9,629)
El Salvador Stafford:
1.9% (109)Texas:
4.5% (224,455)
Other South Central Asia Stafford:
1.8% (103)Texas:
0.0% (1,305)
Place of birth for U.S.-born residents:
This state: 8,564Other state: 3,775Northeast: 298Midwest: 1,029South: 1,410West: 1,065 86.7% of Stafford residents lived in the same house 1 years ago.
Out of people who lived in different houses, 23.4% lived in this county.
Out of people who lived in different counties, 83.6% lived in Texas.
Stafford:
86.7%State average:
85.7%
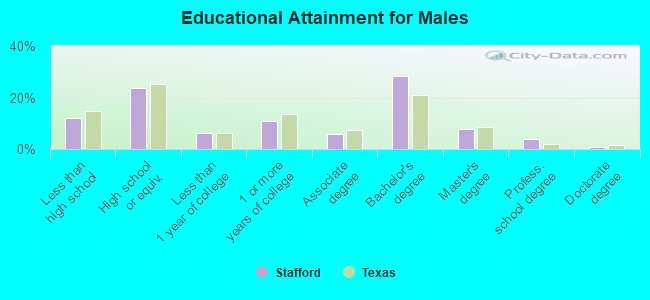
Education attainment for males 25 years and older:
No schooling: 246Nursery to 4th grade: 25th and 6th grade: 427th and 8th grade: 369th grade: 10010th grade: 8811th grade: 7612th grade, no diploma: 153High school graduate (or equivalency): 1,485Less than 1 year of college: 392Some college more than 1 year, no degree: 680Associate degree: 374Bachelor's degree: 1,775Master's degree: 478Professional school degree: 246Doctorate degree: 51
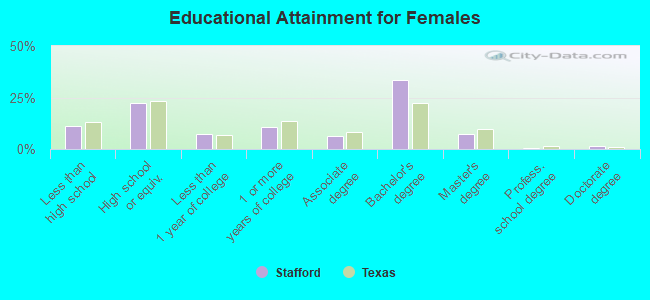
Education attainment for females 25 years and older:
No schooling: 344Nursery to 4th grade: 35th and 6th grade: 47th and 8th grade: 199th grade: 7210th grade: 4511th grade: 13712th grade, no diploma: 71High school graduate (or equivalency): 1,356Less than 1 year of college: 432Some college more than 1 year, no degree: 648Associate degree: 385Bachelor's degree: 2,030Master's degree: 432Professional school degree: 38Doctorate degree: 86
Housing units in structures:
One, detached: 3,786One, attached: 220Two: 453 or 4: 2065 to 9: 52710 to 19: 60320 to 49: 64050 or more: 1,206Mobile homes: 370Median worth of mobile homes: $17,590
Housing units lacking complete plumbing facilities in 2022: 0.9%Housing units lacking complete kitchen facilities in 2022: 2.4%House/condo owner moved in on average 15 years ago
Renter moved in on average 3 years ago
Private vs. public school enrollment:
Students in private schools in grades 1 to 8 (elementary and middle school): 201 Students in private schools in grades 9 to 12 (high school): 66 Students in private undergraduate colleges: 84