Standish, ME (Maine) Houses and Residents
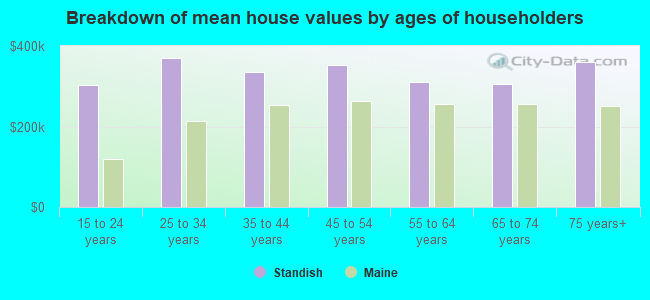
| Standish: | $397,320 |
| Maine: | $290,600 |
Total population: 9,874 (Urban population: 913 (all inside urban clusters), Rural population: 8,372 (69 farm, 8,303 nonfarm))
Houses: 3,987 (3,205 occupied: 2,812 owner occupied, 393 renter occupied)
| % of renters here: | 12% |
| State: | 26% |
Housing density: 67 houses/condos per square mile
Median price asked for vacant for-sale houses and condos in 2022 in this county: $208,289.
Median contract rent in 2022: $1,282 (lower quartile is $826, upper quartile is $1,594)
Median rent asked for vacant for-rent units in 2022: $947
Median gross rent in Standish, ME in 2022: $1,390
Housing units in Standish with a mortgage: 1,748 (169 second mortgage, 332 home equity loan, 0 both second mortgage and home equity loan)
Houses without a mortgage: 405
Compare current foreclosures near Standish, ME:
| Photo | Address | Area | Beds / Baths | Price | Details |
|---|---|---|---|---|---|

|
#1
Goldie Ln
Standish, ME 04084
|
2,273 sq. feet
|
1 baths 3 beds |
show details | |

|
#2
Motorcycle Dr
Windham, ME 04062
|
2,772 sq. feet
|
2 baths 3 beds |
show details | |

|
#3
High St
Windham, ME 04062
|
933 sq. feet
|
1 baths 2 beds |
show details | |

|
#4
Jennifer Way
Gorham, ME 04038
|
1,414 sq. feet
|
1 baths 3 beds |
show details | |

|
#5
Haskell St
Westbrook, ME 04092
|
1,573 sq. feet
|
1 baths 3 beds |
show details | |

|
#6
Coach Rd
South Portland, ME 04106
|
1,300 sq. feet
|
2 baths 3 beds |
show details | |

|
#7
Church St
Westbrook, ME 04092
|
1,529 sq. feet
|
1 baths 3 beds |
show details | |

|
#8
Dollys Way
Scarborough, ME 04074
|
1,821 sq. feet
|
2 baths 3 beds |
show details | |

|
#9
Saco St Unit 2
Westbrook, ME 04092
|
1,725 sq. feet
|
2 baths 4 beds |
show details | |

|
#10
Bridge St
Westbrook, ME 04092
|
1,268 sq. feet
|
1 baths 2 beds |
show details |
| Photo | Address | Area | Beds / Baths | Price | Details |
|---|---|---|---|---|---|

|
#11
Bruce Hill Rd
Cumberland Center, ME 04021
|
2,536 sq. feet
|
2 baths 3 beds |
show details | |

|
#12
Ring Landing Rd
Casco, ME 04015
|
1,296 sq. feet
|
1 baths 3 beds |
show details | |

|
#13
Main St
Gorham, ME 04038
|
691 sq. feet
|
1 baths 2 beds |
show details | |

|
#14
Running Brook Rd
Windham, ME 04062
|
1,749 sq. feet
|
2 baths 3 beds |
show details | |

|
#15
Emerson Dr
Windham, ME 04062
|
1,080 sq. feet
|
1 baths 3 beds |
show details | |

|
#16
Windham Center Rd
Windham, ME 04062
|
1,576 sq. feet
|
1 baths 3 beds |
show details | |

|
#17
Scarborough Downs Rd
Scarborough, ME 04074
|
- sq. feet
|
- baths - beds |
show details | |

|
#18
Devereaux Cir
South Portland, ME 04106
|
- sq. feet
|
- baths - beds |
show details | |

|
#19
Wainwright Cir W
South Portland, ME 04106
|
- sq. feet
|
- baths - beds |
show details | |

|
#20
Congress St
Portland, ME 04101
|
- sq. feet
|
- baths - beds |
show details |
| Photo | Address | Area | Beds / Baths | Price | Details |
|---|---|---|---|---|---|

|
#21
Liberty Way
Portland, ME 04103
|
- sq. feet
|
- baths - beds |
show details | |

|
#22
Pleasant Ave
Portland, ME 04103
|
- sq. feet
|
- baths - beds |
show details | |

|
#23
Townhouse Dr
South Portland, ME 04106
|
- sq. feet
|
- baths - beds |
show details | |

|
#24
Ocean Ave
Portland, ME 04103
|
- sq. feet
|
- baths - beds |
show details | |

|
#25
Congress St Unit 307
Portland, ME 04101
|
- sq. feet
|
- baths - beds |
show details | |

|
#26
Cumberland Ave # 302
Portland, ME 04101
|
- sq. feet
|
- baths - beds |
show details | |

|
#27
Us Route 1, Apt 11
Scarborough, ME 04074
|
- sq. feet
|
- baths - beds |
show details | |

|
#28
Ocean Ave
Portland, ME 04103
|
- sq. feet
|
- baths - beds |
show details | |

|
#29
Ballantyne Dr
Scarborough, ME 04074
|
- sq. feet
|
- baths - beds |
show details | |

|
#30
Park Ave Apt 2
Portland, ME 04101
|
- sq. feet
|
- baths - beds |
show details |
| Photo | Address | Area | Beds / Baths | Price | Details |
|---|---|---|---|---|---|

|
#31
Congress St # 2
Portland, ME 04102
|
- sq. feet
|
- baths - beds |
show details | |

|
#32
Yarmouth Rd
Gray, ME 04039
|
- sq. feet
|
- baths - beds |
show details | |

|
#33
Lincoln Rd
Saco, ME 04072
|
- sq. feet
|
- baths - beds |
show details | |

|
#34
Riverside St Apt 424
Portland, ME 04103
|
- sq. feet
|
- baths - beds |
show details | |

|
#35
Sargent St
Westbrook, ME 04092
|
- sq. feet
|
- baths - beds |
show details | |

|
#36
Emma Ln
Gorham, ME 04038
|
- sq. feet
|
- baths - beds |
show details | |

|
#37
Gray Rd
Cumberland Center, ME 04021
|
- sq. feet
|
- baths - beds |
show details | |

|
#38
Liza Harmon Dr Apt 128
Westbrook, ME 04092
|
- sq. feet
|
- baths - beds |
show details | |

|
#39
Webster Rd
Buxton, ME 04093
|
- sq. feet
|
- baths - beds |
show details | |

|
#40
Cape Rd
Limington, ME 04049
|
- sq. feet
|
- baths - beds |
show details |
| Photo | Address | Area | Beds / Baths | Price | Details |
|---|---|---|---|---|---|

|
#41
Lambert St # C2
Portland, ME 04103
|
- sq. feet
|
- baths - beds |
show details | |

|
#42
Garnet Dr
South Portland, ME 04106
|
- sq. feet
|
- baths - beds |
show details | |

|
#43
Harlan Dr
Limington, ME 04049
|
- sq. feet
|
- baths - beds |
show details | |

|
#44
Pleasant St
Portland, ME 04101
|
- sq. feet
|
- baths - beds |
show details | |

|
#45
Tall Pines Ln
Parsonsfield, ME 04047
|
- sq. feet
|
- baths - beds |
show details | |

|
#46
Sebago Rd
Sebago, ME 04029
|
- sq. feet
|
- baths - beds |
show details | |

|
#47
Sokokis Ave
Limington, ME 04049
|
- sq. feet
|
- baths - beds |
show details | |

|
#48
Wendy Way
Portland, ME 04103
|
- sq. feet
|
- baths - beds |
show details | |

|
#49
Narragansett Trl
Buxton, ME 04093
|
- sq. feet
|
- baths - beds |
show details | |

|
Check over 1 million property listings on Foreclosure.com!
|
browse all offers | |||

Latest news about housing in Standish, ME collected exclusively by city-data.com from local newspapers, TV, and radio stations

 | Will Portland home prices keep going up? (46 replies) |
| Moving to ME from Hawaii (10 replies) |
| Gentrification in Portland? (14 replies) |
| What's with this mentality against people who move here? (91 replies) |
| Gorham vs. Standish (13 replies) |
| Country line dancing (2 replies) |

Household type by relationship:
Households: 272,484- In family households: 211,393 (47,384 male householders, 23,394 female householders)
54,885 spouses, 70,489 children (65,748 natural, 2,115 adopted, 2,626 stepchildren), 2,897 grandchildren, 1,680 brothers or sisters, 1,742 parents, foster children, 1,559 other relatives, 6,110 non-relatives
- In nonfamily households: 61,091 (20,346 male householders (14,215 living alone)), 26,215 female householders (20,616 living alone)), 14,530 nonrelatives
- In group quarters: 9,190 (3,057 institutionalized population)
44,717 married couples with children.
13,381 single-parent households (2,889 men, 10,492 women).
96.0% of residents of Standish speak English at home.
1.1% of residents speak Spanish at home (95% speak English very well, 5% speak English well).
2.6% of residents speak other Indo-European language at home (94% speak English very well, 3% speak English well, 3% speak English not well).
0.2% of residents speak Asian or Pacific Island language at home (100% speak English very well).
Foreign born population: 335 (3.1%)
(91.0% of them are naturalized citizens)
| Here: | 6.4 |
| State: | 6.1 |
| Here: | 3.8 |
| State: | 4.0 |
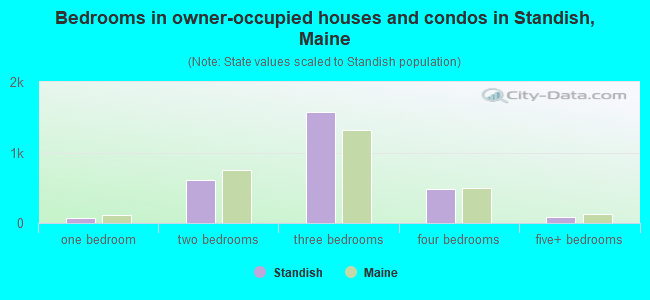
- Bedrooms in owner-occupied houses and condos in Standish, Maine
- 0no bedroom
- 691 bedroom
- 6052 bedrooms
- 1,5693 bedrooms
- 4834 bedrooms
- 865+ bedrooms
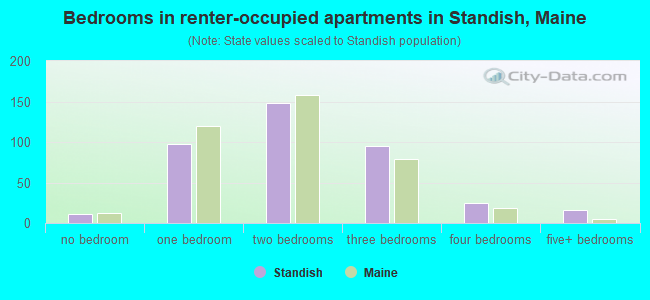
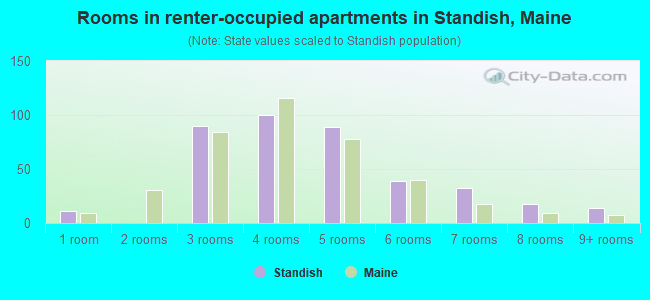
- Bedrooms in renter-occupied apartments in Standish, Maine
- 11no bedroom
- 981 bedroom
- 1482 bedrooms
- 953 bedrooms
- 254 bedrooms
- 165+ bedrooms
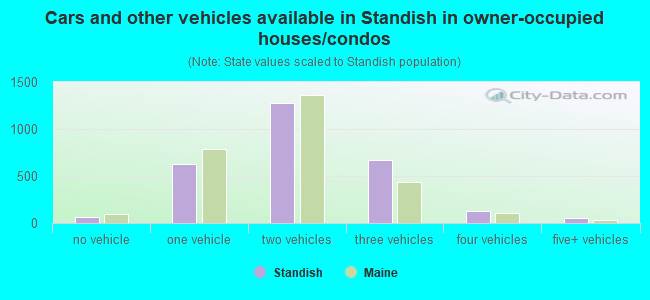
- Cars and other vehicles available in Standish in owner-occupied houses/condos
- 63no vehicle
- 6281 vehicle
- 1,2732 vehicles
- 6663 vehicles
- 1254 vehicles
- 575+ vehicles
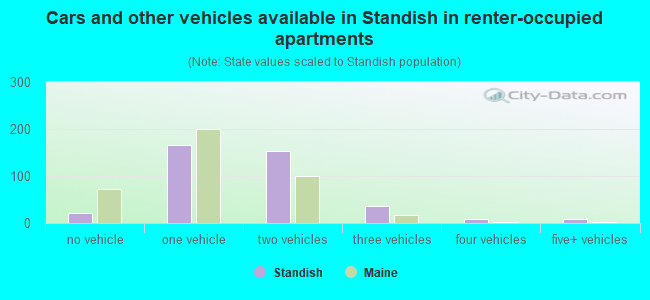
- Cars and other vehicles available in Standish in renter-occupied apartments
- 22no vehicle
- 1651 vehicle
- 1542 vehicles
- 363 vehicles
- 84 vehicles
- 85+ vehicles
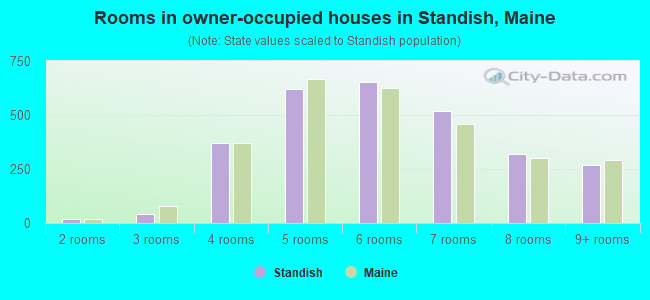
- Rooms in owner-occupied houses in Standish, Maine
- 01 room
- 182 rooms
- 433 rooms
- 3704 rooms
- 6205 rooms
- 6536 rooms
- 5197 rooms
- 3218 rooms
- 2689+ rooms
- Rooms in renter-occupied apartments in Standish, Maine
- 111 room
- 02 rooms
- 903 rooms
- 1004 rooms
- 895 rooms
- 396 rooms
- 327 rooms
- 188 rooms
- 149+ rooms
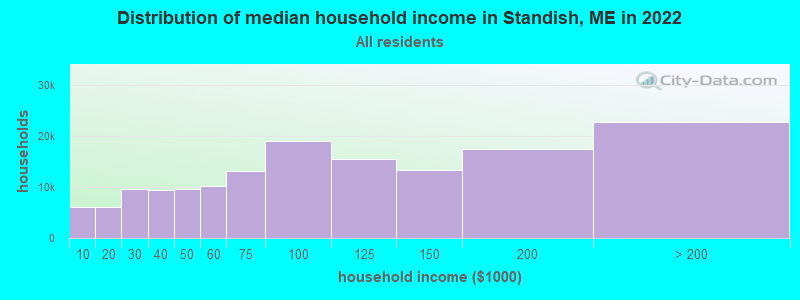
Standish, ME household income distribution

- 6,052Less than $10,000
- 6,122$10,000 to $19,999
- 9,499$20,000 to $29,999
- 9,324$30,000 to $39,999
- 9,627$40,000 to $49,999
- 10,218$50,000 to $59,999
- 13,171$60,000 to $74,999
- 18,972$75,000 to $99,999
- 15,472$100,000 to $124,999
- 13,331$125,000 to $149,999
- 17,465$150,000 to $199,999
- 22,677$200,000 or more
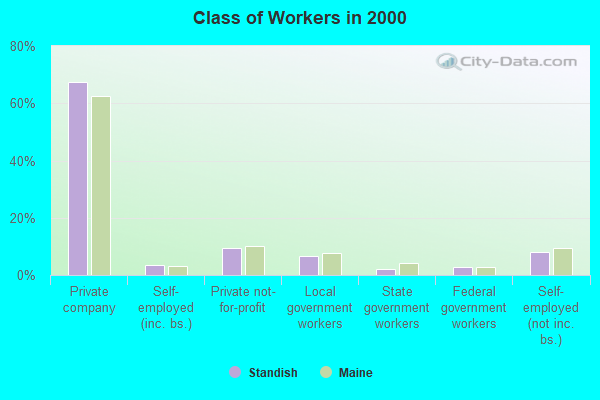
Percentage of workers working in this county: 90.8%
Number of people working at home: 1,350 (22.1% of all workers)
Travel time to work (commute)
- Less than 5 minutes: 181
- 5 to 9 minutes: 288
- 10 to 14 minutes: 406
- 15 to 19 minutes: 287
- 20 to 24 minutes: 437
- 25 to 29 minutes: 273
- 30 to 34 minutes: 1,028
- 35 to 39 minutes: 575
- 40 to 44 minutes: 633
- 45 to 59 minutes: 505
- 60 to 89 minutes: 207
- 90 or more minutes: 85
Means of transportation to work:
- Drove a car alone: 4,186 (82.8%)
- Carpooled: 512 (10.1%)
- Motorcycle: 10 (0.2%)
- Walked: 197 (3.9%)
- Worked at home: 153 (3.0%)
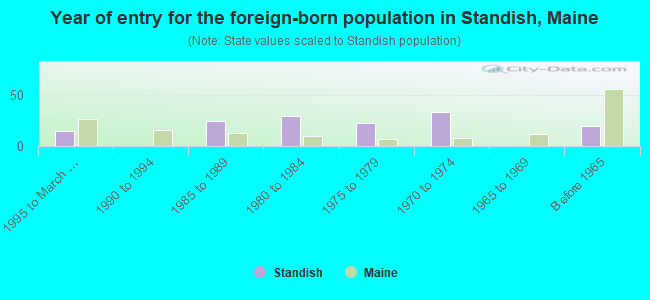
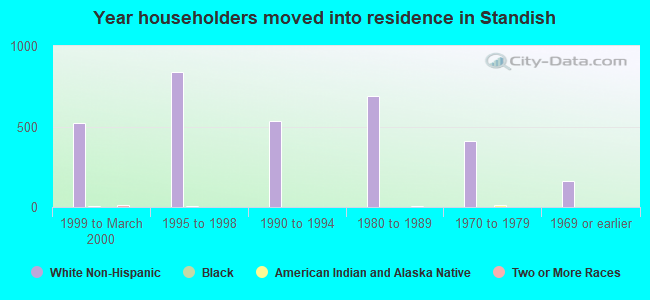
- Year of entry for the foreign-born population in Standish, Maine
- 151995 to March 2000
- 01990 to 1994
- 251985 to 1989
- 301980 to 1984
- 231975 to 1979
- 341970 to 1974
- 01965 to 1969
- 20Before 1965
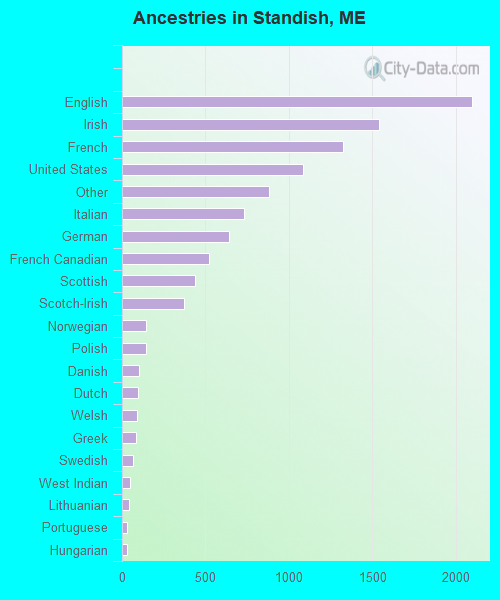
First ancestries reported:
- English: 2,093 (19.9%)
- Irish: 1,538 (14.6%)
- French: 1,326 (12.6%)
- United States: 1,084 (10.3%)
- Other: 883 (8.4%)
- Italian: 733 (7.0%)
- German: 639 (6.1%)
- French Canadian: 522 (5.0%)
- Scottish: 437 (4.1%)
- Scotch-Irish: 370 (3.5%)
- Norwegian: 145 (1.4%)
- Polish: 143 (1.4%)
- Danish: 102 (1.0%)
- Dutch: 97 (0.9%)
- Welsh: 88 (0.8%)
- Greek: 85 (0.8%)
- Swedish: 64 (0.6%)
- West Indian: 50 (0.5%)
- Lithuanian: 42 (0.4%)
- Portuguese: 28 (0.3%)
- Hungarian: 27 (0.3%)
- Ukrainian: 16 (0.2%)
- Czech: 15 (0.1%)
- Russian: 15 (0.1%)
Most common places of birth for foreign-born residents (%):
| Standish: | 34.0% (50) |
| Maine: | 41.4% (15,199) |
| Standish: | 20.4% (30) |
| Maine: | 0.1% (30) |
| Standish: | 13.6% (20) |
| Maine: | 5.9% (2,150) |
| Standish: | 6.8% (10) |
| Maine: | 0.3% (118) |
| Standish: | 6.1% (9) |
| Maine: | 1.1% (412) |
| Standish: | 6.1% (9) |
| Maine: | 1.5% (565) |
| Standish: | 4.8% (7) |
| Maine: | 0.5% (201) |
| Standish: | 4.1% (6) |
| Maine: | 7.8% (2,856) |
| Standish: | 4.1% (6) |
| Maine: | 3.0% (1,095) |
Place of birth for U.S.-born residents:
- This state: 6,743
- Other state: 2,330
- Northeast: 1,690
- Midwest: 267
- South: 209
- West: 164
58% of Standish residents lived in the same house 5 years ago.
Out of people who lived in different houses, 56% lived in this county.
Out of people who lived in different counties, 57% lived in Maine.
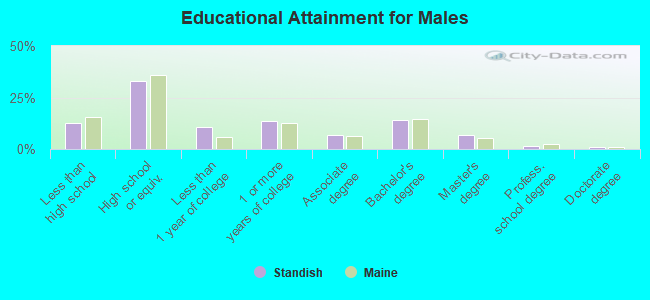
Education attainment for males 25 years and older:
- No schooling: 23
- Nursery to 4th grade: 0
- 5th and 6th grade: 6
- 7th and 8th grade: 103
- 9th grade: 50
- 10th grade: 49
- 11th grade: 83
- 12th grade, no diploma: 26
- High school graduate (or equivalency): 910
- Less than 1 year of college: 291
- Some college more than 1 year, no degree: 372
- Associate degree: 187
- Bachelor's degree: 385
- Master's degree: 189
- Professional school degree: 44
- Doctorate degree: 21
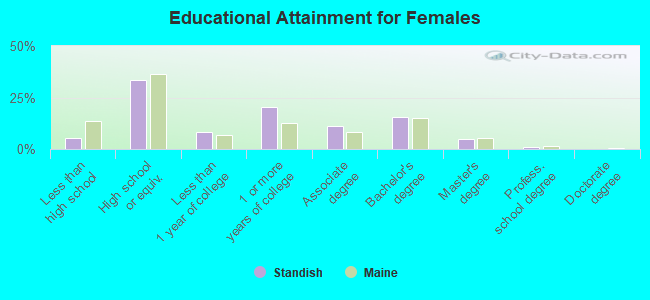
Education attainment for females 25 years and older:
- No schooling: 0
- Nursery to 4th grade: 0
- 5th and 6th grade: 0
- 7th and 8th grade: 17
- 9th grade: 30
- 10th grade: 26
- 11th grade: 60
- 12th grade, no diploma: 25
- High school graduate (or equivalency): 991
- Less than 1 year of college: 247
- Some college more than 1 year, no degree: 598
- Associate degree: 331
- Bachelor's degree: 460
- Master's degree: 138
- Professional school degree: 26
- Doctorate degree: 7


Housing units in structures:
- One, detached: 3,345
- One, attached: 22
- Two: 82
- 3 or 4: 54
- 5 to 9: 22
- Mobile homes: 462
Median worth of mobile homes: $103,495
Housing units lacking complete kitchen facilities: 1.7%
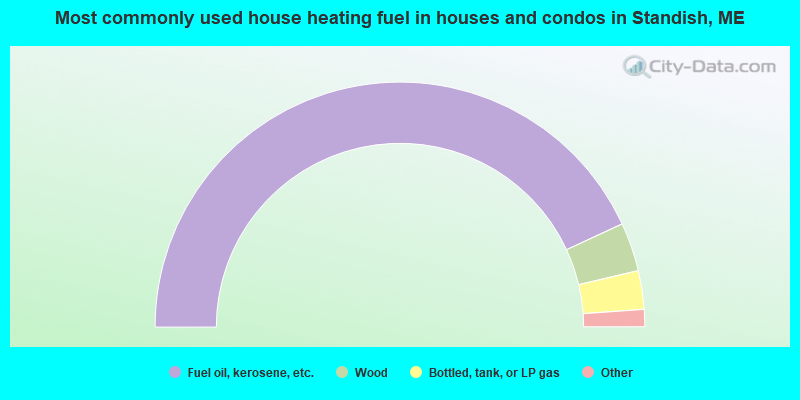
- 86.2%Fuel oil, kerosene, etc.
- 6.4%Wood
- 5.1%Bottled, tank, or LP gas
- 1.7%Electricity
- 0.4%Coal or coke
- 0.2%Utility gas
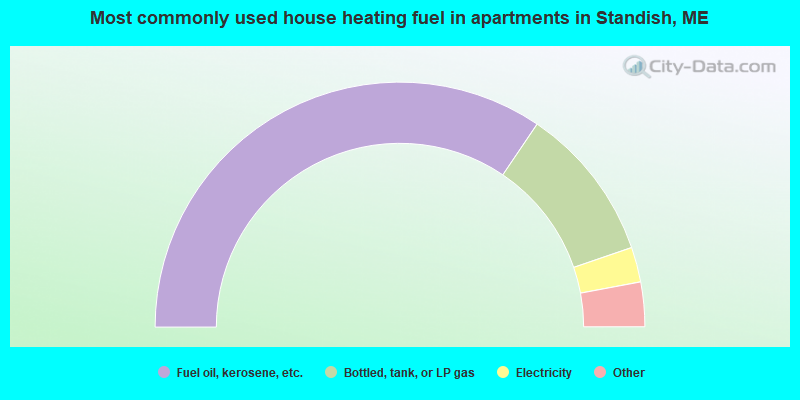
- 69.0%Fuel oil, kerosene, etc.
- 20.6%Bottled, tank, or LP gas
- 4.6%Electricity
- 3.8%Wood
- 2.0%Utility gas
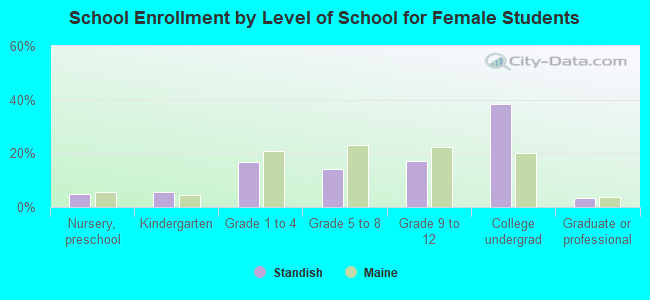
Private vs. public school enrollment:
| Here: | 7.5% |
| Maine: | 6.9% |
| Here: | 11.6% |
| Maine: | 8.9% |
| Here: | 64.4% |
| Maine: | 28.3% |