Statesville, NC (North Carolina) Houses and Residents
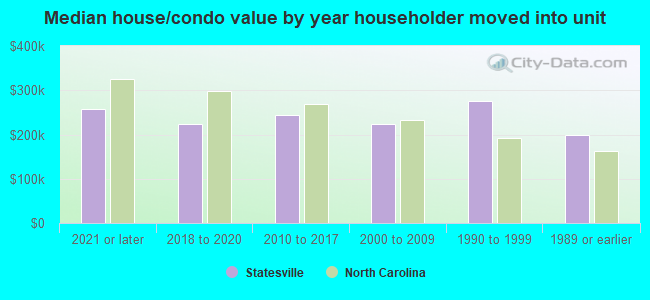
| Statesville: | $256,853 |
| North Carolina: | $280,600 |
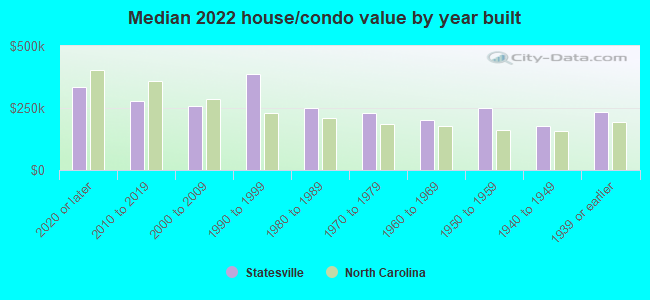
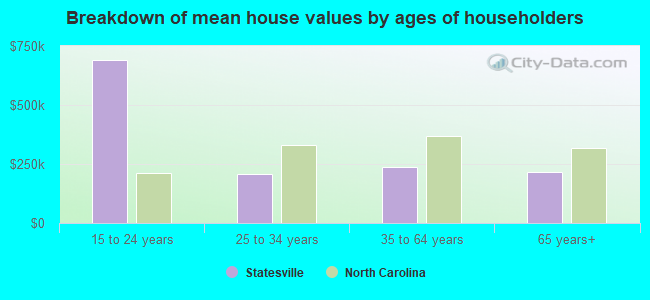
Mean price in 2022:
Detached houses: $244,614
Here: $244,614 State: $375,326 Townhouses or other attached units: $291,853
Here: $291,853 State: $317,935 In 2-unit structures: $102,441
Here: $102,441 State: $250,488 In 5-or-more-unit structures: $230,022
Here: $230,022 State: $329,290 Mobile homes: $97,354
Here: $97,354 State: $124,933
Total population: 25,722 (Urban population: 22,488 (all inside urban clusters), Rural population: 534 (22 farm, 512 nonfarm))
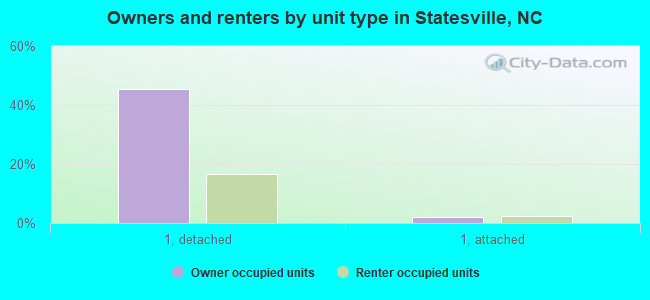
Houses: 13,195 (11,920 occupied: 6,468 owner occupied, 5,254 renter occupied)
| % of renters here: | 45% |
| State: | 33% |
Housing density: 643 houses/condos per square mile
Median price asked for vacant for-sale houses and condos in 2022: $108,338.
Median contract rent in 2022: $720 (lower quartile is $515, upper quartile is $853)
Median rent asked for vacant for-rent units in 2022: $1,700
Median gross rent in Statesville, NC in 2022: $835
Housing units in Statesville with a mortgage: 4,340 (440 second mortgage, 60 home equity loan, 399 both second mortgage and home equity loan)
Houses without a mortgage: 270
Median household income for houses/condos with a mortgage: $83,409
Median household income for apartments without a mortgage: $65,104
Median monthly housing costs: $938
Compare current foreclosures in Statesville, NC:
| Photo | Address | Area | Beds / Baths | Price | Details |
|---|---|---|---|---|---|

|
#1
Big Forest Dr
Statesville, NC 28677
|
1,428 sq. feet
|
2 baths 3 beds |
show details | |

|
#2
Wood St
Statesville, NC 28677
|
1,304 sq. feet
|
1 baths 3 beds |
show details | |

|
#3
Eufola Rd
Statesville, NC 28677
|
792 sq. feet
|
1 baths 2 beds |
show details | |

|
#4
Porter Rd
Statesville, NC 28625
|
1,593 sq. feet
|
1 baths 3 beds |
show details | |

|
#5
Queens Ct
Statesville, NC 28677
|
1,570 sq. feet
|
2 baths 3 beds |
show details | |

|
#6
Wilkesboro Hwy
Statesville, NC 28625
|
1,152 sq. feet
|
2 baths 3 beds |
show details | |

|
#7
Hope St
Statesville, NC 28677
|
832 sq. feet
|
1 baths 2 beds |
show details | |

|
#8
Clearview Rd
Statesville, NC 28625
|
1,313 sq. feet
|
1 baths 3 beds |
show details | |

|
#9
Belle Terre Rd
Statesville, NC 28625
|
1,851 sq. feet
|
2 baths 4 beds |
show details | |

|
#10
Bethesda Rd
Statesville, NC 28677
|
2,128 sq. feet
|
2 baths 4 beds |
show details |
| Photo | Address | Area | Beds / Baths | Price | Details |
|---|---|---|---|---|---|

|
#11
History Ln
Statesville, NC 28677
|
2,205 sq. feet
|
2 baths 4 beds |
show details | |

|
#12
Sherwood Ln
Statesville, NC 28677
|
3,102 sq. feet
|
3 baths 4 beds |
show details | |

|
#13
Wall St
Statesville, NC 28677
|
1,203 sq. feet
|
1 baths 3 beds |
show details | |

|
#14
Edenderry Dr
Statesville, NC 28625
|
2,136 sq. feet
|
2 baths 4 beds |
show details | |

|
#15
Thompson Ln
Statesville, NC 28625
|
2,168 sq. feet
|
2 baths 3 beds |
show details | |

|
#16
Westwood Dr
Statesville, NC 28677
|
1,015 sq. feet
|
1 baths 2 beds |
show details | |

|
#17
Ravencrest Dr
Statesville, NC 28625
|
2,004 sq. feet
|
2 baths 3 beds |
show details | |

|
#18
Rumple Hill Dr
Statesville, NC 28677
|
1,795 sq. feet
|
2 baths 3 beds |
show details | |

|
#19
Amity Hill Rd
Statesville, NC 28677
|
1,344 sq. feet
|
2 baths 3 beds |
show details | |

|
#20
Skyuka Rd
Statesville, NC 28677
|
1,624 sq. feet
|
2 baths 3 beds |
show details |
| Photo | Address | Area | Beds / Baths | Price | Details |
|---|---|---|---|---|---|

|
#21
Boulder Pl
Statesville, NC 28625
|
1,058 sq. feet
|
2 baths 3 beds |
show details | |

|
#22
Island Ford Rd
Statesville, NC 28625
|
1,100 sq. feet
|
1 baths 2 beds |
show details | |

|
#23
Hatford Ct
Statesville, NC 28625
|
1,668 sq. feet
|
2 baths 3 beds |
show details | |

|
#24
Little Farm Rd
Statesville, NC 28625
|
1,904 sq. feet
|
2 baths 3 beds |
show details | |

|
#25
S Carolina Ave
Statesville, NC 28677
|
1,726 sq. feet
|
2 baths 3 beds |
show details | |

|
#26
N Oak St
Statesville, NC 28677
|
2,241 sq. feet
|
2 baths 3 beds |
show details | |

|
#27
Big Forest Dr
Statesville, NC 28677
|
1,428 sq. feet
|
2 baths 3 beds |
show details | |

|
#28
Antietam Rd
Statesville, NC 28625
|
1,767 sq. feet
|
2 baths 3 beds |
show details | |

|
#29
Fines Creek Dr
Statesville, NC 28625
|
3,442 sq. feet
|
2 baths 4 beds |
show details | |

|
#30
Wall St
Statesville, NC 28677
|
1,512 sq. feet
|
2 baths 3 beds |
show details |
| Photo | Address | Area | Beds / Baths | Price | Details |
|---|---|---|---|---|---|

|
#31
S Mulberry St
Statesville, NC 28677
|
4,153 sq. feet
|
3 baths 4 beds |
show details | |

|
#32
Northmont Dr
Statesville, NC 28625
|
2,958 sq. feet
|
2 baths 3 beds |
show details | |

|
#33
Red Walnut Dr
Statesville, NC 28677
|
1,568 sq. feet
|
2 baths 3 beds |
show details | |

|
#34
Camelot Dr
Statesville, NC 28625
|
2,411 sq. feet
|
2 baths 3 beds |
show details | |

|
#35
Turnersburg Hwy
Statesville, NC 28625
|
1,232 sq. feet
|
1 baths 3 beds |
show details | |

|
#36
Brady Circle Rd
Statesville, NC 28625
|
1,408 sq. feet
|
2 baths 3 beds |
show details | |

|
#37
Stoneybrook Rd
Statesville, NC 28677
|
4,013 sq. feet
|
3 baths 3 beds |
show details | |

|
#38
Watts Meadow Dr
Statesville, NC 28677
|
993 sq. feet
|
1 baths 2 beds |
show details | |

|
#39
Upper Oak Dr
Statesville, NC 28625
|
1,902 sq. feet
|
2 baths 3 beds |
show details | |

|
#40
Park St
Statesville, NC 28677
|
1,024 sq. feet
|
1 baths 2 beds |
show details |
| Photo | Address | Area | Beds / Baths | Price | Details |
|---|---|---|---|---|---|

|
#41
Wilkesboro Hwy
Statesville, NC 28625
|
1,826 sq. feet
|
2 baths 3 beds |
show details | |

|
#42
Bridge Mill Ct
Statesville, NC 28625
|
1,404 sq. feet
|
2 baths 3 beds |
show details | |

|
#43
Antler Dr
Statesville, NC 28625
|
1,288 sq. feet
|
2 baths 3 beds |
show details | |

|
#44
Elmwood Rd
Statesville, NC 28625
|
1,560 sq. feet
|
2 baths 3 beds |
show details | |

|
#45
Country View Rd
Statesville, NC 28625
|
1,482 sq. feet
|
2 baths 3 beds |
show details | |

|
#46
Hannah Rd
Statesville, NC 28625
|
1,050 sq. feet
|
1 baths 3 beds |
show details | |

|
#47
Berkshire Dr
Statesville, NC 28677
|
1,984 sq. feet
|
2 baths 4 beds |
show details | |

|
#48
Turnersburg Hwy
Statesville, NC 28625
|
1,962 sq. feet
|
1 baths 4 beds |
show details | |

|
#49
Farmview Ln
Statesville, NC 28625
|
1,576 sq. feet
|
2 baths 3 beds |
show details | |

|
Check over 1 million property listings on Foreclosure.com!
|
browse all offers | |||

Latest news about housing in Statesville, NC collected exclusively by city-data.com from local newspapers, TV, and radio stations

 | Statesville "apartments/rentals/condo's" (0 replies) |
| Homestar Light Industrial establish its North American headquarters in Statesville (0 replies) |
| Real Estate Market Devastation (18 replies) |
| Boat slip rentals on LKN (not marinas)? (10 replies) |
| Moving to Statesville NC (6 replies) |
| Moving to Statesville (4 replies) |
Median year apartment built: 1984
Household type by relationship:
Households: 29,801- Male householders: 5,191 (1,485 living alone), Female householders: 6,697 (2,350 living alone)
4,613 spouses (4,559 opposite-sex spouses), 697 unmarried partners, (661 opposite-sex unmarried partners), 8,597 children (8,132 natural, 66 adopted, 398 stepchildren), 936 grandchildren, 509 brothers or sisters, 417 parents, 15 foster children, 455 other relatives, 491 non-relatives
- In group quarters: 1,177
Size of family households: 3,716 2-persons, 1,156 3-persons, 1,376 4-persons, 717 5-persons, 210 6-persons, 50 7-or-more-persons.
Size of nonfamily households: 4,144 1-person, 530 2-persons, 5 3-persons, 27 4-persons.
3,790 married couples with children.
1,954 single-parent households (593 men, 1,361 women).
82.4% of residents of Statesville speak English at home.
12.7% of residents speak Spanish at home (53% speak English very well, 24% speak English well, 13% speak English not well, 10% don't speak English at all).
1.5% of residents speak other Indo-European language at home (64% speak English very well, 16% speak English well, 21% speak English not well).
1.6% of residents speak Asian or Pacific Island language at home (72% speak English very well, 25% speak English well, 2% speak English not well).
2.0% of residents speak other language at home (12% speak English very well, 25% speak English well, 19% speak English not well, 44% don't speak English at all).
Foreign born population: 3,096 (10.4%)
(37.6% of them are naturalized citizens)
| Here: | 6.4 |
| State: | 6.4 |
| Here: | 4.1 |
| State: | 4.4 |
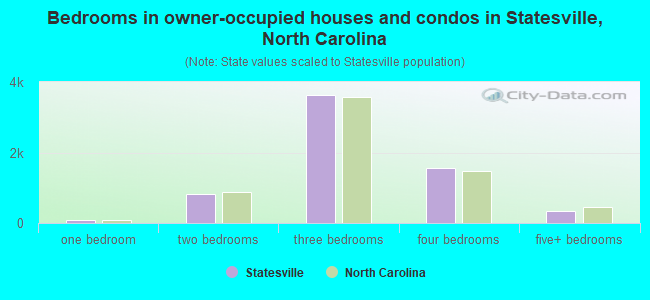
- Bedrooms in owner-occupied houses and condos in Statesville, North Carolina
- 0no bedroom
- 981 bedroom
- 8222 bedrooms
- 3,6383 bedrooms
- 1,5684 bedrooms
- 3425+ bedrooms
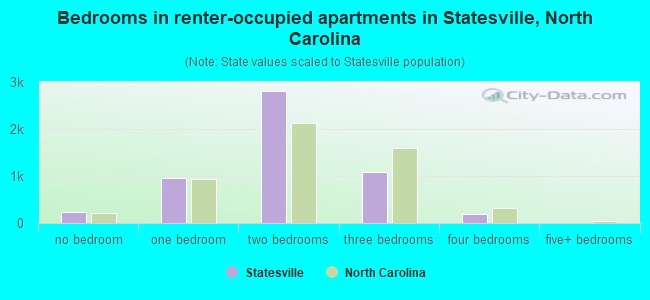
- Bedrooms in renter-occupied apartments in Statesville, North Carolina
- 227no bedroom
- 9571 bedroom
- 2,8002 bedrooms
- 1,0783 bedrooms
- 1924 bedrooms
- 05+ bedrooms
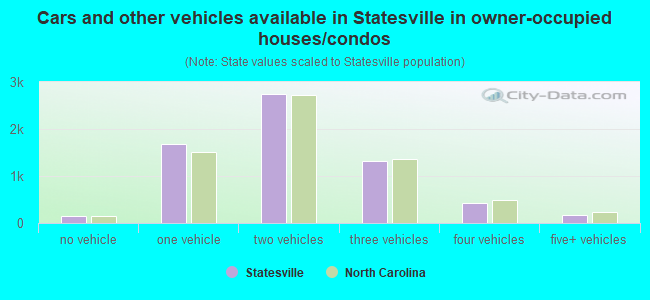
- Cars and other vehicles available in Statesville in owner-occupied houses/condos
- 140no vehicle
- 1,6811 vehicle
- 2,7402 vehicles
- 1,3113 vehicles
- 4224 vehicles
- 1755+ vehicles
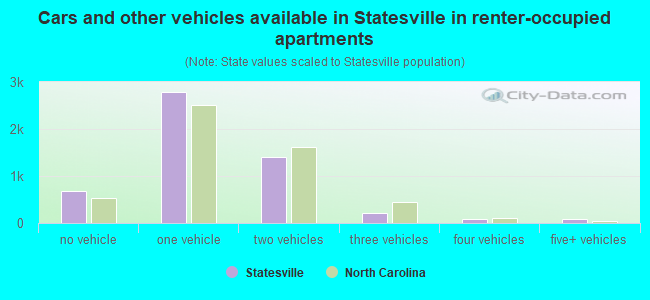
- Cars and other vehicles available in Statesville in renter-occupied apartments
- 679no vehicle
- 2,7931 vehicle
- 1,3992 vehicles
- 2213 vehicles
- 884 vehicles
- 755+ vehicles
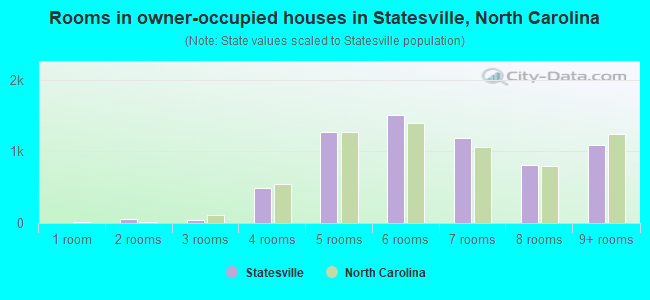
- Rooms in owner-occupied houses in Statesville, North Carolina
- 01 room
- 582 rooms
- 363 rooms
- 4934 rooms
- 1,2745 rooms
- 1,5106 rooms
- 1,1947 rooms
- 8178 rooms
- 1,0889+ rooms
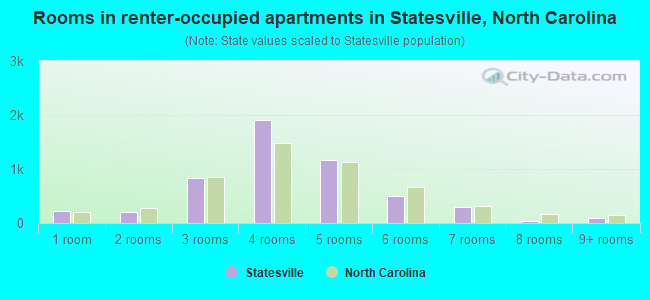
- Rooms in renter-occupied apartments in Statesville, North Carolina
- 2271 room
- 1962 rooms
- 8413 rooms
- 1,9074 rooms
- 1,1595 rooms
- 5046 rooms
- 2977 rooms
- 388 rooms
- 859+ rooms
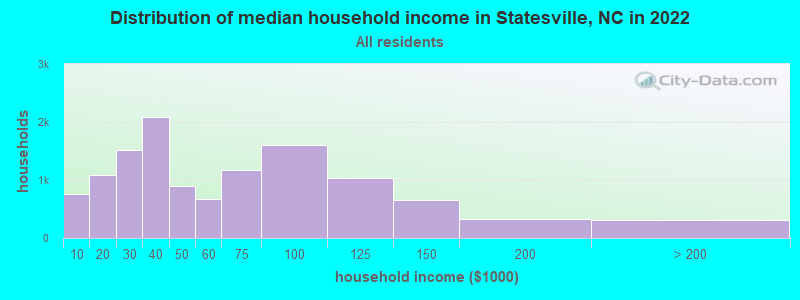
Statesville, NC household income distribution

- 752Less than $10,000
- 1,090$10,000 to $19,999
- 1,515$20,000 to $29,999
- 2,084$30,000 to $39,999
- 904$40,000 to $49,999
- 681$50,000 to $59,999
- 1,166$60,000 to $74,999
- 1,608$75,000 to $99,999
- 1,043$100,000 to $124,999
- 662$125,000 to $149,999
- 333$150,000 to $199,999
- 306$200,000 or more
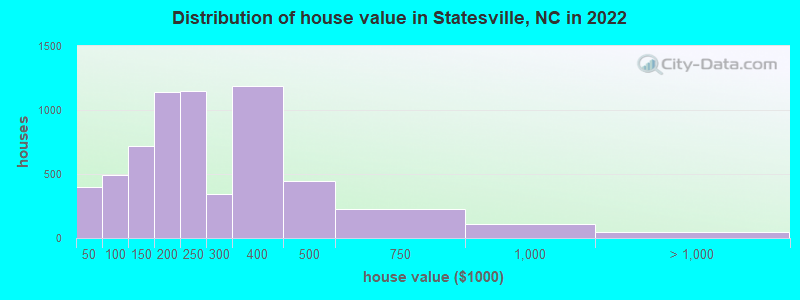
Home value of owner - occupied houses in 2022 in Statesville, NC
-
- 8Less than $10,000
- 73$10,000 to $14,999
- 22$15,000 to $19,999
- 130$20,000 to $24,999
- 29$25,000 to $29,999
- 8$30,000 to $34,999
- 62$35,000 to $39,999
- 63$40,000 to $49,999
- 94$50,000 to $59,999
- 80$60,000 to $69,999
- 93$70,000 to $79,999
- 51$80,000 to $89,999
- 111$90,000 to $99,999
- 282$100,000 to $124,999
- 435$125,000 to $149,999
- 862$150,000 to $174,999
- 277$175,000 to $199,999
- 1,149$200,000 to $249,999
- 340$250,000 to $299,999
- 1,185$300,000 to $399,999
- 444$400,000 to $499,999
- 223$500,000 to $749,999
- 106$750,000 to $999,999
- 43$1,000,000 to $1,499,999
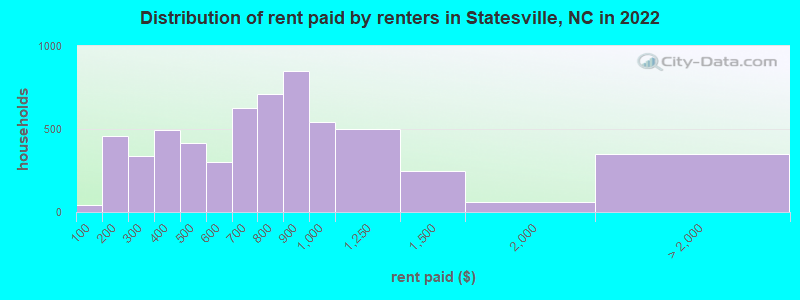
Rent paid by renters in 2022 in Statesville, NC
-
- 45Less than $100
- 410$100 to $149
- 44$150 to $199
- 93$200 to $249
- 246$250 to $299
- 301$300 to $349
- 192$350 to $399
- 146$400 to $449
- 268$450 to $499
- 116$500 to $549
- 187$550 to $599
- 403$600 to $649
- 220$650 to $699
- 437$700 to $749
- 271$750 to $799
- 851$800 to $899
- 542$900 to $999
- 501$1,000 to $1,249
- 250$1,250 to $1,499
- 61$1,500 to $1,999
- 95$2,000 to $2,499
- 89$3,000 to $3,499
- 14$3,500 or more
- 150No cash rent
Percentage of workers working in this county: 78.9%
Number of people working at home: 1,173 (8.6% of all workers)
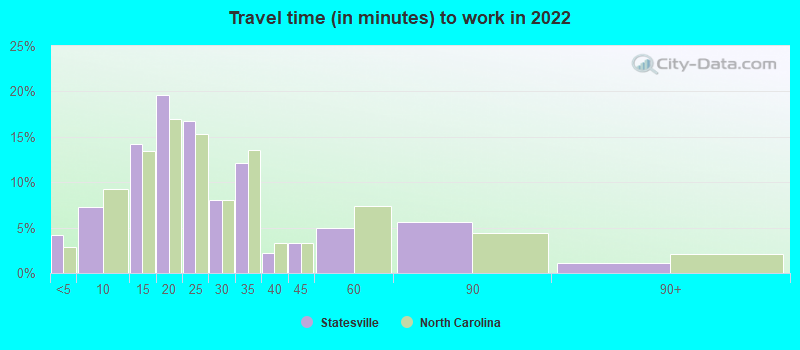
Travel time to work (commute)
- Less than 5 minutes: 789
- 5 to 9 minutes: 1,588
- 10 to 14 minutes: 1,759
- 15 to 19 minutes: 2,272
- 20 to 24 minutes: 1,419
- 25 to 29 minutes: 749
- 30 to 34 minutes: 1,344
- 35 to 39 minutes: 190
- 40 to 44 minutes: 309
- 45 to 59 minutes: 766
- 60 to 89 minutes: 459
- 90 or more minutes: 247
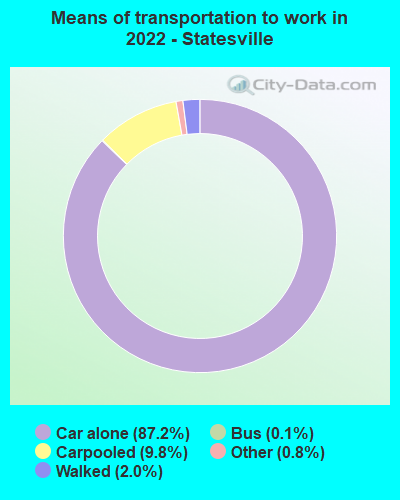
Means of transportation to work:
- Drove a car alone: 20,932 (80.8%)
- Carpooled: 2,214 (8.5%)
- Bus: 33 (0.1%)
- Subway or elevated rail: 1 (0.0%)
- Taxi: 188 (0.7%)
- Bicycle: 13 (0.1%)
- Walked: 395 (1.5%)
- Worked at home: 1,070 (4.1%)
- Unemployment by race in 2022
- Unemployment rate for White non-Hispanic residents
- 4.8%Males
- 1.3%Females
- Unemployment rate for Black residents
- 6.3%Males
- 12.0%Females
- Unemployment rate for American Indian and Alaska Native residents
- 60.8%Males
- Unemployment rate for Asian residents
- 43.7%Males
- Unemployment rate for other race residents
- 1.7%Males
- 3.0%Females
- Unemployment rate for two or more race residents
- 0.7%Males
- 2.4%Females
- Unemployment rate for Hispanic or Latino residents
- 3.1%Males
- 1.7%Females
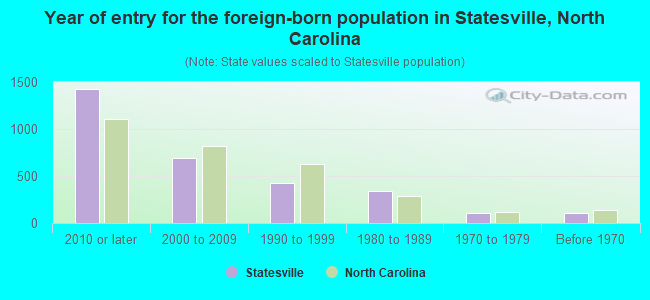
- Year of entry for the foreign-born population in Statesville, North Carolina
- 1,4272010 or later
- 6922000 to 2009
- 4281990 to 1999
- 3451980 to 1989
- 1021970 to 1979
- 102Before 1970
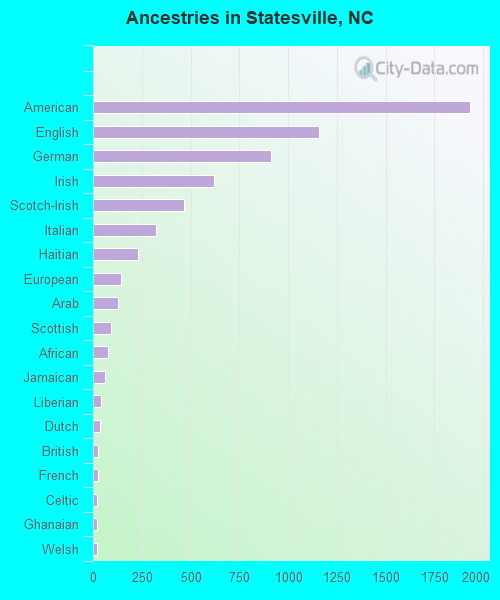
First ancestries reported:
- American: 1,933 (11.2%)
- English: 1,156 (6.7%)
- German: 911 (5.3%)
- Irish: 620 (3.6%)
- Scotch-Irish: 467 (2.7%)
- Italian: 324 (1.9%)
- Haitian: 232 (1.3%)
- European: 146 (0.8%)
- Arab: 126 (0.7%)
- Scottish: 91 (0.5%)
- African: 76 (0.4%)
- Jamaican: 61 (0.4%)
- Liberian: 40 (0.2%)
- Dutch: 38 (0.2%)
- British: 25 (0.1%)
- French: 24 (0.1%)
- Celtic: 20 (0.1%)
- Ghanaian: 20 (0.1%)
- Welsh: 19 (0.1%)
- Polish: 17 (0.10%)
- Swedish: 15 (0.09%)
- Trinidadian and Tobagonian: 14 (0.08%)
- Scandinavian: 13 (0.08%)
- Slovak: 12 (0.07%)
- Moroccan: 11 (0.06%)
- Czechoslovakian: 11 (0.06%)
- Ukrainian: 11 (0.06%)
- Eastern European: 10 (0.06%)
- Portuguese: 9 (0.05%)
- Austrian: 7 (0.04%)
- Norwegian: 5 (0.03%)
- Russian: 5 (0.03%)
- Lebanese: 4 (0.02%)
- Iranian: 4 (0.02%)
- French Canadian: 3 (0.02%)
Most common places of birth for foreign-born residents (%):
| Statesville: | 27.6% (811) |
| North Carolina: | 24.7% (214,776) |
| Statesville: | 12.2% (359) |
| North Carolina: | 9.3% (80,594) |
| Statesville: | 11.4% (336) |
| North Carolina: | 0.2% (1,937) |
| Statesville: | 9.5% (278) |
| North Carolina: | 1.2% (9,986) |
| Statesville: | 6.8% (201) |
| North Carolina: | 2.1% (18,275) |
| Statesville: | 6.3% (185) |
| North Carolina: | 0.5% (4,128) |
| Statesville: | 5.8% (170) |
| North Carolina: | 3.8% (33,379) |
| Statesville: | 4.7% (137) |
| North Carolina: | 0.6% (4,983) |
| Statesville: | 3.8% (111) |
| North Carolina: | 2.6% (22,964) |
| Statesville: | 3.3% (98) |
| North Carolina: | 0.6% (5,018) |
| Statesville: | 1.6% (47) |
| North Carolina: | 0.4% (3,587) |
Place of birth for U.S.-born residents:
- This state: 17,517
- Other state: 8,972
- Northeast: 3,472
- Midwest: 1,685
- South: 3,012
- West: 698
86.2% of Statesville residents lived in the same house 1 years ago.
Out of people who lived in different houses, 40.5% lived in this county.
Out of people who lived in different counties, 79.5% lived in North Carolina.
| Statesville: | 86.2% |
| State average: | 87.3% |
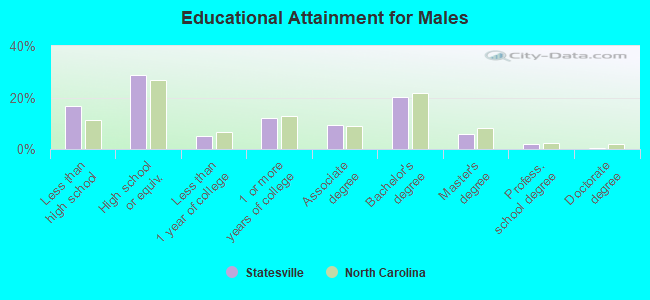
Education attainment for males 25 years and older:
- No schooling: 332
- Nursery to 4th grade: 203
- 5th and 6th grade: 87
- 7th and 8th grade: 100
- 9th grade: 155
- 10th grade: 258
- 11th grade: 303
- 12th grade, no diploma: 185
- High school graduate (or equivalency): 2,755
- Less than 1 year of college: 496
- Some college more than 1 year, no degree: 1,163
- Associate degree: 886
- Bachelor's degree: 1,944
- Master's degree: 563
- Professional school degree: 185
- Doctorate degree: 26
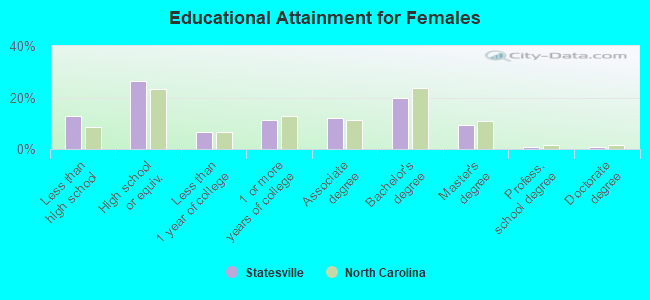
Education attainment for females 25 years and older:
- No schooling: 311
- Nursery to 4th grade: 154
- 5th and 6th grade: 130
- 7th and 8th grade: 75
- 9th grade: 185
- 10th grade: 223
- 11th grade: 176
- 12th grade, no diploma: 143
- High school graduate (or equivalency): 2,858
- Less than 1 year of college: 736
- Some college more than 1 year, no degree: 1,243
- Associate degree: 1,308
- Bachelor's degree: 2,164
- Master's degree: 1,009
- Professional school degree: 99
- Doctorate degree: 70
Housing units in structures:
- One, detached: 8,922
- One, attached: 807
- Two: 215
- 3 or 4: 1,099
- 5 to 9: 1,069
- 10 to 19: 558
- 20 to 49: 234
- 50 or more: 151
- Mobile homes: 100
- Boats, RVs, vans, etc.: 36
Housing units lacking complete kitchen facilities in 2022: 2.1%
House/condo owner moved in on average 9 years ago
Renter moved in on average 6 years ago
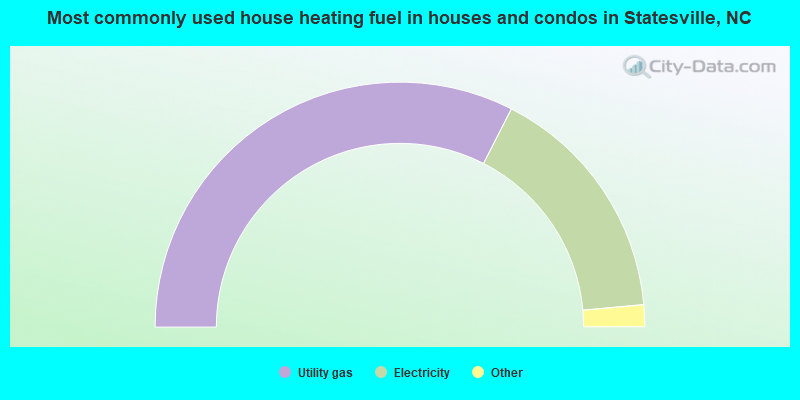
- 65.1%Utility gas
- 32.1%Electricity
- 1.2%Bottled, tank, or LP gas
- 0.8%Fuel oil, kerosene, etc.
- 0.4%Wood
- 0.4%No fuel used
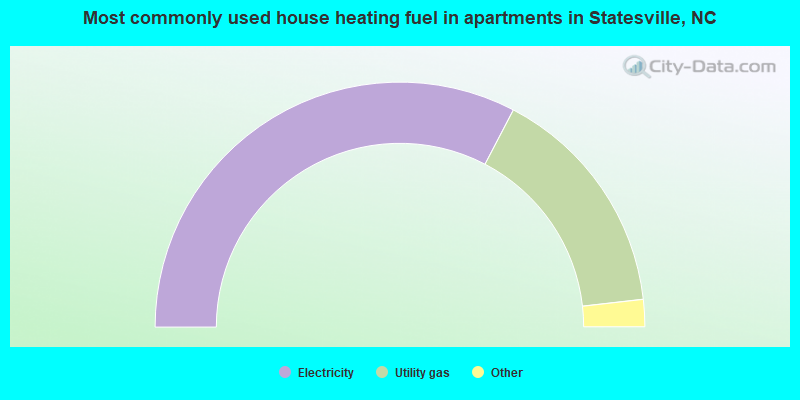
- 65.4%Electricity
- 31.1%Utility gas
- 1.8%Bottled, tank, or LP gas
- 1.0%Wood
- 0.8%Fuel oil, kerosene, etc.
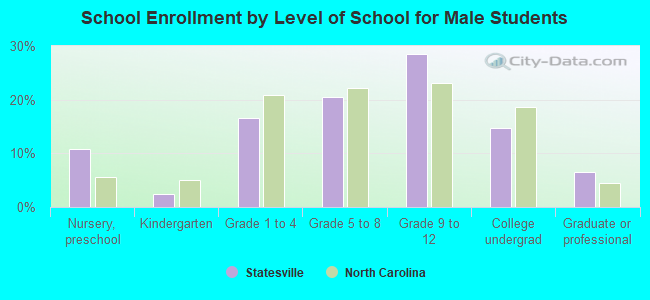
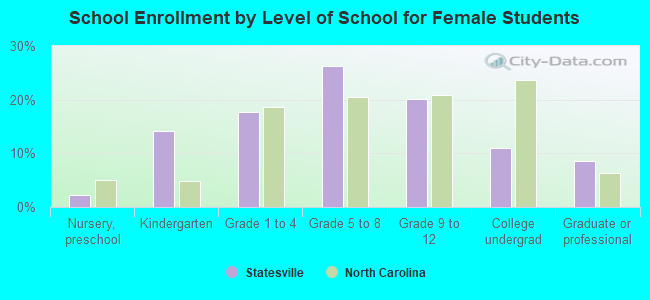
Private vs. public school enrollment:
| Here: | 11.9% |
| North Carolina: | 13.8% |
| Here: | 8.8% |
| North Carolina: | 11.9% |
| Here: | 27.1% |
| North Carolina: | 19.3% |