Sterling Heights, MI (Michigan) Houses and Residents
Estimated median house or condo value in 2022: $272,900 (it was $157,800 in 2000 )
Sterling Heights:
$272,900Michigan:
$224,400
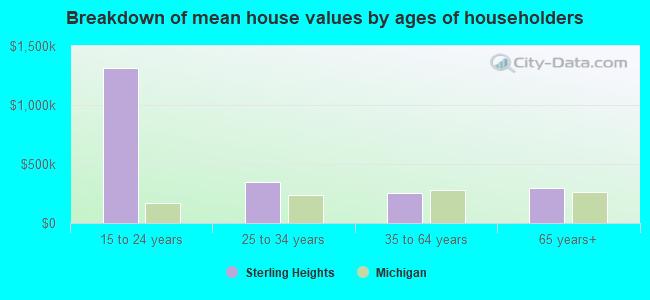
Lower value quartile - upper value quartile: $214,300 - $348,000Mean price in 2022: Detached houses: $321,142 Here:
$321,142State:
$280,038
Townhouses or other attached units: $223,277 Here:
$223,277State:
$239,520
In 3-to-4-unit structures: $214,226 Here:
$214,226State:
$207,067
In 5-or-more-unit structures: $220,902 Here:
$220,902State:
$192,733
Mobile homes: $45,332 Here:
$45,332State:
$72,868
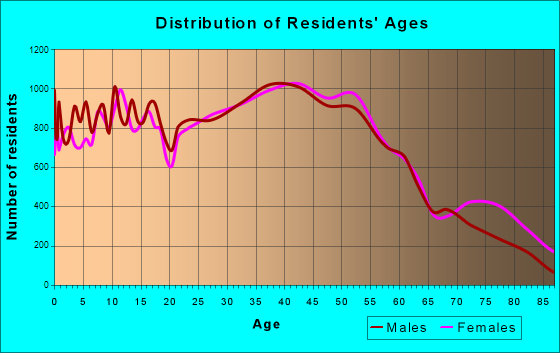
Total population: 131,741 (Urban population: 124,471, Rural population: 0)
Houses: 51,797 (49,804 occupied: 38,015 owner occupied, 11,789 renter occupied )
% of renters here:
24%State:
27%
Housing density: 1,414 houses/condos per square mile
Median price asked for vacant for-sale houses and condos in 2022: $213,439.
Median contract rent in 2022: $1,056 (lower quartile is $838, upper quartile is $1,457)
Median rent asked for vacant for-rent units in 2022: $3,102
Median gross rent in Sterling Heights, MI in 2022: $1,173
Housing units in Sterling Heights with a mortgage: 24,874 (2,276 second mortgage, 0 home equity loan, 1,947 both second mortgage and home equity loan )Houses without a mortgage: 1,224
Median household income for houses/condos with a mortgage: $104,872
Median household income for apartments without a mortgage: $68,254
Median monthly housing costs: $1,216
Data:
Median house or condo value ($)
Median house or condo value ($ change since 2000)
Median house or condo value ($) - White
Median house or condo value ($) - Black or African American
Median house or condo value ($) - Asian
Median house or condo value ($) - Hispanic or Latino
Median house or condo value ($) - American Indian and Alaska Native
Median house or condo value ($) - Multirace
Median house or condo value ($) - Other Race
Median price asked for mobile homes ($)
Household density (households per square mile)
Mean house or condo value by units in structure - 1, detached ($)
Mean house or condo value by units in structure - 1, attached ($)
Mean house or condo value by units in structure - 2 ($)
Mean house or condo value by units in structure by units in structure - 3 or 4 ($)
Mean house or condo value by units in structure - 5 or more ($)
Mean house or condo value by units in structure - Boat, RV, van, etc. ($)
Mean house or condo value by units in structure - Mobile home ($)
Median contract rent ($)
Median contract rent - Lower quartile ($)
Median contract rent - Upper quartile ($)
Median gross rent ($)
Urban houses (%)
Rural houses (%)
Houses occupied (%)
Houses occupied (% change since 2000)
Houses owner occupied (%)
Houses owner occupied (% change since 2000)
Houses renter occupied (%)
Houses renter occupied (% change since 2000)
Vacant housing units - For rent (%)
Vacant housing units - For rent (% change since 2000)
Vacant housing units - For sale only (%)
Vacant housing units - For sale only (% change since 2000)
Vacant housing units - Rented or sold, not occupied (%)
Vacant housing units - Rented or sold, not occupied (% change since 2000)
Vacant housing units - For seasonal, recreational, or occasional use (%)
Vacant housing units - For seasonal, recreational, or occasional use (% change since 2000)
Vacant housing units - For migrant workers (%)
Vacant housing units - For migrant workers (% change since 2000)
Vacant housing units - Other vacant (%)
Vacant housing units - Other vacant (% change since 2000)
Median monthly housing costs ($)
Median household income for houses/condos with a mortgage ($)
Median household income for houses/condos without a mortgage ($)
Median household income ($)
Median household income ($) - White
Median household income ($) - Black or African American
Median household income ($) - Asian
Median household income ($) - Hispanic or Latino
Median household income ($) - American Indian and Alaska Native
Median household income ($) - Multirace
Median household income ($) - Other Race
Mortgage status - with mortgage (%)
Mortgage status - with second mortgage (%)
Mortgage status - with home equity loan (%)
Mortgage status - with both second mortgage and home equity loan (%)
Mortgage status - without a mortgage (%)
Median year house/condo built
Median year apartment built
Household type by relationship - Male householder living alone (%)
Household type by relationship - Male householder not living alone (%)
Household type by relationship - Female householder living alone (%)
Household type by relationship - Female householder not living alone (%)
Household type by relationship - Opposite-Sex spouse (%)
Household type by relationship - Same-Sex spouse (%)
Household type by relationship - Opposite-Sex unmarried partner (%)
Household type by relationship - Same-Sex unmarried partner (%)
Household type by relationship - In group quarters (%)
Size of family households - 2-person household (%)
Size of family households - 3-person household (%)
Size of family households - 4-person household (%)
Size of family households - 5-person household (%)
Size of family households - 6-person household (%)
Size of family households - 7-or-more-person household (%)
Size of nonfamily households - 1-person household (%)
Size of nonfamily households - 2-person household (%)
Size of nonfamily households - 3-person household (%)
Size of nonfamily households - 4-person household (%)
Size of nonfamily households - 5-person household (%)
Size of nonfamily households - 6-person household (%)
Size of nonfamily households - 7-or-moreperson household (%)
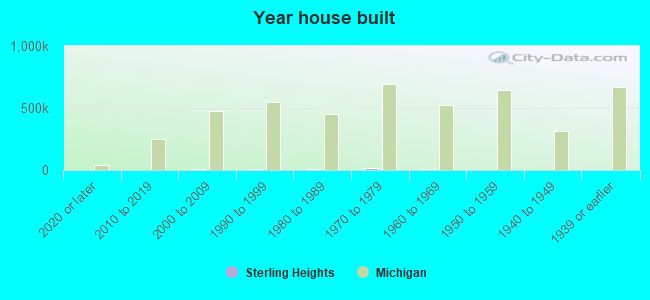
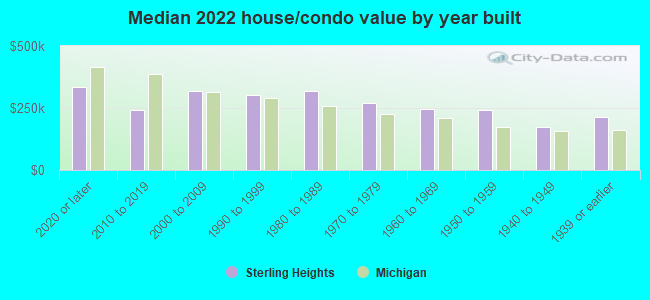
Year house built - Built 2010 or later (%)
Year house built - Built 2000 to 2009 (%)
Year house built - Built 1990 to 1999 (%)
Year house built - Built 1980 to 1989 (%)
Year house built - Built 1970 to 1979 (%)
Year house built - Built 1960 to 1969 (%)
Year house built - Built 1950 to 1959 (%)
Year house built - Built 1940 to 1949 (%)
Year house built - Built 1939 or earlier (%)
Median number of rooms in houses and condos
Median number of rooms in apartments
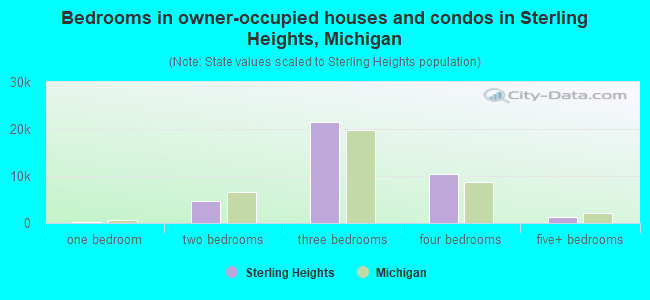
Median number of bedrooms in owner occupied houses
Mean number of bedrooms in owner occupied houses
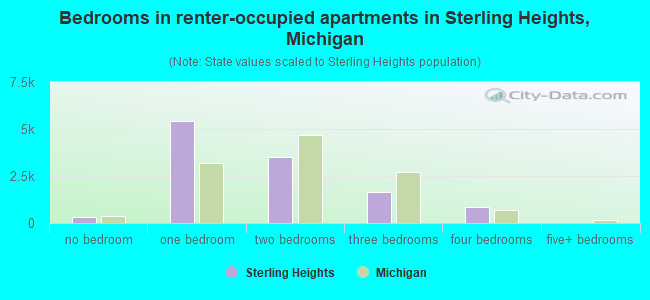
Median number of bedrooms in renter occupied houses
Mean number of bedrooms in renter occupied houses
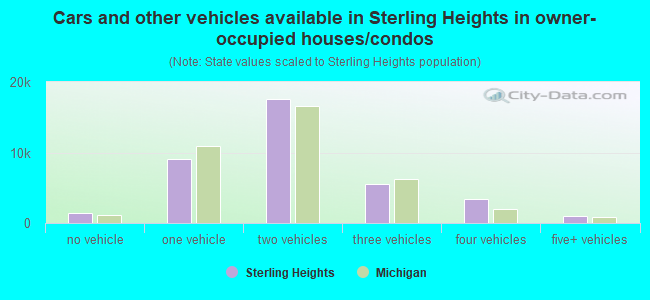
Median number of vehichles in owner occupied houses
Mean number of vehichles in owner occupied houses
Median number of vehichles in renter occupied houses
Mean number of vehichles in renter occupied houses
Rooms in owner-occupied houses - 1 room (%)
Rooms in owner-occupied houses - 2 rooms (%)
Rooms in owner-occupied houses - 3 rooms (%)
Rooms in owner-occupied houses - 4 rooms (%)
Rooms in owner-occupied houses - 5 rooms (%)
Rooms in owner-occupied houses - 6 rooms (%)
Rooms in owner-occupied houses - 7 rooms (%)
Rooms in owner-occupied houses - 8 rooms (%)
Rooms in owner-occupied houses - 9+ rooms (%)
Rooms in renter-occupied houses - 1 room (%)
Rooms in renter-occupied houses - 2 rooms (%)
Rooms in renter-occupied houses - 3 rooms (%)
Rooms in renter-occupied houses - 4 rooms (%)
Rooms in renter-occupied houses - 5 rooms (%)
Rooms in renter-occupied houses - 6 rooms (%)
Rooms in renter-occupied houses - 7 rooms (%)
Rooms in renter-occupied houses - 8 rooms (%)
Rooms in renter-occupied houses - 9+ rooms (%)
Bedrooms in owner-occupied houses - no bedrooms (%)
Bedrooms in owner-occupied houses - 1 bedroom (%)
Bedrooms in owner-occupied houses - 2 bedrooms (%)
Bedrooms in owner-occupied houses - 3 bedrooms (%)
Bedrooms in owner-occupied houses - 4 bedrooms (%)
Bedrooms in owner-occupied houses - 5+ bedrooms (%)
Bedrooms in renter-occupied houses - no bedrooms (%)
Bedrooms in renter-occupied houses - 1 bedroom (%)
Bedrooms in renter-occupied houses - 2 bedrooms (%)
Bedrooms in renter-occupied houses - 3 bedrooms (%)
Bedrooms in renter-occupied houses - 4 bedrooms (%)
Bedrooms in renter-occupied houses - 5+ bedrooms (%)
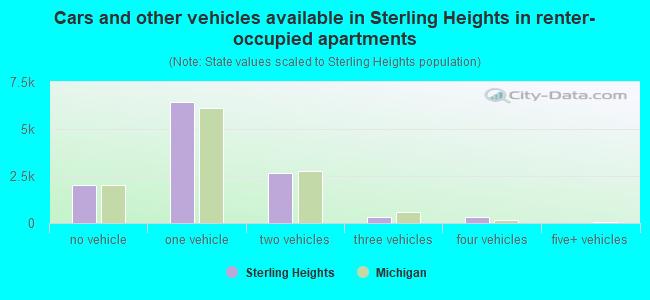
Vehicles available in owner-occupied houses - no vehicle available (%)
Vehicles available in owner-occupied houses - 1 vehicle available(%)
Vehicles available in owner-occupied houses - 2 Vehicles available (%)
Vehicles available in owner-occupied houses - 3 Vehicles available (%)
Vehicles available in owner-occupied houses - 4 Vehicles available (%)
Vehicles available in owner-occupied houses - 5+ Vehicles available (%)
Vehicles available in renter-occupied houses - no vehicle available (%)
Vehicles available in renter-occupied houses - 1 vehicle available (%)
Vehicles available in renter-occupied houses - 2 Vehicles available (%)
Vehicles available in renter-occupied houses - 3 Vehicles available (%)
Vehicles available in renter-occupied houses - 4 Vehicles available (%)
Vehicles available in renter-occupied houses - 5+ Vehicles available (%)
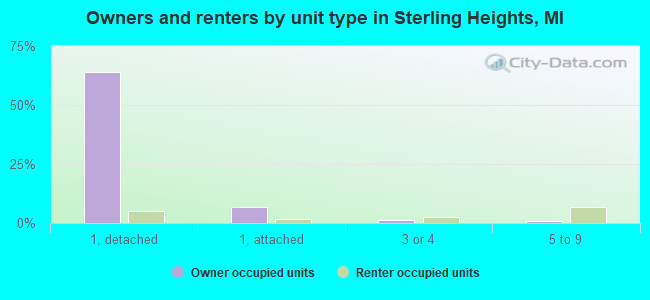
Housing units in structures - 1, detached (%)
Housing units in structures - 1, attached (%)
Housing units in structures - 2 (%)
Housing units in structures - 3 or 4 (%)
Housing units in structures - 5 to 9 (%)
Housing units in structures - 10 to 19 (%)
Housing units in structures - 20 to 49 (%)
Housing units in structures - 50 or more (%)
Housing units in structures - Mobile home (%)
Housing units in structures - Boat, RV, van, etc. (%)
Housing units in structures - Owners - 1, detached (%)
Housing units in structures - Owners - 1, attached (%)
Housing units in structures - Owners - 2 (%)
Housing units in structures - Owners - 3 or 4 (%)
Housing units in structures - Owners - 5 to 9 (%)
Housing units in structures - Owners - 10 to 19 (%)
Housing units in structures - Owners - 20 to 49 (%)
Housing units in structures - Owners - 50 or more (%)
Housing units in structures - Owners - Mobile home (%)
Housing units in structures - Owners - Boat, RV, van, etc. (%)
Housing units in structures - Renters - 1, detached (%)
Housing units in structures - Renters - 1, attached (%)
Housing units in structures - Renters - 2 (%)
Housing units in structures - Renters - 3 or 4 (%)
Housing units in structures - Renters - 5 to 9 (%)
Housing units in structures - Renters - 10 to 19 (%)
Housing units in structures - Renters - 20 to 49 (%)
Housing units in structures - Renters - 50 or more (%)
Housing units in structures - Renters - Mobile home (%)
Housing units in structures - Renters - Boat, RV, van, etc. (%)
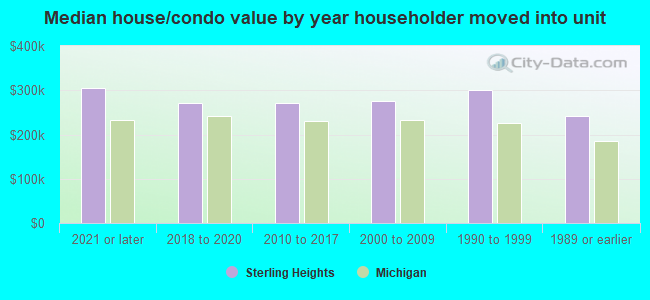
House/condo owner moved in on average (years ago)
Renter moved in on average (years ago)
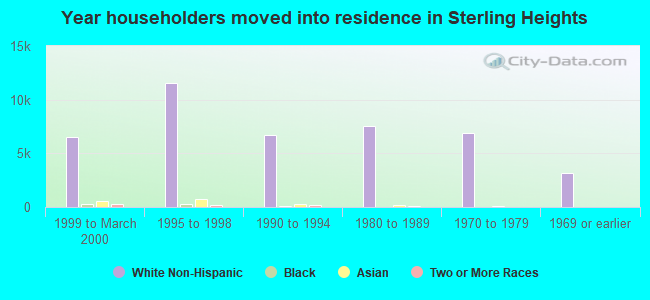
Year householder moved into unit - Moved in 1999 to March 2000 (%)
Year householder moved into unit - Moved in 1999 to March 2000 (%) - White
Year householder moved into unit - Moved in 1999 to March 2000 (%) - Black or African American
Year householder moved into unit - Moved in 1999 to March 2000 (%) - Asian
Year householder moved into unit - Moved in 1999 to March 2000 (%) - Hispanic or Latino
Year householder moved into unit - Moved in 1999 to March 2000 (%) - American Indian and Alaska Native
Year householder moved into unit - Moved in 1999 to March 2000 (%) - Multirace
Year householder moved into unit - Moved in 1999 to March 2000 (%) - Other Race
Year householder moved into unit - Moved in 1995 to 1998 (%)
Year householder moved into unit - Moved in 1995 to 1998 (%) - White
Year householder moved into unit - Moved in 1995 to 1998 (%) - Black or African American
Year householder moved into unit - Moved in 1995 to 1998 (%) - Asian
Year householder moved into unit - Moved in 1995 to 1998 (%) - Hispanic or Latino
Year householder moved into unit - Moved in 1995 to 1998 (%) - American Indian and Alaska Native
Year householder moved into unit - Moved in 1995 to 1998 (%) - Multirace
Year householder moved into unit - Moved in 1995 to 1998 (%) - Other Race
Year householder moved into unit - Moved in 1990 to 1994 (%)
Year householder moved into unit - Moved in 1990 to 1994 (%) - White
Year householder moved into unit - Moved in 1990 to 1994 (%) - Black or African American
Year householder moved into unit - Moved in 1990 to 1994 (%) - Asian
Year householder moved into unit - Moved in 1990 to 1994 (%) - Hispanic or Latino
Year householder moved into unit - Moved in 1990 to 1994 (%) - American Indian and Alaska Native
Year householder moved into unit - Moved in 1990 to 1994 (%) - Multirace
Year householder moved into unit - Moved in 1990 to 1994 (%) - Other Race
Year householder moved into unit - Moved in 1980 to 1989 (%)
Year householder moved into unit - Moved in 1980 to 1989 (%) - White
Year householder moved into unit - Moved in 1980 to 1989 (%) - Black or African American
Year householder moved into unit - Moved in 1980 to 1989 (%) - Asian
Year householder moved into unit - Moved in 1980 to 1989 (%) - Hispanic or Latino
Year householder moved into unit - Moved in 1980 to 1989 (%) - American Indian and Alaska Native
Year householder moved into unit - Moved in 1980 to 1989 (%) - Multirace
Year householder moved into unit - Moved in 1980 to 1989 (%) - Other Race
Year householder moved into unit - Moved in 1970 to 1979 (%)
Year householder moved into unit - Moved in 1970 to 1979 (%) - White
Year householder moved into unit - Moved in 1970 to 1979 (%) - Black or African American
Year householder moved into unit - Moved in 1970 to 1979 (%) - Asian
Year householder moved into unit - Moved in 1970 to 1979 (%) - Hispanic or Latino
Year householder moved into unit - Moved in 1970 to 1979 (%) - American Indian and Alaska Native
Year householder moved into unit - Moved in 1970 to 1979 (%) - Multirace
Year householder moved into unit - Moved in 1970 to 1979 (%) - Other Race
Year householder moved into unit - Moved in 1969 or earlier (%)
Year householder moved into unit - Moved in 1969 or earlier (%) - White
Year householder moved into unit - Moved in 1969 or earlier (%) - Black or African American
Year householder moved into unit - Moved in 1969 or earlier (%) - Asian
Year householder moved into unit - Moved in 1969 or earlier (%) - Hispanic or Latino
Year householder moved into unit - Moved in 1969 or earlier (%) - American Indian and Alaska Native
Year householder moved into unit - Moved in 1969 or earlier (%) - Multirace
Year householder moved into unit - Moved in 1969 or earlier (%) - Other Race
Housing units lacking complete plumbing facilities (%)
Housing units lacking complete kitchen facilities (%)
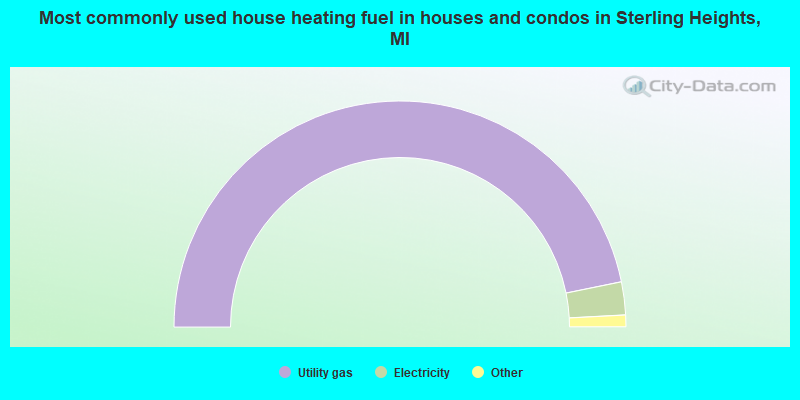
House heating fuel used in houses and condos - Utility gas (%)
House heating fuel used in houses and condos - Bottled, tank, or LP gas (%)
House heating fuel used in houses and condos - Electricity (%)
House heating fuel used in houses and condos - Fuel oil, kerosene, etc. (%)
House heating fuel used in houses and condos - Coal or coke (%)
House heating fuel used in houses and condos - Wood (%)
House heating fuel used in houses and condos - Solar energy (%)
House heating fuel used in houses and condos - Other fuel (%)
House heating fuel used in houses and condos - No fuel used (%)
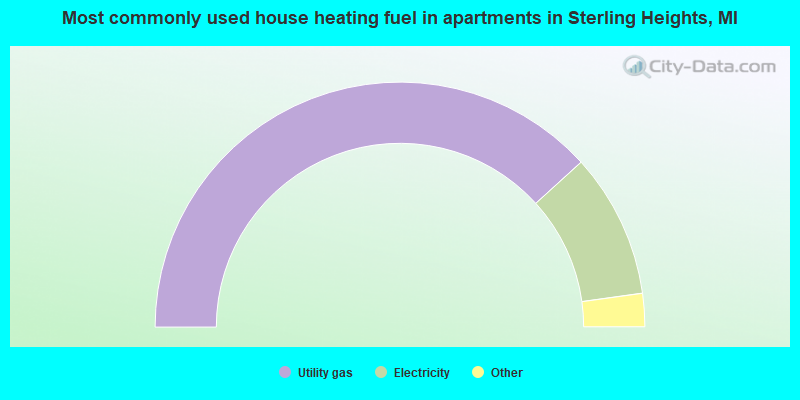
House heating fuel used in apartments - Utility gas (%)
House heating fuel used in apartments - Bottled, tank, or LP gas (%)
House heating fuel used in apartments - Electricity (%)
House heating fuel used in apartments - Fuel oil, kerosene, etc. (%)
House heating fuel used in apartments - Coal or coke (%)
House heating fuel used in apartments - Wood (%)
House heating fuel used in apartments - Solar energy (%)
House heating fuel used in apartments - Other fuel (%)
House heating fuel used in apartments - No fuel used (%)
Median year house/condo built: 1976Median year apartment built: 1985Household type by relationship:
Households: 132,554
Male householders: 25,850 (5,220 living alone ), Female householders: 23,954 (7,226 living alone )28,764 spouses (28,677 opposite-sex spouses ), 2,423 unmarried partners , (2,342 opposite-sex unmarried partners ), 38,919 children (36,945 natural , 648 adopted , 1,326 stepchildren ), 1,672 grandchildren , 2,740 brothers or sisters , 3,749 parents , 388 foster children , 1,520 other relatives , 1,827 non-relatives In group quarters: 748
Size of family households: 13,815 2-persons , 9,240 3-persons , 7,463 4-persons , 2,663 5-persons , 2,110 6-persons , 432 7-or-more-persons .
Size of nonfamily households: 12,446 1-person , 1,311 2-persons , 85 3-persons , 239 4-persons .
20,994 married couples with children. single-parent households (1,533 men , 1,955 women ).
65.6% of residents of Sterling Heights speak English at home. of residents speak Spanish at home (66% speak English very well , 32% speak English well , 1% speak English not well , 1% don't speak English at all ).of residents speak other Indo-European language at home (59% speak English very well , 26% speak English well , 12% speak English not well , 3% don't speak English at all ).of residents speak Asian or Pacific Island language at home (67% speak English very well , 22% speak English well , 10% speak English not well , 1% don't speak English at all ).of residents speak other language at home (56% speak English very well , 27% speak English well , 12% speak English not well , 5% don't speak English at all ).
Foreign born population: 35,232 (26.6%)of them are naturalized citizens )
Median number of rooms in houses and condos:
Median number of rooms in apartments
Owner-occupied Renter-occupied
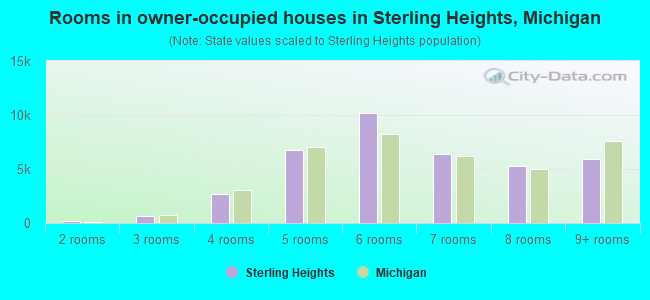
Rooms in owner-occupied houses in Sterling Heights, Michigan
0 1 room 150 2 rooms 639 3 rooms 2,708 4 rooms 6,792 5 rooms 10,171 6 rooms 6,346 7 rooms 5,301 8 rooms 5,908 9+ rooms
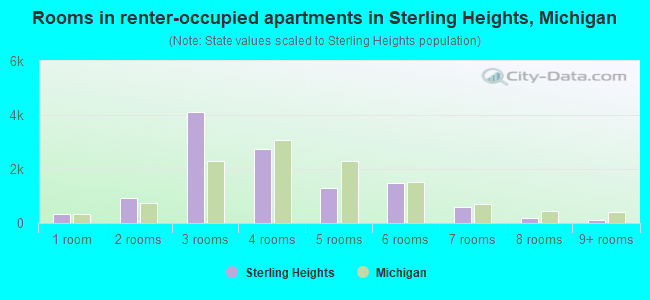
Rooms in renter-occupied apartments in Sterling Heights, Michigan
340 1 room 942 2 rooms 4,114 3 rooms 2,725 4 rooms 1,286 5 rooms 1,487 6 rooms 594 7 rooms 197 8 rooms 104 9+ rooms
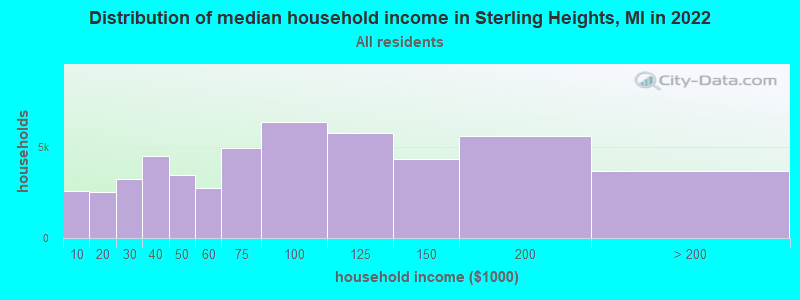
Sterling Heights, MI household income distribution 2,560 Less than $10,0002,545 $10,000 to $19,9993,257 $20,000 to $29,9994,488 $30,000 to $39,9993,459 $40,000 to $49,9992,746 $50,000 to $59,9994,946 $60,000 to $74,9996,376 $75,000 to $99,9995,790 $100,000 to $124,9994,365 $125,000 to $149,9995,616 $150,000 to $199,9993,656 $200,000 or more
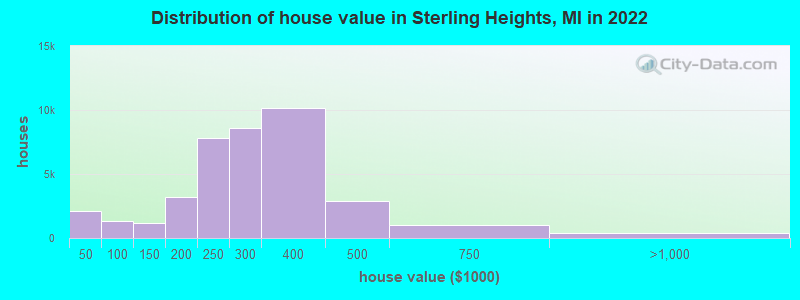
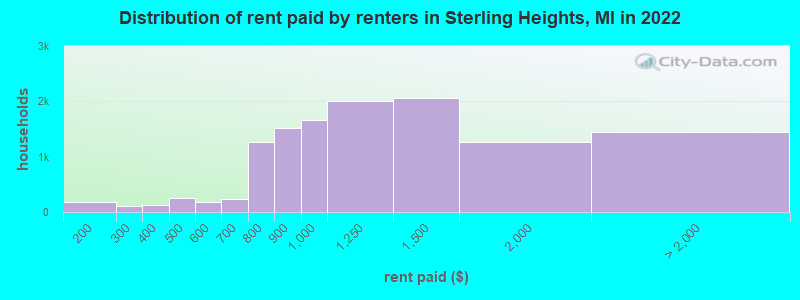
Home value of owner - occupied houses in 2022 in Sterling Heights, MI 771 Less than $10,000228 $10,000 to $14,999179 $15,000 to $19,999161 $20,000 to $24,99953 $25,000 to $29,999127 $30,000 to $34,999618 $40,000 to $49,99986 $50,000 to $59,999149 $60,000 to $69,99968 $70,000 to $79,999344 $80,000 to $89,99948 $90,000 to $99,999532 $100,000 to $124,999677 $125,000 to $149,9991,566 $150,000 to $174,9991,668 $175,000 to $199,9997,804 $200,000 to $249,9998,567 $250,000 to $299,99910,131 $300,000 to $399,9992,870 $400,000 to $499,9991,014 $500,000 to $749,999354 $750,000 to $999,999Rent paid by renters in 2022 in Sterling Heights, MI 14 Less than $10067 $100 to $149111 $150 to $19988 $200 to $24927 $250 to $29930 $300 to $349104 $350 to $399115 $400 to $449128 $450 to $499100 $500 to $54987 $550 to $599123 $600 to $649118 $650 to $699564 $700 to $749692 $750 to $7991,518 $800 to $8991,662 $900 to $9992,006 $1,000 to $1,2492,061 $1,250 to $1,4991,269 $1,500 to $1,999498 $2,000 to $2,499134 $2,500 to $2,999201 $3,000 to $3,499252 $3,500 or more359 No cash rent
Percentage of workers working in this county: 59.9%Number of people working at home: 10,926 (17.2% of all workers )
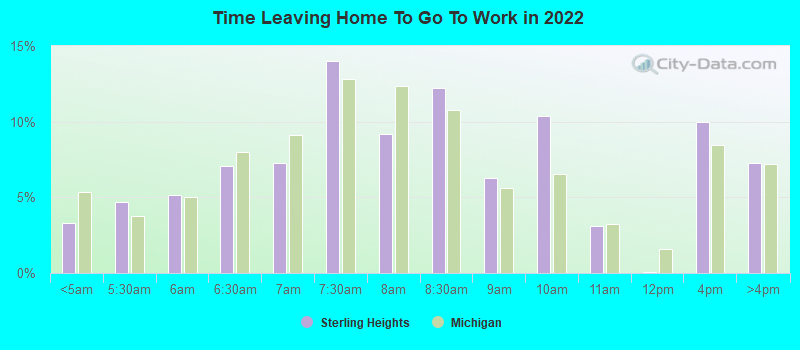
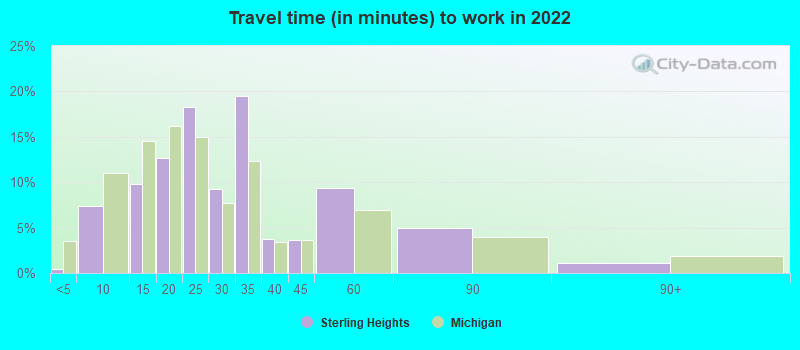
Travel time to work (commute)
Less than 5 minutes: 495 to 9 minutes: 3,29210 to 14 minutes: 6,66515 to 19 minutes: 9,78820 to 24 minutes: 7,51625 to 29 minutes: 3,40030 to 34 minutes: 9,01635 to 39 minutes: 2,05540 to 44 minutes: 2,65545 to 59 minutes: 4,23860 to 89 minutes: 1,49390 or more minutes: 818
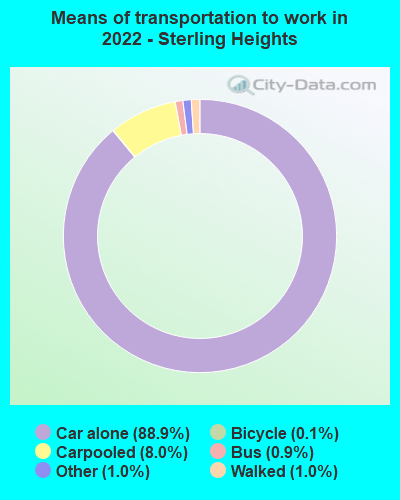
Means of transportation to work:
Drove a car alone: 50,695 (74.3%)Carpooled: 4,809 (7.0%)Bus : 426 (0.6%)Ferryboat: 4 (0.0%)Taxi: 662 (1.0%)Bicycle: 114 (0.2%)Walked: 620 (0.9%)Worked at home: 10,926 (16.0%)
Unemployment by race in 2022
Unemployment rate for White non-Hispanic residents 3.7% Males5.5% FemalesUnemployment rate for Black residents 7.1% Males11.9% FemalesUnemployment rate for Asian residents 0.5% Males9.8% FemalesUnemployment rate for other race residents 13.6% FemalesUnemployment rate for two or more race residents 2.3% Males4.9% FemalesUnemployment rate for Hispanic or Latino residents 1.4% Males5.5% Females
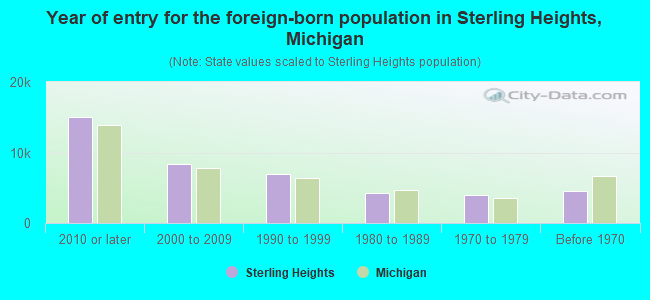
Year of entry for the foreign-born population in Sterling Heights, Michigan
14,977 2010 or later 8,339 2000 to 2009 6,961 1990 to 1999 4,241 1980 to 1989 3,936 1970 to 1979 4,589 Before 1970
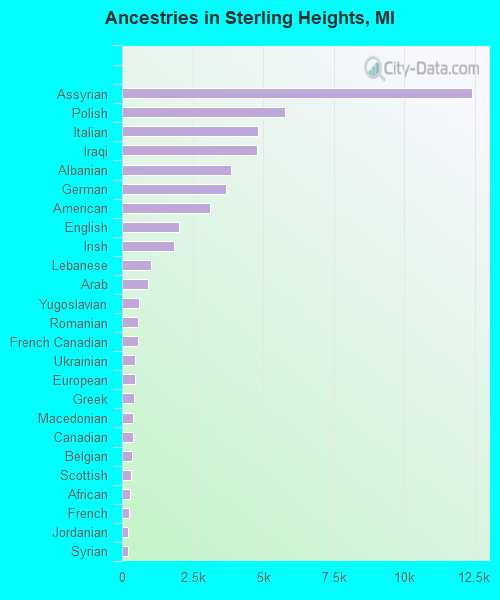
First ancestries reported:
Assyrian: 12,387 (17.1%)
Polish: 5,781 (8.0%)
Italian: 4,817 (6.7%)
Iraqi: 4,773 (6.6%)
Albanian: 3,874 (5.4%)
German: 3,688 (5.1%)
American: 3,131 (4.3%)
English: 2,019 (2.8%)
Irish: 1,836 (2.5%)
Lebanese: 1,031 (1.4%)
Arab: 927 (1.3%)
Yugoslavian: 592 (0.8%)
Romanian: 580 (0.8%)
French Canadian: 564 (0.8%)
Ukrainian: 478 (0.7%)
European: 454 (0.6%)
Greek: 435 (0.6%)
Macedonian: 390 (0.5%)
Canadian: 382 (0.5%)
Belgian: 364 (0.5%)
Scottish: 308 (0.4%)
African: 294 (0.4%)
French: 251 (0.3%)
Jordanian: 230 (0.3%)
Syrian: 227 (0.3%)
Serbian: 218 (0.3%)
Ghanaian: 212 (0.3%)
Hungarian: 180 (0.2%)
British: 174 (0.2%)
Egyptian: 173 (0.2%)
Armenian: 172 (0.2%)
Dutch: 167 (0.2%)
Russian: 158 (0.2%)
Scotch-Irish: 157 (0.2%)
Finnish: 148 (0.2%)
Slovak: 144 (0.2%)
Czech: 144 (0.2%)
Swedish: 135 (0.2%)
Slavic: 133 (0.2%)
Kenyan: 105 (0.1%)
Norwegian: 96 (0.1%)
Austrian: 89 (0.1%)
Turkish: 82 (0.1%)
Croatian: 77 (0.1%)
Iranian: 62 (0.09%)
Danish: 55 (0.08%)
Eastern European: 45 (0.06%)
Brazilian: 43 (0.06%)
Jamaican: 40 (0.06%)
Israeli: 38 (0.05%)
Lithuanian: 37 (0.05%)
Welsh: 26 (0.04%)
Czechoslovakian: 22 (0.03%)
Slovene: 17 (0.02%)
Portuguese: 17 (0.02%)
Bulgarian: 14 (0.02%)
Maltese: 11 (0.02%)
Haitian: 11 (0.02%)
Soviet Union: 9 (0.01%)
Scandinavian: 8 (0.01%)
Northern European: 5 (0.01%)
Most common places of birth for foreign-born residents (%): Iraq Sterling Heights:
45.4% (16,898)Michigan:
8.1% (55,954)
India Sterling Heights:
7.6% (2,831)Michigan:
11.1% (77,240)
Albania Sterling Heights:
5.7% (2,137)Michigan:
1.9% (12,910)
Philippines Sterling Heights:
4.4% (1,636)Michigan:
2.8% (19,112)
Bangladesh Sterling Heights:
3.2% (1,208)Michigan:
2.6% (18,065)
Other Eastern Europe Sterling Heights:
2.6% (965)Michigan:
1.0% (6,730)
Canada Sterling Heights:
2.4% (877)Michigan:
5.0% (35,052)
Lebanon Sterling Heights:
2.0% (761)Michigan:
3.7% (25,634)
Poland Sterling Heights:
2.0% (738)Michigan:
1.6% (10,857)
Pakistan Sterling Heights:
1.8% (687)Michigan:
1.5% (10,596)
Place of birth for U.S.-born residents:
This state: 83,170Other state: 12,831Northeast: 2,570Midwest: 4,433South: 3,995West: 1,833 92.2% of Sterling Heights residents lived in the same house 1 years ago.
Out of people who lived in different houses, 37.1% lived in this county.
Out of people who lived in different counties, 64.3% lived in Michigan.
Sterling Heights:
92.2%State average:
88.4%
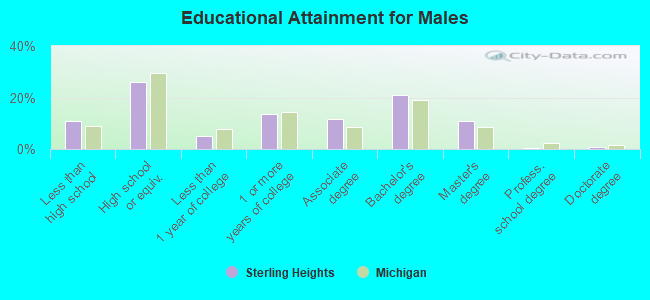
Education attainment for males 25 years and older:
No schooling: 1,758Nursery to 4th grade: 3505th and 6th grade: 2227th and 8th grade: 4669th grade: 13110th grade: 18411th grade: 50512th grade, no diploma: 1,289High school graduate (or equivalency): 11,898Less than 1 year of college: 2,309Some college more than 1 year, no degree: 6,242Associate degree: 5,373Bachelor's degree: 9,613Master's degree: 5,045Professional school degree: 239Doctorate degree: 275
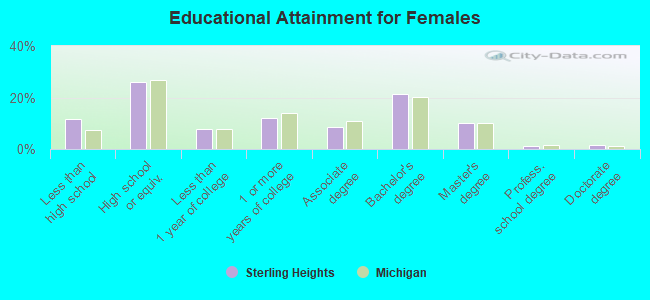
Education attainment for females 25 years and older:
No schooling: 1,785Nursery to 4th grade: 8445th and 6th grade: 4647th and 8th grade: 1,0119th grade: 15210th grade: 51911th grade: 27812th grade, no diploma: 750High school graduate (or equivalency): 12,741Less than 1 year of college: 3,762Some college more than 1 year, no degree: 5,968Associate degree: 4,130Bachelor's degree: 10,562Master's degree: 4,929Professional school degree: 504Doctorate degree: 768
Housing units in structures:
One, detached: 34,356One, attached: 4,752Two: 4523 or 4: 1,1295 to 9: 4,33210 to 19: 2,08220 to 49: 50350 or more: 2,990Mobile homes: 1,201Median worth of mobile homes: $30,800
House/condo owner moved in on average 13 years ago
Renter moved in on average 3 years ago
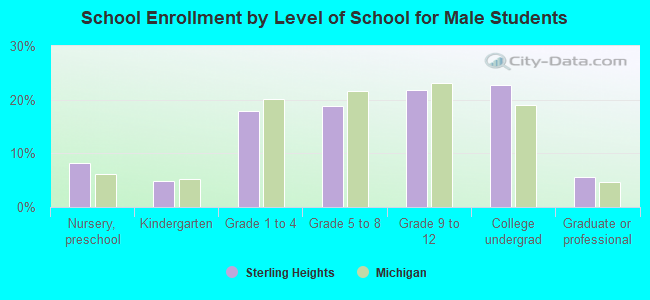
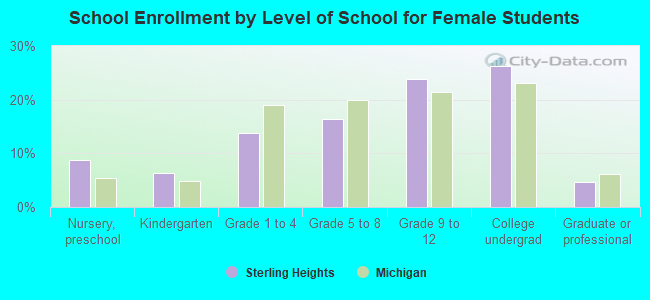
Private vs. public school enrollment:
Students in private schools in grades 1 to 8 (elementary and middle school): 1,606 Students in private schools in grades 9 to 12 (high school): 878 Students in private undergraduate colleges: 1,022