Races in Sterling Heights, Michigan (MI) Detailed Stats
Data:
Races - White alone (%)
Races - White alone (% change since 2000)
Races - Black alone (%)
Races - Black alone (% change since 2000)
Races - American Indian alone (%)
Races - American Indian alone (% change since 2000)
Races - Asian alone (%)
Races - Asian alone (% change since 2000)
Races - Hispanic (%)
Races - Hispanic (% change since 2000)
Races - Native Hawaiian and Other Pacific Islander alone (%)
Races - Native Hawaiian and Other Pacific Islander alone (% change since 2000)
Races - Two or more races(%)
Races - Two or more races(% change since 2000)
Races - Other race alone (%)
Races - Other race alone (% change since 2000)
Racial diversity
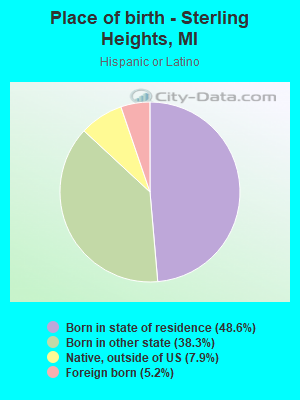
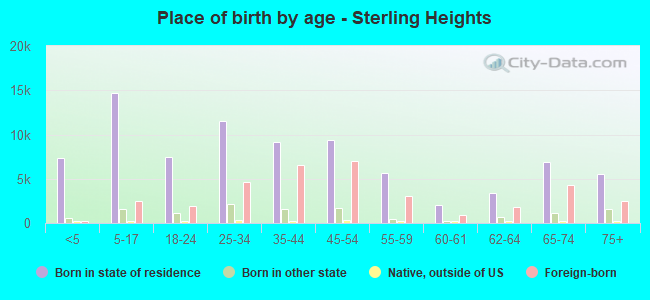
Place of birth - Born in state of residence (%)
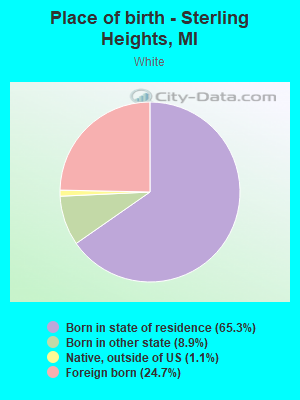
Place of birth - Born in state of residence (%) - White
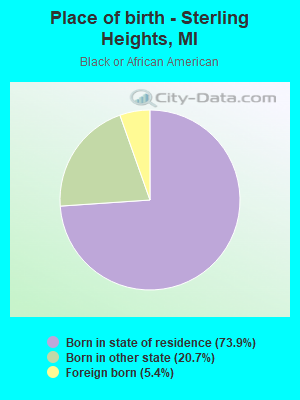
Place of birth - Born in state of residence (%) - Black or African American
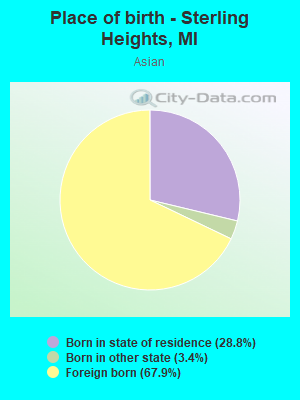
Place of birth - Born in state of residence (%) - Asian
Place of birth - Born in state of residence (%) - Hispanic or Latino
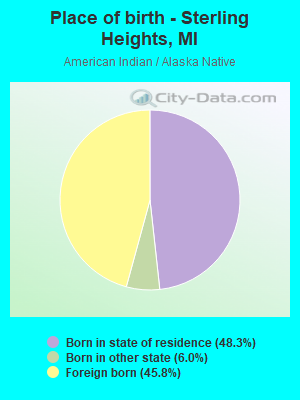
Place of birth - Born in state of residence (%) - American Indian and Alaska Native
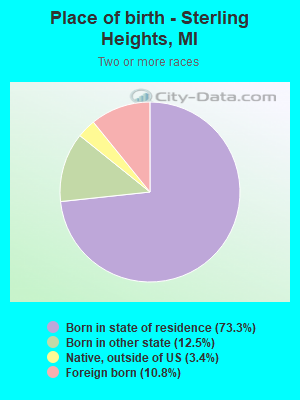
Place of birth - Born in state of residence (%) - Multirace
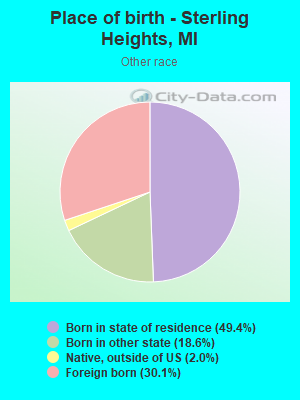
Place of birth - Born in state of residence (%) - Other Race
Place of birth - Born in other state (%)
Place of birth - Born in other state (%) - White
Place of birth - Born in other state (%) - Black or African American
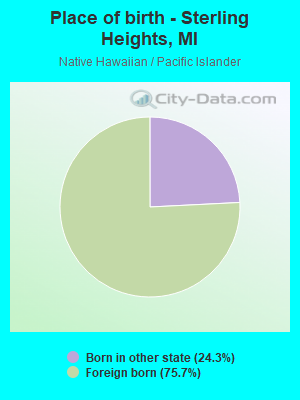
Place of birth - Born in other state (%) - Asian
Place of birth - Born in other state (%) - Hispanic or Latino
Place of birth - Born in other state (%) - American Indian and Alaska Native
Place of birth - Born in other state (%) - Multirace
Place of birth - Born in other state (%) - Other Race
Place of birth - Native, outside of US (%)
Place of birth - Native, outside of US (%) - White
Place of birth - Native, outside of US (%) - Black or African American
Place of birth - Native, outside of US (%) - Asian
Place of birth - Native, outside of US (%) - Hispanic or Latino
Place of birth - Native, outside of US (%) - American Indian and Alaska Native
Place of birth - Native, outside of US (%) - Multirace
Place of birth - Native, outside of US (%) - Other Race
Place of birth - Foreign born (%)
Place of birth - Foreign born (%) - White
Place of birth - Foreign born (%) - Black or African American
Place of birth - Foreign born (%) - Asian
Place of birth - Foreign born (%) - Hispanic or Latino
Place of birth - Foreign born (%) - American Indian and Alaska Native
Place of birth - Foreign born (%) - Multirace
Place of birth - Foreign born (%) - Other Race
Residents speaking English at home (%)
Residents speaking English at home - Born in the United States (%)
Residents speaking English at home - Native, born elsewhere (%)
Residents speaking English at home - Foreign born (%)
Residents speaking Spanish at home (%)
Residents speaking Spanish at home - Born in the United States (%)
Residents speaking Spanish at home - Native, born elsewhere (%)
Residents speaking Spanish at home - Foreign born (%)
Residents speaking other language at home (%)
Residents speaking other language at home - Born in the United States (%)
Residents speaking other language at home - Native, born elsewhere (%)
Residents speaking other language at home - Foreign born (%)
Marital status - Never married (%)
Marital status - Now married (%)
Marital status - Separated (%)
Marital status - Widowed (%)
Marital status - Divorced (%)
Ancestries Reported - Arab (%)
Ancestries Reported - Czech (%)
Ancestries Reported - Danish (%)
Ancestries Reported - Dutch (%)
Ancestries Reported - English (%)
Ancestries Reported - French (%)
Ancestries Reported - French Canadian (%)
Ancestries Reported - German (%)
Ancestries Reported - Greek (%)
Ancestries Reported - Hungarian (%)
Ancestries Reported - Irish (%)
Ancestries Reported - Italian (%)
Ancestries Reported - Lithuanian (%)
Ancestries Reported - Norwegian (%)
Ancestries Reported - Polish (%)
Ancestries Reported - Portuguese (%)
Ancestries Reported - Russian (%)
Ancestries Reported - Scotch-Irish (%)
Ancestries Reported - Scottish (%)
Ancestries Reported - Slovak (%)
Ancestries Reported - Subsaharan African (%)
Ancestries Reported - Swedish (%)
Ancestries Reported - Swiss (%)
Ancestries Reported - Ukrainian (%)
Ancestries Reported - United States (%)
Ancestries Reported - Welsh (%)
Ancestries Reported - West Indian (%)
Ancestries Reported - Other (%)
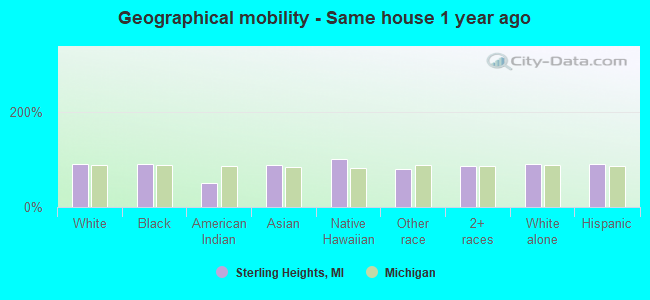
Geographical mobility - Same house 1 year ago (%)
Geographical mobility - Same house 1 year ago (%) - White
Geographical mobility - Same house 1 year ago (%) - Black or African American
Geographical mobility - Same house 1 year ago (%) - Asian
Geographical mobility - Same house 1 year ago (%) - Hispanic or Latino
Geographical mobility - Same house 1 year ago (%) - American Indian and Alaska Native
Geographical mobility - Same house 1 year ago (%) - Multirace
Geographical mobility - Same house 1 year ago (%) - Other Race
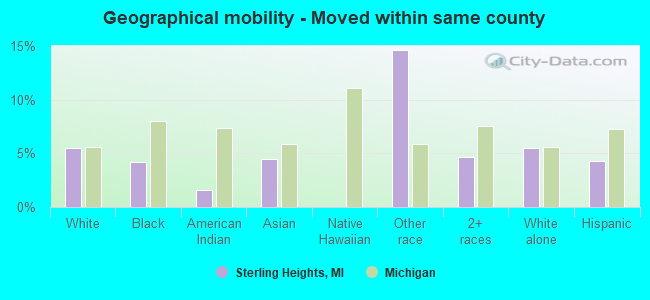
Geographical mobility - Moved within same county (%)
Geographical mobility - Moved within same county (%) - White
Geographical mobility - Moved within same county (%) - Black or African American
Geographical mobility - Moved within same county (%) - Asian
Geographical mobility - Moved within same county (%) - Hispanic or Latino
Geographical mobility - Moved within same county (%) - American Indian and Alaska Native
Geographical mobility - Moved within same county (%) - Multirace
Geographical mobility - Moved within same county (%) - Other Race
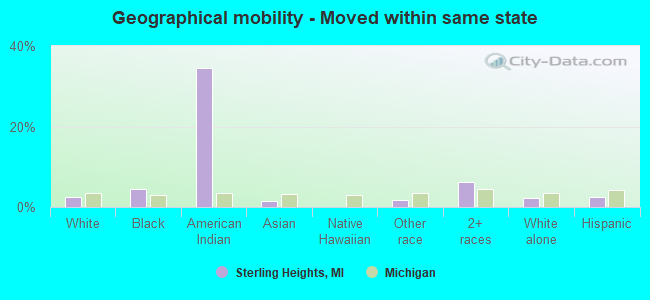
Geographical mobility - Moved from different county within same state (%)
Geographical mobility - Moved from different county within same state (%) - White
Geographical mobility - Moved from different county within same state (%) - Black or African American
Geographical mobility - Moved from different county within same state (%) - Asian
Geographical mobility - Moved from different county within same state (%) - Hispanic or Latino
Geographical mobility - Moved from different county within same state (%) - American Indian and Alaska Native
Geographical mobility - Moved from different county within same state (%) - Multirace
Geographical mobility - Moved from different county within same state (%) - Other Race
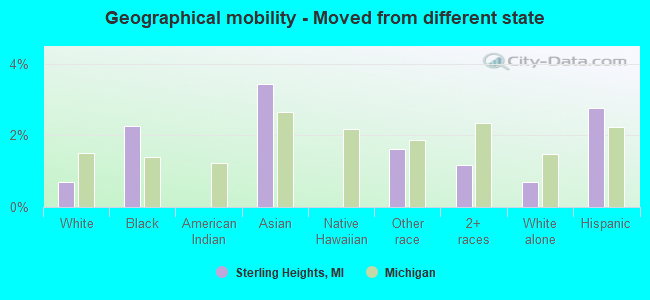
Geographical mobility - Moved from different state (%)
Geographical mobility - Moved from different state (%) - White
Geographical mobility - Moved from different state (%) - Black or African American
Geographical mobility - Moved from different state (%) - Asian
Geographical mobility - Moved from different state (%) - Hispanic or Latino
Geographical mobility - Moved from different state (%) - American Indian and Alaska Native
Geographical mobility - Moved from different state (%) - Multirace
Geographical mobility - Moved from different state (%) - Other Race
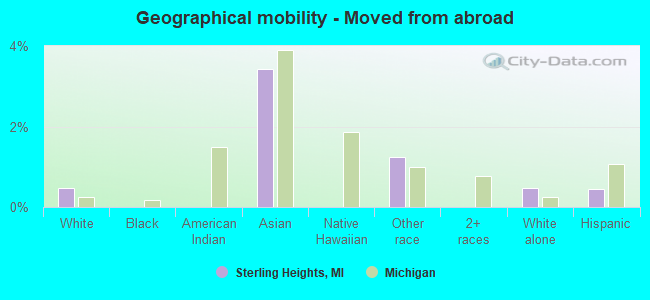
Geographical mobility - Moved from abroad (%)
Geographical mobility - Moved from abroad (%) - White
Geographical mobility - Moved from abroad (%) - Black or African American
Geographical mobility - Moved from abroad (%) - Asian
Geographical mobility - Moved from abroad (%) - Hispanic or Latino
Geographical mobility - Moved from abroad (%) - American Indian and Alaska Native
Geographical mobility - Moved from abroad (%) - Multirace
Geographical mobility - Moved from abroad (%) - Other Race
Place of birth for the foreign-born population - Ireland (%)
Place of birth for the foreign-born population - Denmark (%)
Place of birth for the foreign-born population - Norway (%)
Place of birth for the foreign-born population - Sweden (%)
Place of birth for the foreign-born population - United Kingdom (%)
Place of birth for the foreign-born population - England (%)
Place of birth for the foreign-born population - Scotland (%)
Place of birth for the foreign-born population - Other Northern Europe (%)
Place of birth for the foreign-born population - Austria (%)
Place of birth for the foreign-born population - Belgium (%)
Place of birth for the foreign-born population - France (%)
Place of birth for the foreign-born population - Germany (%)
Place of birth for the foreign-born population - Netherlands (%)
Place of birth for the foreign-born population - Switzerland (%)
Place of birth for the foreign-born population - Other Western Europe (%)
Place of birth for the foreign-born population - Greece (%)
Place of birth for the foreign-born population - Italy (%)
Place of birth for the foreign-born population - Portugal (%)
Place of birth for the foreign-born population - Spain (%)
Place of birth for the foreign-born population - Other Southern Europe (%)
Place of birth for the foreign-born population - Albania (%)
Place of birth for the foreign-born population - Belarus (%)
Place of birth for the foreign-born population - Bosnia and Herzegovina (%)
Place of birth for the foreign-born population - Bulgaria (%)
Place of birth for the foreign-born population - Croatia (%)
Place of birth for the foreign-born population - Czechoslovakia (%)
Place of birth for the foreign-born population - Hungary (%)
Place of birth for the foreign-born population - Latvia (%)
Place of birth for the foreign-born population - Lithuania (%)
Place of birth for the foreign-born population - North Macedonia (Macedonia) (%)
Place of birth for the foreign-born population - Moldova (%)
Place of birth for the foreign-born population - Poland (%)
Place of birth for the foreign-born population - Romania (%)
Place of birth for the foreign-born population - Russia (%)
Place of birth for the foreign-born population - Serbia (%)
Place of birth for the foreign-born population - Ukraine (%)
Place of birth for the foreign-born population - Other Eastern Europe (%)
Place of birth for the foreign-born population - China (%)
Place of birth for the foreign-born population - Hong Kong (%)
Place of birth for the foreign-born population - Taiwan (%)
Place of birth for the foreign-born population - Japan (%)
Place of birth for the foreign-born population - Korea (%)
Place of birth for the foreign-born population - Other Eastern Asia (%)
Place of birth for the foreign-born population - Afghanistan (%)
Place of birth for the foreign-born population - Bangladesh (%)
Place of birth for the foreign-born population - India (%)
Place of birth for the foreign-born population - Iran (%)
Place of birth for the foreign-born population - Kazakhstan (%)
Place of birth for the foreign-born population - Nepal (%)
Place of birth for the foreign-born population - Pakistan (%)
Place of birth for the foreign-born population - Sri Lanka (%)
Place of birth for the foreign-born population - Uzbekistan (%)
Place of birth for the foreign-born population - Other South Central Asia (%)
Place of birth for the foreign-born population - Burma (%)
Place of birth for the foreign-born population - Cambodia (%)
Place of birth for the foreign-born population - Indonesia (%)
Place of birth for the foreign-born population - Laos (%)
Place of birth for the foreign-born population - Malaysia (%)
Place of birth for the foreign-born population - Philippines (%)
Place of birth for the foreign-born population - Singapore (%)
Place of birth for the foreign-born population - Thailand (%)
Place of birth for the foreign-born population - Vietnam (%)
Place of birth for the foreign-born population - Other South Eastern Asia (%)
Place of birth for the foreign-born population - Armenia (%)
Place of birth for the foreign-born population - Iraq (%)
Place of birth for the foreign-born population - Israel (%)
Place of birth for the foreign-born population - Jordan (%)
Place of birth for the foreign-born population - Kuwait (%)
Place of birth for the foreign-born population - Lebanon (%)
Place of birth for the foreign-born population - Saudi Arabia (%)
Place of birth for the foreign-born population - Syria (%)
Place of birth for the foreign-born population - Turkey (%)
Place of birth for the foreign-born population - Yemen (%)
Place of birth for the foreign-born population - Other Western Asia (%)
Place of birth for the foreign-born population - Eritrea (%)
Place of birth for the foreign-born population - Ethiopia (%)
Place of birth for the foreign-born population - Kenya (%)
Place of birth for the foreign-born population - Somalia (%)
Place of birth for the foreign-born population - Uganda (%)
Place of birth for the foreign-born population - Zimbabwe (%)
Place of birth for the foreign-born population - Other Eastern Africa (%)
Place of birth for the foreign-born population - Cameroon (%)
Place of birth for the foreign-born population - Congo (%)
Place of birth for the foreign-born population - Democratic Republic of Congo (Zaire) (%)
Place of birth for the foreign-born population - Other Middle Africa (%)
Place of birth for the foreign-born population - Egypt (%)
Place of birth for the foreign-born population - Morocco (%)
Place of birth for the foreign-born population - Sudan (%)
Place of birth for the foreign-born population - Other Northern Africa (%)
Place of birth for the foreign-born population - South Africa (%)
Place of birth for the foreign-born population - Other Southern Africa (%)
Place of birth for the foreign-born population - Cabo Verde (%)
Place of birth for the foreign-born population - Ghana (%)
Place of birth for the foreign-born population - Liberia (%)
Place of birth for the foreign-born population - Nigeria (%)
Place of birth for the foreign-born population - Senegal (%)
Place of birth for the foreign-born population - Sierra Leone (%)
Place of birth for the foreign-born population - Other Western Africa (%)
Place of birth for the foreign-born population - Australia (%)
Place of birth for the foreign-born population - New Zealand (%)
Place of birth for the foreign-born population - Fiji (%)
Place of birth for the foreign-born population - Micronesia (%)
Place of birth for the foreign-born population - Bahamas (%)
Place of birth for the foreign-born population - Barbados (%)
Place of birth for the foreign-born population - Cuba (%)
Place of birth for the foreign-born population - Dominica (%)
Place of birth for the foreign-born population - Dominican Republic (%)
Place of birth for the foreign-born population - Grenada (%)
Place of birth for the foreign-born population - Haiti (%)
Place of birth for the foreign-born population - Jamaica (%)
Place of birth for the foreign-born population - St. Vincent and the Grenadines (%)
Place of birth for the foreign-born population - Trinidad and Tobago (%)
Place of birth for the foreign-born population - West Indies (%)
Place of birth for the foreign-born population - Other Caribbean (%)
Place of birth for the foreign-born population - Belize (%)
Place of birth for the foreign-born population - Costa Rica (%)
Place of birth for the foreign-born population - El Salvador (%)
Place of birth for the foreign-born population - Guatemala (%)
Place of birth for the foreign-born population - Honduras (%)
Place of birth for the foreign-born population - Mexico (%)
Place of birth for the foreign-born population - Nicaragua (%)
Place of birth for the foreign-born population - Panama (%)
Place of birth for the foreign-born population - Other Central America (%)
Place of birth for the foreign-born population - Argentina (%)
Place of birth for the foreign-born population - Bolivia (%)
Place of birth for the foreign-born population - Brazil (%)
Place of birth for the foreign-born population - Chile (%)
Place of birth for the foreign-born population - Colombia (%)
Place of birth for the foreign-born population - Ecuador (%)
Place of birth for the foreign-born population - Guyana (%)
Place of birth for the foreign-born population - Peru (%)
Place of birth for the foreign-born population - Uruguay (%)
Place of birth for the foreign-born population - Venezuela (%)
Place of birth for the foreign-born population - Other South America (%)
Place of birth for the foreign-born population - Canada (%)
Place of birth for the foreign-born population - Other Northern America (%)
Place of birth for the foreign-born population - Other (%)
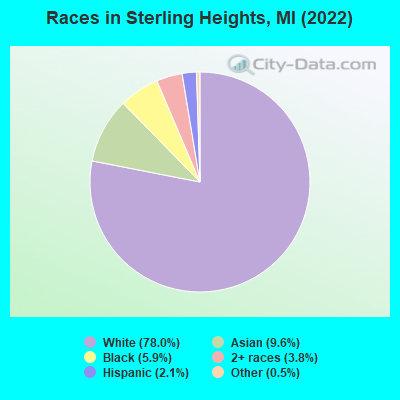
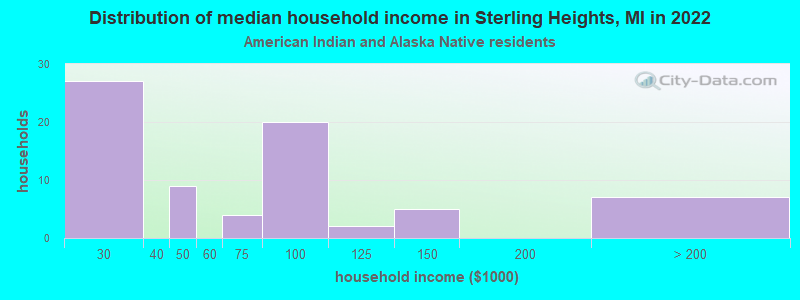
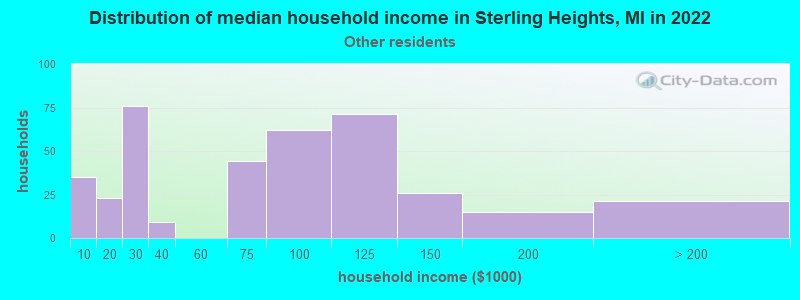
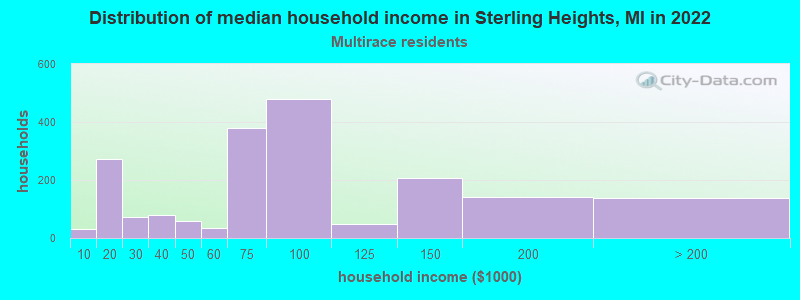
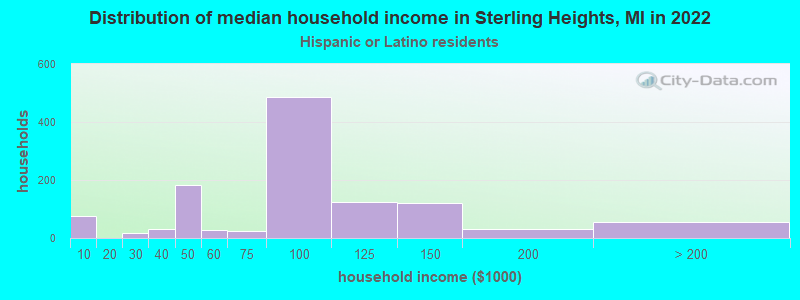
According to 2022 data, the most numerous races in Sterling Heights, MI are White alone (103,805 residents), Black alone (7,915 residents), and Hispanic (2,840 residents). 66.2% of Sterling Heights residents speak English at home. 27.9% of Sterling Heights, MI residents are foreign-born (20.3% born in Asia, 5.7% born in Europe), which is 78.5% greater than the foreign-born rate of 6.0% across the entire state of Michigan.
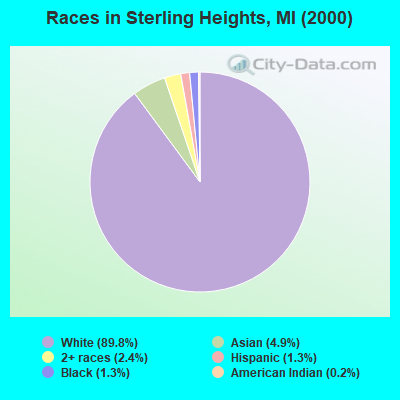
Race distribution in Sterling Heights
2000 2022
111,743 89.8% White alone 6,100 4.9% Asian alone 2,965 2.4% Two or more races 1,602 1.3% Black alone 1,665 1.3% Hispanic 239 0.2% American Indian alone 122 0.10% Other race alone 35 0.03% Native Hawaiian and Other
103,805 78.0% White alone 12,722 9.6% Asian alone 7,915 5.9% Black alone 5,121 3.8% Two or more races 2,840 2.1% Hispanic 627 0.5% Other race alone 126 0.09% American Indian alone 8 0.01% Native Hawaiian and Other
2000 2022
7,806,691 78.6% White alone 1,402,047 14.1% Black alone 323,877 3.3% Hispanic 175,311 1.8% Asian alone 163,487 1.6% Two or more races 53,421 0.5% American Indian alone 11,465 0.1% Other race alone 2,145 0.02% Native Hawaiian and Other
7,289,051 72.6% White alone 1,310,464 13.1% Black alone 572,405 5.7% Hispanic 450,031 4.5% Two or more races 335,732 3.3% Asian alone 45,217 0.5% Other race alone 29,011 0.3% American Indian alone 2,207 0.02% Native Hawaiian and Other
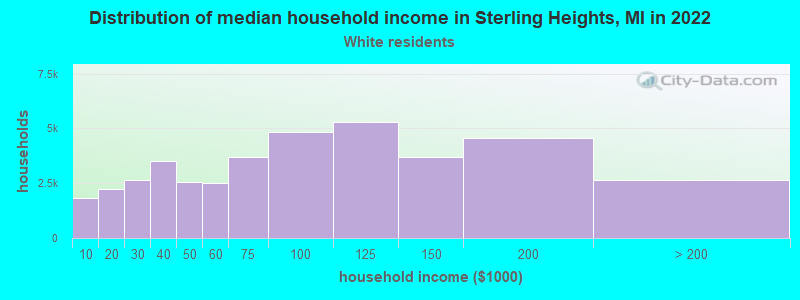
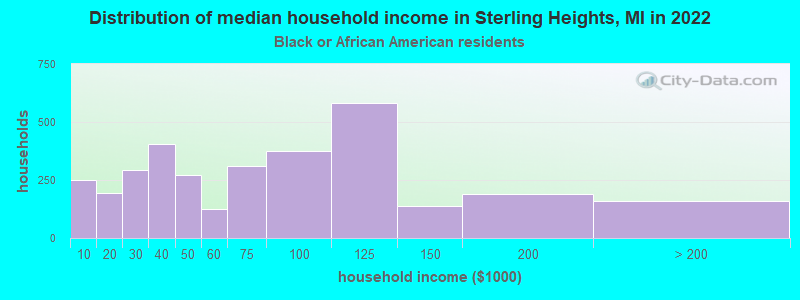
Income and house value in Sterling Heights Median household income in 2022 $79,885 White non-Hispanic householders$42,752 Black householders$102,583 Asian householders$76,593 Some other race householders$88,255 Two or more races householders$75,796 Hispanic or Latino race householdersMedian 2022 house value $276,704 White Non-Hispanic householders$291,577 Black or African American householders$224,649 American Indian or Alaska Native householders $300,397 Asian householders$277,396 Some other race householders$299,186 Two or more races householders$262,350 Hispanic or Latino householders
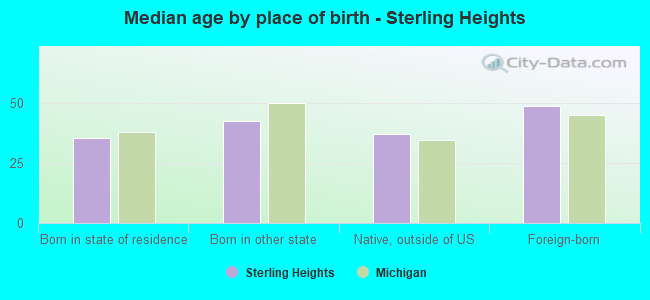
Median age by race in Sterling Heights
42.6 Median age for White residents42.4 43.6 35.3 Median age for Black or African American residents33.0 36.5 -666,666,666.0 Median age for American Indian / Alaska Native residents-666,666,666.0 -666,666,666.0 36.7 Median age for Asian residents39.9 34.3 -666,666,666.0 Median age for Native Hawaiian / Pacific Islander residents-666,666,666.0 -666,666,666.0 42.2 Median age for Other race residents45.2 41.0 25.9 Median age for Two or more races residents34.0 23.3 42.7 Median age for White alone residents42.4 44.1 36.7 Median age for Hispanic or Latino residents41.0 36.6
Owner/renter occupied households by race in Sterling Heights
House owners and renters - White residents 32,357 80.7% Owner occupied7,740 19.3% Renter occupiedHouse owners and renters - Black or African American residents 1,371 34.4% Owner occupied2,617 65.6% Renter occupiedHouse owners and renters - American Indian / Alaska Native residents 72 85.6% Owner occupied12 14.4% Renter occupiedHouse owners and renters - Asian residents 3,109 79.2% Owner occupied816 20.8% Renter occupiedHouse owners and renters - Other race residents 289 60.6% Owner occupied188 39.4% Renter occupiedHouse owners and renters - Two or more races residents 1,033 72.7% Owner occupied387 27.3% Renter occupiedHouse owners and renters - White alone residents 32,301 81.3% Owner occupied7,414 18.7% Renter occupiedHouse owners and renters - Hispanic or Latino residents 482 40.7% Owner occupied701 59.3% Renter occupied
Language usage in Sterling Heights
English speakers - Total 66.2% of residents of Sterling Heights speak English at home.
0.7% of residents speak Spanish at home 551 62.2% Speak English very well335 37.8% Speak English less than very well33.1% of residents speak other language at home 22,596 54.8% Speak English very well18,632 45.2% Speak English less than very well
English speakers - Born in the United States 91.6% of residents of Sterling Heights speak English at home.
1.7% of residents speak Spanish at home 119 58.0% Speak English very well86 42.0% Speak English less than very well6.8% of residents speak other language at home 588 70.8% Speak English very well243 29.2% Speak English less than very well
English speakers - Native, born elsewhere 63.4% of residents of Sterling Heights speak English at home.
8.4% of residents speak Spanish at home 42 37.8% Speak English very well69 62.2% Speak English less than very well28.2% of residents speak other language at home 262 70.4% Speak English very well110 29.6% Speak English less than very well
English speakers - Foreign-born 9.9% of residents of Sterling Heights speak English at home.
0.8% of residents speak Spanish at home 211 78.1% Speak English very well59 21.9% Speak English less than very well89.3% of residents speak other language at home 13,702 43.6% Speak English very well17,718 56.4% Speak English less than very well
White (Caucasian) - Speak only English Native:
89.7% (63,666)Foreign-born:
11.0% (2,755)
White (Caucasian) - Speak another language Native:
10.3% (7,323)Foreign-born:
89.0% (22,264)
Black or African American - Speak only English Native:
99.8% (6,871)Foreign-born:
19.8% (137)
Black or African American - Speak another language Native:
0.4% (29)Foreign-born:
80.8% (558)
Asian - Speak only English Native:
35.1% (1,166)Foreign-born:
5.2% (466)
Asian - Speak another language Native:
64.9% (2,153)Foreign-born:
94.8% (8,422)
Other race - Speak only English Native:
60.5% (475)Foreign-born:
5.6% (22)
Other race - Speak another language Native:
37.8% (297)Foreign-born:
94.2% (369)
Two or more races - Speak only English Native:
89.6% (4,411)Foreign-born:
10.4% (116)
Two or more races - Speak another language Native:
10.7% (527)Foreign-born:
90.1% (1,007)
White alone - Speak only English Native:
89.6% (63,115)Foreign-born:
11.0% (2,755)
White alone - Speak another language Native:
10.4% (7,323)Foreign-born:
89.0% (22,264)
Hispanic or Latino - Speak only English Native:
81.0% (1,697)Foreign-born:
9.7% (47)
Hispanic or Latino - Speak another language Native:
19.8% (415)Foreign-born:
90.3% (432)
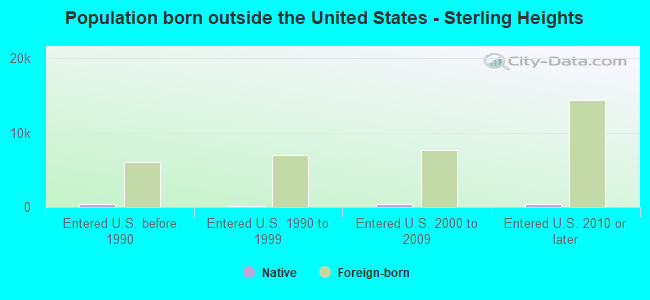
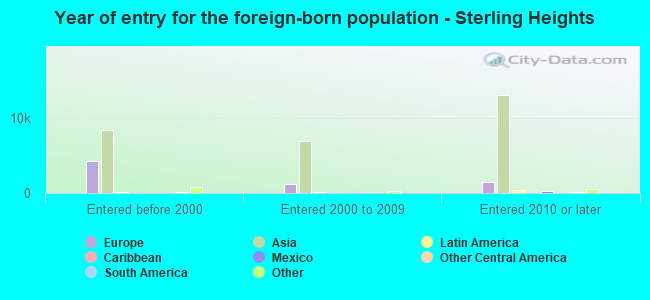
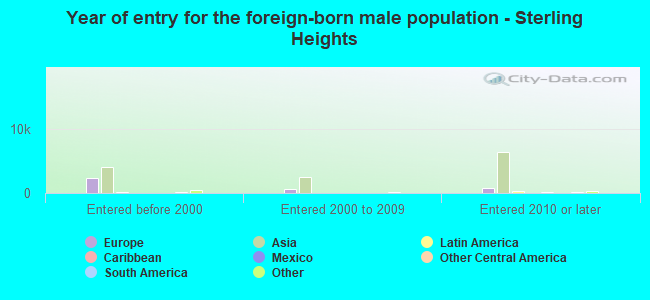
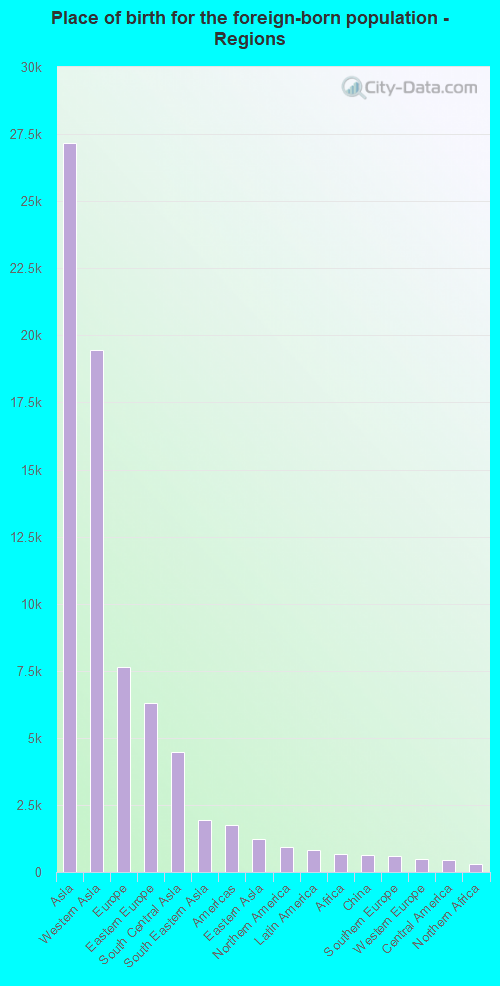
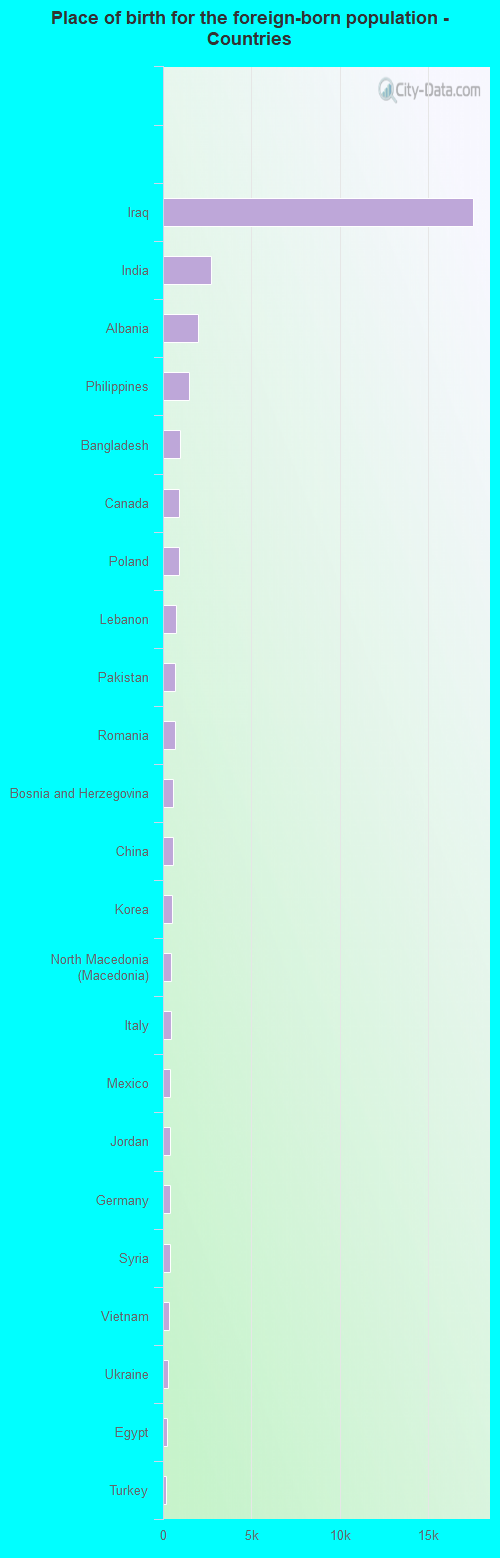
Foreign-born residents in Sterling Heights 37,190 residents are foreign born (20.3% Asia , 5.7% Europe ).
This city:
27.9%Michigan:
6.9%
Marital status for residents in Sterling Heights Marital status - White (Caucasian) population 15 years and over
Males 31.2% Never married57.6% Now married1.0% Separated3.1% Widowed7.2% DivorcedFemales 28.2% Never married52.8% Now married0.5% Separated10.8% Widowed7.7% DivorcedWomen who gave birth in the past 12 months Now married:
88.4% (895)Unmarried:
11.6% (117)
Women who did not give birth in the past 12 months Now married:
46.1% (10,111)Unmarried:
53.9% (11,825)
Marital status - Black or African American population 15 years and over
Males 51.4% Never married43.8% Now married0.0% Separated0.0% Widowed4.8% DivorcedFemales 26.6% Never married33.1% Now married14.2% Separated10.6% Widowed15.5% DivorcedWomen who gave birth in the past 12 months Now married:
12.7% (16)Unmarried:
87.3% (113)
Women who did not give birth in the past 12 months Now married:
41.5% (812)Unmarried:
58.5% (1,142)
Marital status - American Indian / Alaska Native population 15 years and over
Males 76.6% Never married23.4% Now married0.0% Separated0.0% Widowed0.0% DivorcedFemales 27.0% Never married62.9% Now married0.0% Separated0.0% Widowed10.1% DivorcedWomen who did not give birth in the past 12 months Now married:
57.9% (34)Unmarried:
42.1% (25)
Marital status - Asian population 15 years and over
Males 23.2% Never married72.3% Now married0.8% Separated2.0% Widowed1.6% DivorcedFemales 27.7% Never married62.8% Now married1.1% Separated4.0% Widowed4.5% DivorcedWomen who gave birth in the past 12 months Now married:
100.0% (180)Unmarried:
0.0% (0)
Women who did not give birth in the past 12 months Now married:
51.9% (1,957)Unmarried:
48.1% (1,815)
Marital status - Other race population 15 years and over
Males 41.6% Never married42.2% Now married0.0% Separated0.0% Widowed16.2% DivorcedFemales 20.0% Never married40.4% Now married2.7% Separated8.8% Widowed28.1% DivorcedWomen who gave birth in the past 12 months Now married:
100.0% (2)Unmarried:
0.0% (0)
Women who did not give birth in the past 12 months Now married:
55.7% (111)Unmarried:
44.3% (88)
Marital status - Two or more races population 15 years and over
Males 43.9% Never married52.4% Now married0.0% Separated0.0% Widowed3.7% DivorcedFemales 49.9% Never married40.2% Now married0.0% Separated5.0% Widowed4.9% DivorcedWomen who gave birth in the past 12 months Now married:
68.8% (28)Unmarried:
31.3% (13)
Women who did not give birth in the past 12 months Now married:
24.5% (460)Unmarried:
75.5% (1,417)
Marital status - White alone, not Hispanic / Latino population 15 years and over
Males 31.2% Never married57.6% Now married1.0% Separated3.1% Widowed7.2% DivorcedFemales 27.6% Never married53.2% Now married0.6% Separated10.9% Widowed7.7% DivorcedWomen who gave birth in the past 12 months Now married:
88.4% (895)Unmarried:
11.6% (117)
Women who did not give birth in the past 12 months Now married:
47.0% (10,111)Unmarried:
53.0% (11,395)
Marital status - Hispanic or Latino population 15 years and over
Males 37.4% Never married47.9% Now married0.6% Separated0.2% Widowed13.9% DivorcedFemales 29.1% Never married34.0% Now married2.7% Separated4.9% Widowed29.3% DivorcedWomen who gave birth in the past 12 months Now married:
100.0% (11)Unmarried:
0.0% (0)
Women who did not give birth in the past 12 months Now married:
30.4% (305)Unmarried:
69.6% (697)
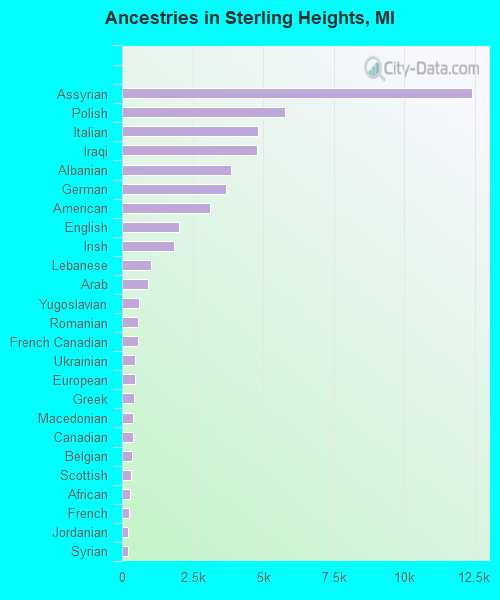
Ancestries in Sterling Heights
12,387 17.1% Assyrian5,781 8.0% Polish4,817 6.7% Italian4,773 6.6% Iraqi3,874 5.4% Albanian3,688 5.1% German3,131 4.3% American2,019 2.8% English1,836 2.5% Irish1,031 1.4% Lebanese927 1.3% Arab592 0.8% Yugoslavian580 0.8% Romanian564 0.8% French Canadian478 0.7% Ukrainian454 0.6% European435 0.6% Greek390 0.5% Macedonian382 0.5% Canadian364 0.5% Belgian308 0.4% Scottish294 0.4% African251 0.3% French230 0.3% Jordanian227 0.3% Syrian218 0.3% Serbian212 0.3% Ghanaian180 0.2% Hungarian174 0.2% British173 0.2% Egyptian172 0.2% Armenian167 0.2% Dutch158 0.2% Russian157 0.2% Scotch-Irish148 0.2% Finnish144 0.2% Slovak144 0.2% Czech135 0.2% Swedish133 0.2% Slavic105 0.1% Kenyan96 0.1% Norwegian89 0.1% Austrian82 0.1% Turkish77 0.1% Croatian62 0.09% Iranian55 0.08% Danish45 0.06% Eastern European43 0.06% Brazilian40 0.06% Jamaican38 0.05% Israeli37 0.05% Lithuanian26 0.04% Welsh22 0.03% Czechoslovakian17 0.02% Slovene17 0.02% Portuguese14 0.02% Bulgarian11 0.02% Maltese11 0.02% Haitian9 0.01% Soviet Union8 0.01% Scandinavian5 0.01% Northern European
Geographical mobility in Sterling Heights Same house 1 year ago 91,337 90.9% White (Caucasian)7,070 90.0% Black or African American77 49.6% American Indian / Alaska Native11,114 87.8% Asian10 100.0% Native Hawaiian / Pacific Islander752 80.1% Other race5,539 85.0% Two or more races91,045 91.2% White alone, not Hispanic / Latino2,512 90.3% Hispanic or LatinoMoved within same county 5,485 5.5% White / Caucasian331 4.2% Black or African American3 1.6% American Indian / Alaska Native564 4.5% Asian137 14.6% Other race306 4.7% Two or more races5,485 5.5% White alone, not Hispanic / Latino121 4.3% Hispanic or LatinoMoved within same state 2,500 2.5% White / Caucasian343 4.4% Black or African American53 34.4% American Indian / Alaska Native176 1.4% Asian16 1.7% Other race397 6.1% Two or more races2,174 2.2% White alone, not Hispanic / Latino70 2.5% Hispanic or LatinoMoved from different state 694 0.7% White / Caucasian179 2.3% Black or African American434 3.4% Asian15 1.6% Other race76 1.2% Two or more races694 0.7% White alone, not Hispanic / Latino77 2.8% Hispanic or LatinoMoved from abroad 480 0.5% White435 3.4% Asian12 1.2% Other race480 0.5% White alone, not Hispanic / Latino13 0.5% Hispanic or Latino
Children Nativity (place of birth) in Sterling Heights
Children under 6 years - Living with two parents Both parents native 4,751 100.0% NativeBoth parents foreign-born 2,103 97.6% Native52 2.4% Foreign-bornOne native, one foreign-born parent 1,741 100.0% NativeChildren under 6 years - Living with one parent Native parent 878 100.0% NativeForeign-born parent 45 100.0% NativeChildren 6 to 17 years - Living with two parents Both parents native 5,783 100.0% NativeBoth parents foreign-born 3,358 60.8% Native2,161 39.2% Foreign-bornOne native, one foreign-born parent 1,542 100.0% NativeChildren 6 to 17 years - Living with one parent Native parent 2,221 100.0% NativeForeign-born parent 783 64.4% Native433 35.6% Foreign-born
Place of birth for residents in Sterling Heights 27,155 Asia19,459 Western Asia7,625 Europe6,294 Eastern Europe4,463 South Central Asia1,950 South Eastern Asia1,735 Americas1,237 Eastern Asia927 Northern America808 Latin America666 Africa648 China594 Southern Europe473 Western Europe464 Central America293 Northern Africa236 Northern Europe221 South America123 Caribbean93 Western Africa91 Eastern Africa23 Middle Africa9 Southern Africa7 Oceania17,578 Iraq2,717 India1,988 Albania1,499 Philippines951 Bangladesh927 Canada906 Poland744 Lebanon698 Pakistan686 Romania585 Bosnia and Herzegovina571 China494 Korea479 North Macedonia (Macedonia)473 Italy410 Mexico408 Jordan380 Germany380 Syria317 Vietnam289 Ukraine250 Egypt187 Turkey143 United Kingdom130 Brazil105 Greece99 Laos95 Japan91 Kenya83 Russia73 Hungary67 Serbia67 Venezuela65 Cuba65 Czechoslovakia62 Senegal62 Iran62 Yemen57 Austria55 Hong Kong44 Ireland40 Croatia40 Dominican Republic34 Thailand32 Algeria31 Sri Lanka29 Saudi Arabia28 Armenia26 Nigeria25 England24 Argentina23 Cameroon23 Panama22 Taiwan20 France19 Costa Rica17 Scotland17 Kuwait14 Bulgaria11 Spain11 Belgium11 El Salvador10 Haiti9 South Africa9 Latvia8 Jamaica8 Lithuania7 Sweden7 Moldova5 Netherlands5 Ghana3 Uzbekistan1 Guatemala1 Cambodia
Grandparents responsible for own grandchildren in Sterling Heights
Grandparents (30 to 59 years) White / Caucasian 144 47.2% Responsible for grandchildren161 52.8% Not responsible for grandchildrenBlack or African American 15 22.5% Responsible for grandchildren52 77.5% Not responsible for grandchildrenAsian 80 100.0% Not responsible for grandchildrenTwo or more races 3 100.0% Responsible for grandchildrenWhite alone, not Hispanic / Latino 144 46.1% Responsible for grandchildren169 53.9% Not responsible for grandchildrenGrandparents (60 years and over) White / Caucasian 173 9.0% Responsible for grandchildren1,750 91.0% Not responsible for grandchildrenBlack or African American 113 100.0% Not responsible for grandchildrenAsian 38 15.0% Responsible for grandchildren214 85.0% Not responsible for grandchildrenTwo or more races 12 64.7% Responsible for grandchildren7 35.3% Not responsible for grandchildrenWhite alone, not Hispanic / Latino 173 8.9% Responsible for grandchildren1,773 91.1% Not responsible for grandchildren