Housing density: 157 houses/condos per square mile
Median price asked for vacant for-sale houses and condos in 2022 in this county: $227,726.
Median contract rent in 2022: $1,801 (lower quartile is $1,322, upper quartile is over $2,000)
Median gross rent in Stratham, NH in 2022: $1,895
Housing units in Stratham with a mortgage: 1,371 (64 second mortgage, 281 home equity loan, 0 both second mortgage and home equity loan) Houses without a mortgage: 253
In family households: 247,693 (57,848 male householders, 21,984 female householders)
64,858 spouses, 85,601 children (80,134 natural, 2,077 adopted, 3,390 stepchildren), 3,954 grandchildren, 1,562 brothers or sisters, 2,352 parents, foster children, 1,664 other relatives, 5,842 non-relatives
In nonfamily households: 45,032 (17,024 male householders (12,402 living alone)), 18,177 female householders (14,574 living alone)), 9,831 nonrelatives
In group quarters: 2,498 (1,438 institutionalized population)
57,723 married couples with children.
11,266 single-parent households (3,032 men, 8,234 women).
96.1% of residents of Stratham speak English at home.
1.0% of residents speak Spanish at home (85% speak English very well, 15% speak English well).
2.0% of residents speak other Indo-European language at home (100% speak English very well).
0.4% of residents speak Asian or Pacific Island language at home (68% speak English very well, 32% speak English well).
0.5% of residents speak other language at home (100% speak English very well).
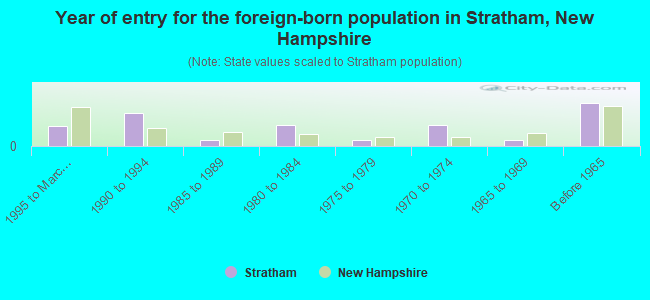
Foreign born population: 314 (4.3%)
(76.8% of them are naturalized citizens)
Year of entry for the foreign-born population in Stratham, New Hampshire
251995 to March 2000
411990 to 1994
71985 to 1989
261980 to 1984
71975 to 1979
261970 to 1974
71965 to 1969
53Before 1965
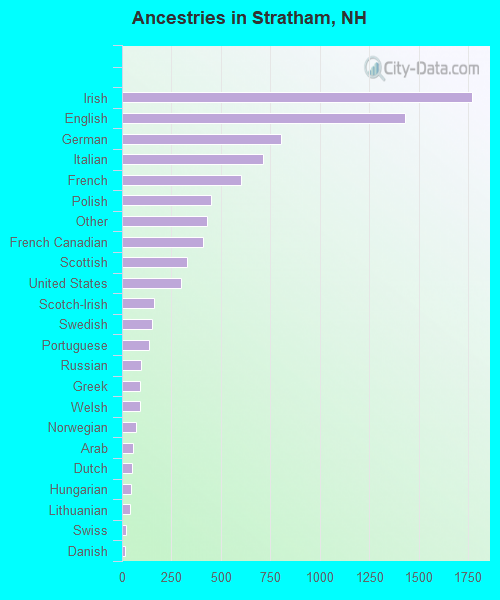
First ancestries reported:
Irish: 1,768 (21.3%)
English: 1,430 (17.2%)
German: 802 (9.7%)
Italian: 712 (8.6%)
French: 602 (7.3%)
Polish: 451 (5.4%)
Other: 430 (5.2%)
French Canadian: 411 (5.0%)
Scottish: 329 (4.0%)
United States: 296 (3.6%)
Scotch-Irish: 164 (2.0%)
Swedish: 151 (1.8%)
Portuguese: 136 (1.6%)
Russian: 98 (1.2%)
Greek: 90 (1.1%)
Welsh: 90 (1.1%)
Norwegian: 71 (0.9%)
Arab: 57 (0.7%)
Dutch: 53 (0.6%)
Hungarian: 45 (0.5%)
Lithuanian: 41 (0.5%)
Swiss: 18 (0.2%)
Danish: 17 (0.2%)
Czech: 14 (0.2%)
Slovak: 8 (0.10%)
Ukrainian: 8 (0.10%)
Most common places of birth for foreign-born residents (%):
Russia
Stratham:
14.1% (27)
New Hampshire:
1.3% (689)
Ireland
Stratham:
12.5% (24)
New Hampshire:
1.5% (837)
Lebanon
Stratham:
12.5% (24)
New Hampshire:
0.9% (489)
Canada
Stratham:
12.0% (23)
New Hampshire:
22.9% (12,397)
Germany
Stratham:
8.9% (17)
New Hampshire:
4.9% (2,670)
United Kingdom
Stratham:
6.8% (13)
New Hampshire:
8.1% (4,396)
Cuba
Stratham:
5.2% (10)
New Hampshire:
0.5% (252)
Spain
Stratham:
4.7% (9)
New Hampshire:
0.5% (294)
Poland
Stratham:
4.2% (8)
New Hampshire:
1.7% (931)
Korea
Stratham:
4.2% (8)
New Hampshire:
2.9% (1,582)
Colombia
Stratham:
4.2% (8)
New Hampshire:
1.7% (940)
Netherlands
Stratham:
3.6% (7)
New Hampshire:
0.9% (471)
Thailand
Stratham:
3.6% (7)
New Hampshire:
0.6% (314)
Vietnam
Stratham:
3.6% (7)
New Hampshire:
2.7% (1,440)
Place of birth for U.S.-born residents:
This state: 2,040
Other state: 4,106
Northeast: 3,194
Midwest: 401
South: 338
West: 173
59% of Stratham residents lived in the same house 5 years ago. Out of people who lived in different houses, 47% lived in this county. Out of people who lived in different counties, 26% lived in New Hampshire.
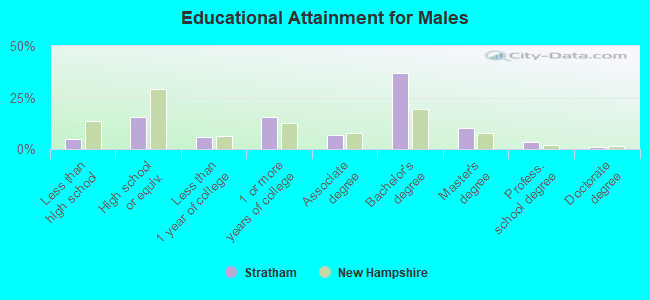
Education attainment for males 25 years and older:
No schooling: 0
Nursery to 4th grade: 0
5th and 6th grade: 8
7th and 8th grade: 26
9th grade: 22
10th grade: 13
11th grade: 9
12th grade, no diploma: 20
High school graduate (or equivalency): 317
Less than 1 year of college: 124
Some college more than 1 year, no degree: 323
Associate degree: 136
Bachelor's degree: 761
Master's degree: 206
Professional school degree: 75
Doctorate degree: 19
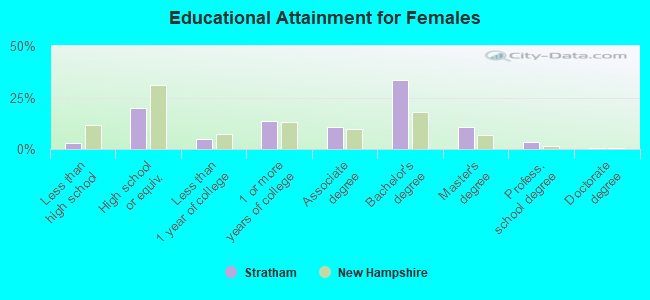
Education attainment for females 25 years and older: