Summerville, SC (South Carolina) Houses and Residents
Estimated median house or condo value in 2022: $323,308 (it was $106,600 in 2000 )
Summerville:
$323,308South Carolina:
$254,600
Lower value quartile - upper value quartile: $241,708 - $399,966Mean price in 2022: Detached houses: $354,187 Here:
$354,187State:
$368,255
Townhouses or other attached units: $146,099 Here:
$146,099State:
$292,023
In 3-to-4-unit structures: $167,944 Here:
$167,944State:
$230,702
In 5-or-more-unit structures: $143,670 Here:
$143,670State:
$326,361
Mobile homes: $65,332 Here:
$65,332State:
$102,531
Total population: 46,974 (Urban population: 28,247, Rural population: 22 (all nonfarm) )
Houses: 22,846 (20,982 occupied: 14,858 owner occupied, 6,779 renter occupied )
% of renters here:
31%State:
28%
Housing density: 1,487 houses/condos per square mile
Median price asked for vacant for-sale houses and condos in 2022: $218,976.
Median contract rent in 2022: $1,152 (lower quartile is $776, upper quartile is $1,524)
Median rent asked for vacant for-rent units in 2022: $1,275
Median gross rent in Summerville, SC in 2022: $1,363
Housing units in Summerville with a mortgage: 11,898 (981 second mortgage, 0 home equity loan, 584 both second mortgage and home equity loan )Houses without a mortgage: 112
Median household income for houses/condos with a mortgage: $100,673
Median household income for apartments without a mortgage: $62,324
Median monthly housing costs: $1,308
Data:
Median house or condo value ($)
Median house or condo value ($ change since 2000)
Median house or condo value ($) - White
Median house or condo value ($) - Black or African American
Median house or condo value ($) - Asian
Median house or condo value ($) - Hispanic or Latino
Median house or condo value ($) - American Indian and Alaska Native
Median house or condo value ($) - Multirace
Median house or condo value ($) - Other Race
Median price asked for mobile homes ($)
Household density (households per square mile)
Mean house or condo value by units in structure - 1, detached ($)
Mean house or condo value by units in structure - 1, attached ($)
Mean house or condo value by units in structure - 2 ($)
Mean house or condo value by units in structure by units in structure - 3 or 4 ($)
Mean house or condo value by units in structure - 5 or more ($)
Mean house or condo value by units in structure - Boat, RV, van, etc. ($)
Mean house or condo value by units in structure - Mobile home ($)
Median contract rent ($)
Median contract rent - Lower quartile ($)
Median contract rent - Upper quartile ($)
Median gross rent ($)
Urban houses (%)
Rural houses (%)
Houses occupied (%)
Houses occupied (% change since 2000)
Houses owner occupied (%)
Houses owner occupied (% change since 2000)
Houses renter occupied (%)
Houses renter occupied (% change since 2000)
Vacant housing units - For rent (%)
Vacant housing units - For rent (% change since 2000)
Vacant housing units - For sale only (%)
Vacant housing units - For sale only (% change since 2000)
Vacant housing units - Rented or sold, not occupied (%)
Vacant housing units - Rented or sold, not occupied (% change since 2000)
Vacant housing units - For seasonal, recreational, or occasional use (%)
Vacant housing units - For seasonal, recreational, or occasional use (% change since 2000)
Vacant housing units - For migrant workers (%)
Vacant housing units - For migrant workers (% change since 2000)
Vacant housing units - Other vacant (%)
Vacant housing units - Other vacant (% change since 2000)
Median monthly housing costs ($)
Median household income for houses/condos with a mortgage ($)
Median household income for houses/condos without a mortgage ($)
Median household income ($)
Median household income ($) - White
Median household income ($) - Black or African American
Median household income ($) - Asian
Median household income ($) - Hispanic or Latino
Median household income ($) - American Indian and Alaska Native
Median household income ($) - Multirace
Median household income ($) - Other Race
Mortgage status - with mortgage (%)
Mortgage status - with second mortgage (%)
Mortgage status - with home equity loan (%)
Mortgage status - with both second mortgage and home equity loan (%)
Mortgage status - without a mortgage (%)
Median year house/condo built
Median year apartment built
Household type by relationship - Male householder living alone (%)
Household type by relationship - Male householder not living alone (%)
Household type by relationship - Female householder living alone (%)
Household type by relationship - Female householder not living alone (%)
Household type by relationship - Opposite-Sex spouse (%)
Household type by relationship - Same-Sex spouse (%)
Household type by relationship - Opposite-Sex unmarried partner (%)
Household type by relationship - Same-Sex unmarried partner (%)
Household type by relationship - In group quarters (%)
Size of family households - 2-person household (%)
Size of family households - 3-person household (%)
Size of family households - 4-person household (%)
Size of family households - 5-person household (%)
Size of family households - 6-person household (%)
Size of family households - 7-or-more-person household (%)
Size of nonfamily households - 1-person household (%)
Size of nonfamily households - 2-person household (%)
Size of nonfamily households - 3-person household (%)
Size of nonfamily households - 4-person household (%)
Size of nonfamily households - 5-person household (%)
Size of nonfamily households - 6-person household (%)
Size of nonfamily households - 7-or-moreperson household (%)
Year house built - Built 2010 or later (%)
Year house built - Built 2000 to 2009 (%)
Year house built - Built 1990 to 1999 (%)
Year house built - Built 1980 to 1989 (%)
Year house built - Built 1970 to 1979 (%)
Year house built - Built 1960 to 1969 (%)
Year house built - Built 1950 to 1959 (%)
Year house built - Built 1940 to 1949 (%)
Year house built - Built 1939 or earlier (%)
Median number of rooms in houses and condos
Median number of rooms in apartments
Median number of bedrooms in owner occupied houses
Mean number of bedrooms in owner occupied houses
Median number of bedrooms in renter occupied houses
Mean number of bedrooms in renter occupied houses
Median number of vehichles in owner occupied houses
Mean number of vehichles in owner occupied houses
Median number of vehichles in renter occupied houses
Mean number of vehichles in renter occupied houses
Rooms in owner-occupied houses - 1 room (%)
Rooms in owner-occupied houses - 2 rooms (%)
Rooms in owner-occupied houses - 3 rooms (%)
Rooms in owner-occupied houses - 4 rooms (%)
Rooms in owner-occupied houses - 5 rooms (%)
Rooms in owner-occupied houses - 6 rooms (%)
Rooms in owner-occupied houses - 7 rooms (%)
Rooms in owner-occupied houses - 8 rooms (%)
Rooms in owner-occupied houses - 9+ rooms (%)
Rooms in renter-occupied houses - 1 room (%)
Rooms in renter-occupied houses - 2 rooms (%)
Rooms in renter-occupied houses - 3 rooms (%)
Rooms in renter-occupied houses - 4 rooms (%)
Rooms in renter-occupied houses - 5 rooms (%)
Rooms in renter-occupied houses - 6 rooms (%)
Rooms in renter-occupied houses - 7 rooms (%)
Rooms in renter-occupied houses - 8 rooms (%)
Rooms in renter-occupied houses - 9+ rooms (%)
Bedrooms in owner-occupied houses - no bedrooms (%)
Bedrooms in owner-occupied houses - 1 bedroom (%)
Bedrooms in owner-occupied houses - 2 bedrooms (%)
Bedrooms in owner-occupied houses - 3 bedrooms (%)
Bedrooms in owner-occupied houses - 4 bedrooms (%)
Bedrooms in owner-occupied houses - 5+ bedrooms (%)
Bedrooms in renter-occupied houses - no bedrooms (%)
Bedrooms in renter-occupied houses - 1 bedroom (%)
Bedrooms in renter-occupied houses - 2 bedrooms (%)
Bedrooms in renter-occupied houses - 3 bedrooms (%)
Bedrooms in renter-occupied houses - 4 bedrooms (%)
Bedrooms in renter-occupied houses - 5+ bedrooms (%)
Vehicles available in owner-occupied houses - no vehicle available (%)
Vehicles available in owner-occupied houses - 1 vehicle available(%)
Vehicles available in owner-occupied houses - 2 Vehicles available (%)
Vehicles available in owner-occupied houses - 3 Vehicles available (%)
Vehicles available in owner-occupied houses - 4 Vehicles available (%)
Vehicles available in owner-occupied houses - 5+ Vehicles available (%)
Vehicles available in renter-occupied houses - no vehicle available (%)
Vehicles available in renter-occupied houses - 1 vehicle available (%)
Vehicles available in renter-occupied houses - 2 Vehicles available (%)
Vehicles available in renter-occupied houses - 3 Vehicles available (%)
Vehicles available in renter-occupied houses - 4 Vehicles available (%)
Vehicles available in renter-occupied houses - 5+ Vehicles available (%)
Housing units in structures - 1, detached (%)
Housing units in structures - 1, attached (%)
Housing units in structures - 2 (%)
Housing units in structures - 3 or 4 (%)
Housing units in structures - 5 to 9 (%)
Housing units in structures - 10 to 19 (%)
Housing units in structures - 20 to 49 (%)
Housing units in structures - 50 or more (%)
Housing units in structures - Mobile home (%)
Housing units in structures - Boat, RV, van, etc. (%)
Housing units in structures - Owners - 1, detached (%)
Housing units in structures - Owners - 1, attached (%)
Housing units in structures - Owners - 2 (%)
Housing units in structures - Owners - 3 or 4 (%)
Housing units in structures - Owners - 5 to 9 (%)
Housing units in structures - Owners - 10 to 19 (%)
Housing units in structures - Owners - 20 to 49 (%)
Housing units in structures - Owners - 50 or more (%)
Housing units in structures - Owners - Mobile home (%)
Housing units in structures - Owners - Boat, RV, van, etc. (%)
Housing units in structures - Renters - 1, detached (%)
Housing units in structures - Renters - 1, attached (%)
Housing units in structures - Renters - 2 (%)
Housing units in structures - Renters - 3 or 4 (%)
Housing units in structures - Renters - 5 to 9 (%)
Housing units in structures - Renters - 10 to 19 (%)
Housing units in structures - Renters - 20 to 49 (%)
Housing units in structures - Renters - 50 or more (%)
Housing units in structures - Renters - Mobile home (%)
Housing units in structures - Renters - Boat, RV, van, etc. (%)
House/condo owner moved in on average (years ago)
Renter moved in on average (years ago)
Year householder moved into unit - Moved in 1999 to March 2000 (%)
Year householder moved into unit - Moved in 1999 to March 2000 (%) - White
Year householder moved into unit - Moved in 1999 to March 2000 (%) - Black or African American
Year householder moved into unit - Moved in 1999 to March 2000 (%) - Asian
Year householder moved into unit - Moved in 1999 to March 2000 (%) - Hispanic or Latino
Year householder moved into unit - Moved in 1999 to March 2000 (%) - American Indian and Alaska Native
Year householder moved into unit - Moved in 1999 to March 2000 (%) - Multirace
Year householder moved into unit - Moved in 1999 to March 2000 (%) - Other Race
Year householder moved into unit - Moved in 1995 to 1998 (%)
Year householder moved into unit - Moved in 1995 to 1998 (%) - White
Year householder moved into unit - Moved in 1995 to 1998 (%) - Black or African American
Year householder moved into unit - Moved in 1995 to 1998 (%) - Asian
Year householder moved into unit - Moved in 1995 to 1998 (%) - Hispanic or Latino
Year householder moved into unit - Moved in 1995 to 1998 (%) - American Indian and Alaska Native
Year householder moved into unit - Moved in 1995 to 1998 (%) - Multirace
Year householder moved into unit - Moved in 1995 to 1998 (%) - Other Race
Year householder moved into unit - Moved in 1990 to 1994 (%)
Year householder moved into unit - Moved in 1990 to 1994 (%) - White
Year householder moved into unit - Moved in 1990 to 1994 (%) - Black or African American
Year householder moved into unit - Moved in 1990 to 1994 (%) - Asian
Year householder moved into unit - Moved in 1990 to 1994 (%) - Hispanic or Latino
Year householder moved into unit - Moved in 1990 to 1994 (%) - American Indian and Alaska Native
Year householder moved into unit - Moved in 1990 to 1994 (%) - Multirace
Year householder moved into unit - Moved in 1990 to 1994 (%) - Other Race
Year householder moved into unit - Moved in 1980 to 1989 (%)
Year householder moved into unit - Moved in 1980 to 1989 (%) - White
Year householder moved into unit - Moved in 1980 to 1989 (%) - Black or African American
Year householder moved into unit - Moved in 1980 to 1989 (%) - Asian
Year householder moved into unit - Moved in 1980 to 1989 (%) - Hispanic or Latino
Year householder moved into unit - Moved in 1980 to 1989 (%) - American Indian and Alaska Native
Year householder moved into unit - Moved in 1980 to 1989 (%) - Multirace
Year householder moved into unit - Moved in 1980 to 1989 (%) - Other Race
Year householder moved into unit - Moved in 1970 to 1979 (%)
Year householder moved into unit - Moved in 1970 to 1979 (%) - White
Year householder moved into unit - Moved in 1970 to 1979 (%) - Black or African American
Year householder moved into unit - Moved in 1970 to 1979 (%) - Asian
Year householder moved into unit - Moved in 1970 to 1979 (%) - Hispanic or Latino
Year householder moved into unit - Moved in 1970 to 1979 (%) - American Indian and Alaska Native
Year householder moved into unit - Moved in 1970 to 1979 (%) - Multirace
Year householder moved into unit - Moved in 1970 to 1979 (%) - Other Race
Year householder moved into unit - Moved in 1969 or earlier (%)
Year householder moved into unit - Moved in 1969 or earlier (%) - White
Year householder moved into unit - Moved in 1969 or earlier (%) - Black or African American
Year householder moved into unit - Moved in 1969 or earlier (%) - Asian
Year householder moved into unit - Moved in 1969 or earlier (%) - Hispanic or Latino
Year householder moved into unit - Moved in 1969 or earlier (%) - American Indian and Alaska Native
Year householder moved into unit - Moved in 1969 or earlier (%) - Multirace
Year householder moved into unit - Moved in 1969 or earlier (%) - Other Race
Housing units lacking complete plumbing facilities (%)
Housing units lacking complete kitchen facilities (%)
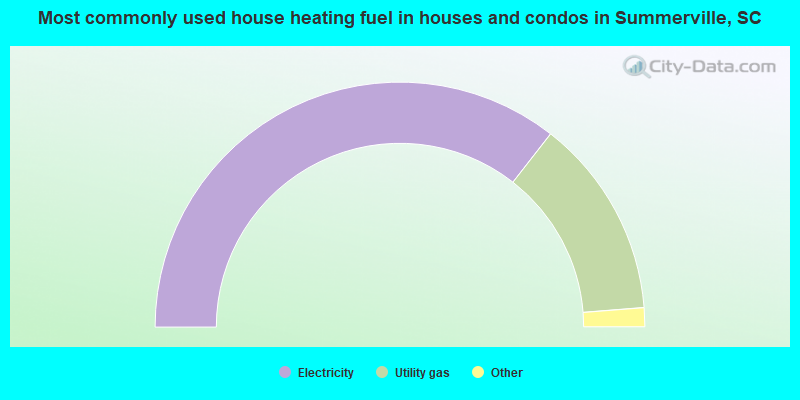
House heating fuel used in houses and condos - Utility gas (%)
House heating fuel used in houses and condos - Bottled, tank, or LP gas (%)
House heating fuel used in houses and condos - Electricity (%)
House heating fuel used in houses and condos - Fuel oil, kerosene, etc. (%)
House heating fuel used in houses and condos - Coal or coke (%)
House heating fuel used in houses and condos - Wood (%)
House heating fuel used in houses and condos - Solar energy (%)
House heating fuel used in houses and condos - Other fuel (%)
House heating fuel used in houses and condos - No fuel used (%)
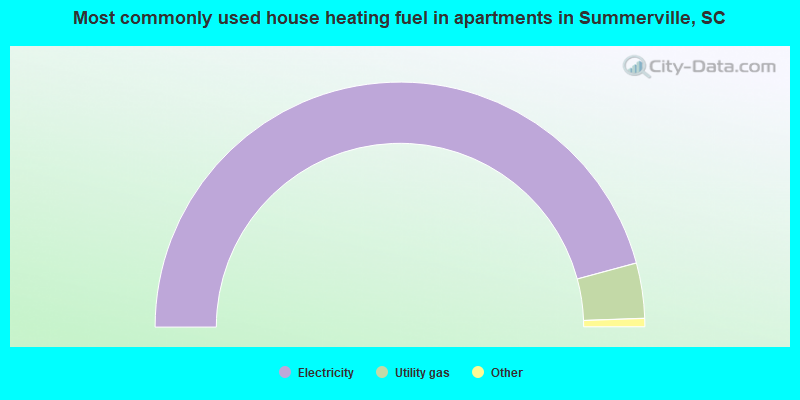
House heating fuel used in apartments - Utility gas (%)
House heating fuel used in apartments - Bottled, tank, or LP gas (%)
House heating fuel used in apartments - Electricity (%)
House heating fuel used in apartments - Fuel oil, kerosene, etc. (%)
House heating fuel used in apartments - Coal or coke (%)
House heating fuel used in apartments - Wood (%)
House heating fuel used in apartments - Solar energy (%)
House heating fuel used in apartments - Other fuel (%)
House heating fuel used in apartments - No fuel used (%)
Latest news about housing in Summerville, SC collected exclusively by city-data.com from local newspapers, TV, and radio stations
Median year house/condo built: 2004Median year apartment built: 2000Household type by relationship:
Households: 52,091
Male householders: 9,415 (2,377 living alone ), Female householders: 11,217 (3,231 living alone )9,984 spouses (9,857 opposite-sex spouses ), 1,310 unmarried partners , (1,275 opposite-sex unmarried partners ), 15,143 children (13,965 natural , 385 adopted , 792 stepchildren ), 1,179 grandchildren , 547 brothers or sisters , 730 parents , 0 foster children , 649 other relatives , 1,450 non-relatives In group quarters: 463
Size of family households: 7,259 2-persons , 3,448 3-persons , 2,431 4-persons , 1,087 5-persons , 422 6-persons , 219 7-or-more-persons .
Size of nonfamily households: 5,582 1-person , 1,101 2-persons , 144 3-persons , 48 4-persons , 47 5-persons .
7,637 married couples with children. single-parent households (412 men , 2,412 women ).
93.7% of residents of Summerville speak English at home. of residents speak Spanish at home (67% speak English very well , 15% speak English well , 15% speak English not well , 2% don't speak English at all ).of residents speak other Indo-European language at home (67% speak English very well , 28% speak English well , 5% speak English not well ).of residents speak Asian or Pacific Island language at home (17% speak English very well , 56% speak English well , 20% speak English not well , 7% don't speak English at all ).of residents speak other language at home (88% speak English very well , 12% don't speak English at all ).
Foreign born population: 1,578 (3.0%)of them are naturalized citizens )
Median number of rooms in houses and condos:
Median number of rooms in apartments
Owner-occupied Renter-occupied
Rooms in owner-occupied houses in Summerville, South Carolina
0 1 room 3 2 rooms 38 3 rooms 1,164 4 rooms 2,462 5 rooms 3,359 6 rooms 2,567 7 rooms 2,048 8 rooms 3,218 9+ rooms
Rooms in renter-occupied apartments in Summerville, South Carolina
147 1 room 286 2 rooms 1,741 3 rooms 1,510 4 rooms 1,388 5 rooms 817 6 rooms 597 7 rooms 124 8 rooms 170 9+ rooms
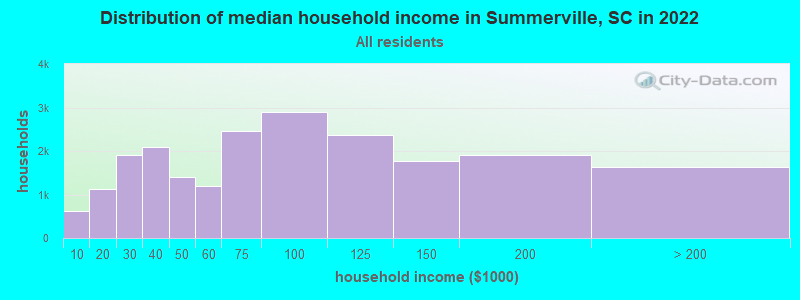
Summerville, SC household income distribution 622 Less than $10,0001,130 $10,000 to $19,9991,914 $20,000 to $29,9992,087 $30,000 to $39,9991,395 $40,000 to $49,9991,205 $50,000 to $59,9992,456 $60,000 to $74,9992,886 $75,000 to $99,9992,374 $100,000 to $124,9991,780 $125,000 to $149,9991,901 $150,000 to $199,9991,642 $200,000 or more
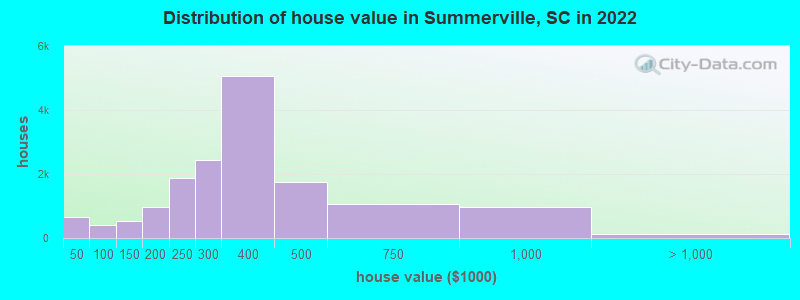
Home value of owner - occupied houses in 2022 in Summerville, SC 274 Less than $10,00077 $10,000 to $14,99913 $15,000 to $19,99944 $20,000 to $24,99970 $25,000 to $29,99974 $30,000 to $34,99990 $40,000 to $49,999202 $50,000 to $59,99988 $70,000 to $79,99917 $80,000 to $89,9998 $90,000 to $99,999223 $100,000 to $124,999322 $125,000 to $149,999295 $150,000 to $174,999666 $175,000 to $199,9991,889 $200,000 to $249,9992,437 $250,000 to $299,9995,058 $300,000 to $399,9991,739 $400,000 to $499,9991,063 $500,000 to $749,999975 $750,000 to $999,99953 $1,000,000 to $1,499,9995 $1,500,000 to $1,999,99974 $2,000,000 or moreRent paid by renters in 2022 in Summerville, SC 29 Less than $10071 $150 to $19993 $200 to $24919 $250 to $29924 $350 to $399235 $450 to $499127 $500 to $54986 $550 to $59933 $600 to $64984 $650 to $699161 $700 to $74945 $750 to $799457 $800 to $899730 $900 to $9991,438 $1,000 to $1,2491,471 $1,250 to $1,4991,163 $1,500 to $1,999139 $2,000 to $2,49951 $2,500 to $2,99910 $3,000 to $3,49917 $3,500 or more84 No cash rent
Percentage of workers working in this county: 44.1%Number of people working at home: 2,598 (9.9% of all workers )
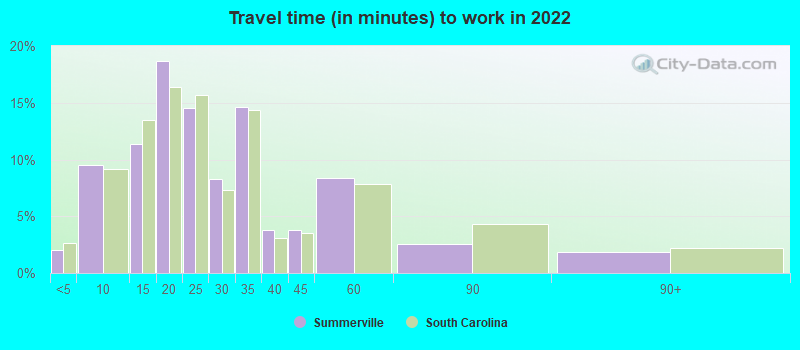
Travel time to work (commute)
Less than 5 minutes: 3805 to 9 minutes: 2,30510 to 14 minutes: 1,92815 to 19 minutes: 3,12920 to 24 minutes: 2,61025 to 29 minutes: 2,36930 to 34 minutes: 3,65935 to 39 minutes: 1,05440 to 44 minutes: 1,36545 to 59 minutes: 3,32760 to 89 minutes: 1,47390 or more minutes: 388
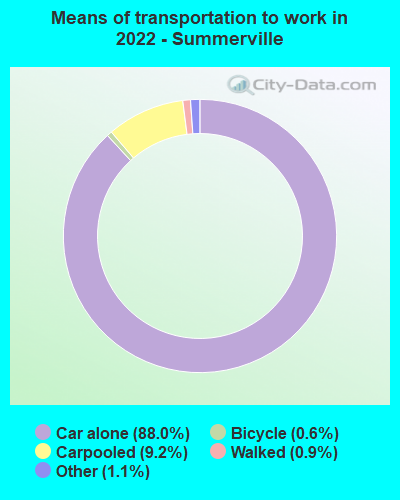
Means of transportation to work:
Drove a car alone: 18,580 (77.9%)Carpooled: 2,045 (8.6%)Bus : 12 (0.1%)Taxi: 263 (1.1%)Bicycle: 152 (0.6%)Walked: 183 (0.8%)Worked at home: 2,598 (10.9%)
Unemployment by race in 2022
Unemployment rate for White non-Hispanic residents 2.2% Males6.4% FemalesUnemployment rate for Black residents 8.5% Males7.5% FemalesUnemployment rate for other race residents 4.1% FemalesUnemployment rate for two or more race residents 3.4% Males3.2% FemalesUnemployment rate for Hispanic or Latino residents 5.1% Females
Year of entry for the foreign-born population in Summerville, South Carolina
547 2010 or later 584 2000 to 2009 377 1990 to 1999 167 1980 to 1989 112 1970 to 1979 203 Before 1970
First ancestries reported:
English: 3,731 (15.3%)
German: 2,871 (11.7%)
American: 2,677 (10.9%)
Irish: 1,820 (7.4%)
Italian: 881 (3.6%)
Scottish: 464 (1.9%)
European: 443 (1.8%)
French: 370 (1.5%)
French Canadian: 238 (1.0%)
Lebanese: 212 (0.9%)
Romanian: 202 (0.8%)
Dutch: 197 (0.8%)
Armenian: 195 (0.8%)
Polish: 181 (0.7%)
Scotch-Irish: 177 (0.7%)
African: 156 (0.6%)
Canadian: 128 (0.5%)
Belgian: 122 (0.5%)
British: 116 (0.5%)
Scandinavian: 70 (0.3%)
Eastern European: 69 (0.3%)
Greek: 67 (0.3%)
Slovak: 62 (0.3%)
Israeli: 53 (0.2%)
Australian: 36 (0.1%)
Danish: 33 (0.1%)
Finnish: 30 (0.1%)
Bahamian: 30 (0.1%)
Jamaican: 28 (0.1%)
Northern European: 24 (0.10%)
Haitian: 20 (0.08%)
West Indian: 20 (0.08%)
Hungarian: 19 (0.08%)
Swedish: 18 (0.07%)
Welsh: 17 (0.07%)
Norwegian: 16 (0.07%)
Czech: 14 (0.06%)
Czechoslovakian: 14 (0.06%)
Lithuanian: 11 (0.04%)
Portuguese: 9 (0.04%)
Austrian: 4 (0.02%) Most common places of birth for foreign-born residents (%): Mexico Summerville:
13.9% (341)South Carolina:
22.5% (60,774)
Philippines Summerville:
8.9% (217)South Carolina:
4.1% (11,031)
Romania Summerville:
7.9% (194)South Carolina:
0.6% (1,507)
Dominican Republic Summerville:
5.8% (143)South Carolina:
0.9% (2,357)
Guyana Summerville:
5.6% (137)South Carolina:
0.2% (598)
Thailand Summerville:
5.4% (133)South Carolina:
0.7% (1,840)
Germany Summerville:
4.7% (116)South Carolina:
3.7% (9,982)
Canada Summerville:
4.3% (104)South Carolina:
3.0% (8,193)
Peru Summerville:
4.2% (102)South Carolina:
0.5% (1,273)
Panama Summerville:
4.1% (101)South Carolina:
0.5% (1,278)
Korea Summerville:
3.1% (75)South Carolina:
1.7% (4,513)
Europe, n.e.c. Summerville:
2.7% (67)South Carolina:
0.1% (163)
India Summerville:
2.5% (62)South Carolina:
6.8% (18,307)
Afghanistan Summerville:
2.5% (62)South Carolina:
0.1% (191)
China, excluding Hong Kong and Taiwan Summerville:
2.2% (53)South Carolina:
3.2% (8,721)
Japan Summerville:
2.1% (51)South Carolina:
0.8% (2,055)
Israel Summerville:
2.0% (50)South Carolina:
0.2% (598)
Venezuela Summerville:
2.0% (48)South Carolina:
1.4% (3,822)
Honduras Summerville:
1.9% (47)South Carolina:
4.8% (12,834)
England Summerville:
1.7% (42)South Carolina:
1.9% (5,117)
Place of birth for U.S.-born residents:
This state: 24,589Other state: 25,239Northeast: 7,324Midwest: 6,302South: 8,824West: 2,771 83.9% of Summerville residents lived in the same house 1 years ago.
Out of people who lived in different houses, 34.8% lived in this county.
Out of people who lived in different counties, 39.1% lived in South Carolina.
Summerville:
83.9%State average:
86.5%
Education attainment for males 25 years and older:
No schooling: 214Nursery to 4th grade: 05th and 6th grade: 367th and 8th grade: 1109th grade: 10510th grade: 9711th grade: 17712th grade, no diploma: 114High school graduate (or equivalency): 4,435Less than 1 year of college: 1,259Some college more than 1 year, no degree: 2,601Associate degree: 2,001Bachelor's degree: 3,430Master's degree: 1,214Professional school degree: 374Doctorate degree: 82
Education attainment for females 25 years and older:
No schooling: 194Nursery to 4th grade: 05th and 6th grade: 07th and 8th grade: 2519th grade: 14410th grade: 18711th grade: 16612th grade, no diploma: 129High school graduate (or equivalency): 4,471Less than 1 year of college: 2,324Some college more than 1 year, no degree: 2,957Associate degree: 3,435Bachelor's degree: 3,473Master's degree: 1,550Professional school degree: 270Doctorate degree: 245
Housing units in structures:
One, detached: 14,571One, attached: 1,196Two: 5263 or 4: 7675 to 9: 2,32710 to 19: 1,57820 to 49: 58350 or more: 290Mobile homes: 1,004Median worth of mobile homes: $57,801
Housing units lacking complete plumbing facilities in 2022: 0.3%Housing units lacking complete kitchen facilities in 2022: 0.9%House/condo owner moved in on average 6 years ago
Renter moved in on average 2 years ago
Private vs. public school enrollment:
Students in private schools in grades 1 to 8 (elementary and middle school): 876 Here:
16.3%South Carolina:
14.4%
Students in private schools in grades 9 to 12 (high school): 483 Here:
20.6%South Carolina:
11.1%
Students in private undergraduate colleges: 559 Here:
29.8%South Carolina:
21.9%