Tacoma, WA (Washington) Houses and Residents
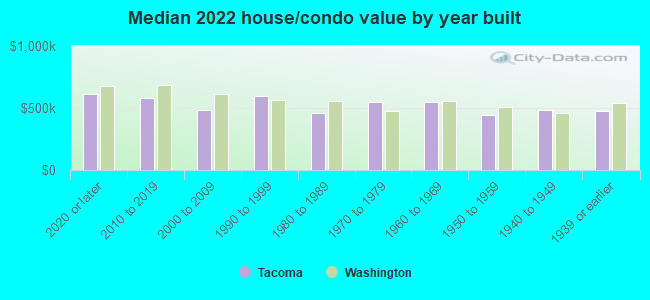
Estimated median house or condo value in 2022: $492,800 (it was $123,400 in 2000 )
Tacoma:
$492,800Washington:
$569,500
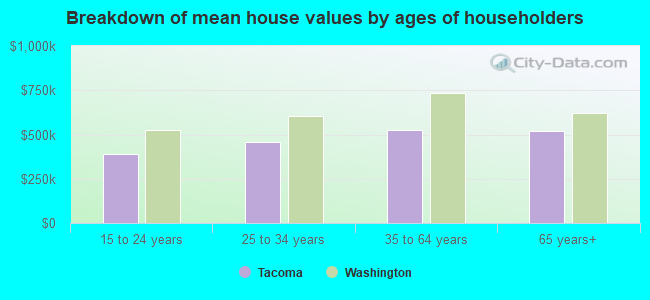
Lower value quartile - upper value quartile: $389,900 - $669,100Mean price in 2022: Detached houses: $539,563 Here:
$539,563State:
$734,307
Townhouses or other attached units: $464,187 Here:
$464,187State:
$657,697
In 2-unit structures: $365,361 Here:
$365,361State:
$534,634
In 3-to-4-unit structures: $539,874 Here:
$539,874State:
$510,239
In 5-or-more-unit structures: $615,661 Here:
$615,661State:
$503,183
Mobile homes: $199,021 Here:
$199,021State:
$218,362
Occupied boats, RVs, vans, etc.: $166,575 Here:
$166,575State:
$159,523
Total population: 205,159 (Urban population: 193,050, Rural population: 127 (all nonfarm) )
Houses: 97,934 (91,951 occupied: 51,688 owner occupied, 40,263 renter occupied )
% of renters here:
44%State:
36%
Housing density: 1,956 houses/condos per square mile
Median price asked for vacant for-sale houses and condos in 2022: $492,358.
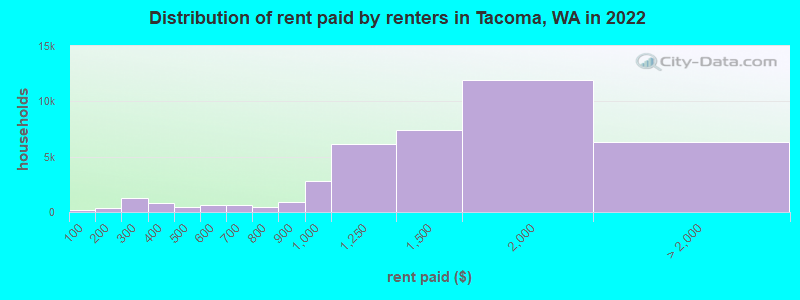
Median contract rent in 2022: $1,426 (lower quartile is $1,059, upper quartile is $1,823)
Median rent asked for vacant for-rent units in 2022: $1,841
Median gross rent in Tacoma, WA in 2022: $1,575
Housing units in Tacoma with a mortgage: 37,404 (3,535 second mortgage, 198 home equity loan, 2,502 both second mortgage and home equity loan )Houses without a mortgage: 1,051
Median household income for houses/condos with a mortgage: $122,337
Median household income for apartments without a mortgage: $75,649
Median monthly housing costs: $1,655
Data:
Median house or condo value ($)
Median house or condo value ($ change since 2000)
Median house or condo value ($) - White
Median house or condo value ($) - Black or African American
Median house or condo value ($) - Asian
Median house or condo value ($) - Hispanic or Latino
Median house or condo value ($) - American Indian and Alaska Native
Median house or condo value ($) - Multirace
Median house or condo value ($) - Other Race
Median price asked for mobile homes ($)
Household density (households per square mile)
Mean house or condo value by units in structure - 1, detached ($)
Mean house or condo value by units in structure - 1, attached ($)
Mean house or condo value by units in structure - 2 ($)
Mean house or condo value by units in structure by units in structure - 3 or 4 ($)
Mean house or condo value by units in structure - 5 or more ($)
Mean house or condo value by units in structure - Boat, RV, van, etc. ($)
Mean house or condo value by units in structure - Mobile home ($)
Median contract rent ($)
Median contract rent - Lower quartile ($)
Median contract rent - Upper quartile ($)
Median gross rent ($)
Urban houses (%)
Rural houses (%)
Houses occupied (%)
Houses occupied (% change since 2000)
Houses owner occupied (%)
Houses owner occupied (% change since 2000)
Houses renter occupied (%)
Houses renter occupied (% change since 2000)
Vacant housing units - For rent (%)
Vacant housing units - For rent (% change since 2000)
Vacant housing units - For sale only (%)
Vacant housing units - For sale only (% change since 2000)
Vacant housing units - Rented or sold, not occupied (%)
Vacant housing units - Rented or sold, not occupied (% change since 2000)
Vacant housing units - For seasonal, recreational, or occasional use (%)
Vacant housing units - For seasonal, recreational, or occasional use (% change since 2000)
Vacant housing units - For migrant workers (%)
Vacant housing units - For migrant workers (% change since 2000)
Vacant housing units - Other vacant (%)
Vacant housing units - Other vacant (% change since 2000)
Median monthly housing costs ($)
Median household income for houses/condos with a mortgage ($)
Median household income for houses/condos without a mortgage ($)
Median household income ($)
Median household income ($) - White
Median household income ($) - Black or African American
Median household income ($) - Asian
Median household income ($) - Hispanic or Latino
Median household income ($) - American Indian and Alaska Native
Median household income ($) - Multirace
Median household income ($) - Other Race
Mortgage status - with mortgage (%)
Mortgage status - with second mortgage (%)
Mortgage status - with home equity loan (%)
Mortgage status - with both second mortgage and home equity loan (%)
Mortgage status - without a mortgage (%)
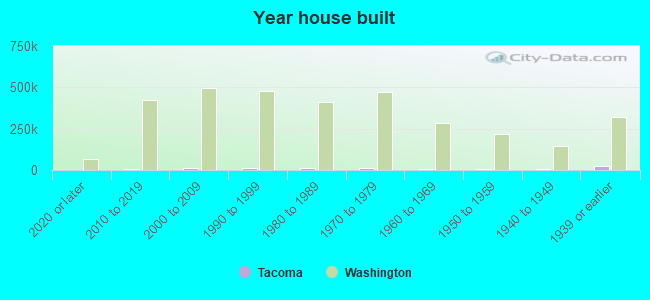
Median year house/condo built
Median year apartment built
Household type by relationship - Male householder living alone (%)
Household type by relationship - Male householder not living alone (%)
Household type by relationship - Female householder living alone (%)
Household type by relationship - Female householder not living alone (%)
Household type by relationship - Opposite-Sex spouse (%)
Household type by relationship - Same-Sex spouse (%)
Household type by relationship - Opposite-Sex unmarried partner (%)
Household type by relationship - Same-Sex unmarried partner (%)
Household type by relationship - In group quarters (%)
Size of family households - 2-person household (%)
Size of family households - 3-person household (%)
Size of family households - 4-person household (%)
Size of family households - 5-person household (%)
Size of family households - 6-person household (%)
Size of family households - 7-or-more-person household (%)
Size of nonfamily households - 1-person household (%)
Size of nonfamily households - 2-person household (%)
Size of nonfamily households - 3-person household (%)
Size of nonfamily households - 4-person household (%)
Size of nonfamily households - 5-person household (%)
Size of nonfamily households - 6-person household (%)
Size of nonfamily households - 7-or-moreperson household (%)
Year house built - Built 2010 or later (%)
Year house built - Built 2000 to 2009 (%)
Year house built - Built 1990 to 1999 (%)
Year house built - Built 1980 to 1989 (%)
Year house built - Built 1970 to 1979 (%)
Year house built - Built 1960 to 1969 (%)
Year house built - Built 1950 to 1959 (%)
Year house built - Built 1940 to 1949 (%)
Year house built - Built 1939 or earlier (%)
Median number of rooms in houses and condos
Median number of rooms in apartments
Median number of bedrooms in owner occupied houses
Mean number of bedrooms in owner occupied houses
Median number of bedrooms in renter occupied houses
Mean number of bedrooms in renter occupied houses
Median number of vehichles in owner occupied houses
Mean number of vehichles in owner occupied houses
Median number of vehichles in renter occupied houses
Mean number of vehichles in renter occupied houses
Rooms in owner-occupied houses - 1 room (%)
Rooms in owner-occupied houses - 2 rooms (%)
Rooms in owner-occupied houses - 3 rooms (%)
Rooms in owner-occupied houses - 4 rooms (%)
Rooms in owner-occupied houses - 5 rooms (%)
Rooms in owner-occupied houses - 6 rooms (%)
Rooms in owner-occupied houses - 7 rooms (%)
Rooms in owner-occupied houses - 8 rooms (%)
Rooms in owner-occupied houses - 9+ rooms (%)
Rooms in renter-occupied houses - 1 room (%)
Rooms in renter-occupied houses - 2 rooms (%)
Rooms in renter-occupied houses - 3 rooms (%)
Rooms in renter-occupied houses - 4 rooms (%)
Rooms in renter-occupied houses - 5 rooms (%)
Rooms in renter-occupied houses - 6 rooms (%)
Rooms in renter-occupied houses - 7 rooms (%)
Rooms in renter-occupied houses - 8 rooms (%)
Rooms in renter-occupied houses - 9+ rooms (%)
Bedrooms in owner-occupied houses - no bedrooms (%)
Bedrooms in owner-occupied houses - 1 bedroom (%)
Bedrooms in owner-occupied houses - 2 bedrooms (%)
Bedrooms in owner-occupied houses - 3 bedrooms (%)
Bedrooms in owner-occupied houses - 4 bedrooms (%)
Bedrooms in owner-occupied houses - 5+ bedrooms (%)
Bedrooms in renter-occupied houses - no bedrooms (%)
Bedrooms in renter-occupied houses - 1 bedroom (%)
Bedrooms in renter-occupied houses - 2 bedrooms (%)
Bedrooms in renter-occupied houses - 3 bedrooms (%)
Bedrooms in renter-occupied houses - 4 bedrooms (%)
Bedrooms in renter-occupied houses - 5+ bedrooms (%)
Vehicles available in owner-occupied houses - no vehicle available (%)
Vehicles available in owner-occupied houses - 1 vehicle available(%)
Vehicles available in owner-occupied houses - 2 Vehicles available (%)
Vehicles available in owner-occupied houses - 3 Vehicles available (%)
Vehicles available in owner-occupied houses - 4 Vehicles available (%)
Vehicles available in owner-occupied houses - 5+ Vehicles available (%)
Vehicles available in renter-occupied houses - no vehicle available (%)
Vehicles available in renter-occupied houses - 1 vehicle available (%)
Vehicles available in renter-occupied houses - 2 Vehicles available (%)
Vehicles available in renter-occupied houses - 3 Vehicles available (%)
Vehicles available in renter-occupied houses - 4 Vehicles available (%)
Vehicles available in renter-occupied houses - 5+ Vehicles available (%)
Housing units in structures - 1, detached (%)
Housing units in structures - 1, attached (%)
Housing units in structures - 2 (%)
Housing units in structures - 3 or 4 (%)
Housing units in structures - 5 to 9 (%)
Housing units in structures - 10 to 19 (%)
Housing units in structures - 20 to 49 (%)
Housing units in structures - 50 or more (%)
Housing units in structures - Mobile home (%)
Housing units in structures - Boat, RV, van, etc. (%)
Housing units in structures - Owners - 1, detached (%)
Housing units in structures - Owners - 1, attached (%)
Housing units in structures - Owners - 2 (%)
Housing units in structures - Owners - 3 or 4 (%)
Housing units in structures - Owners - 5 to 9 (%)
Housing units in structures - Owners - 10 to 19 (%)
Housing units in structures - Owners - 20 to 49 (%)
Housing units in structures - Owners - 50 or more (%)
Housing units in structures - Owners - Mobile home (%)
Housing units in structures - Owners - Boat, RV, van, etc. (%)
Housing units in structures - Renters - 1, detached (%)
Housing units in structures - Renters - 1, attached (%)
Housing units in structures - Renters - 2 (%)
Housing units in structures - Renters - 3 or 4 (%)
Housing units in structures - Renters - 5 to 9 (%)
Housing units in structures - Renters - 10 to 19 (%)
Housing units in structures - Renters - 20 to 49 (%)
Housing units in structures - Renters - 50 or more (%)
Housing units in structures - Renters - Mobile home (%)
Housing units in structures - Renters - Boat, RV, van, etc. (%)
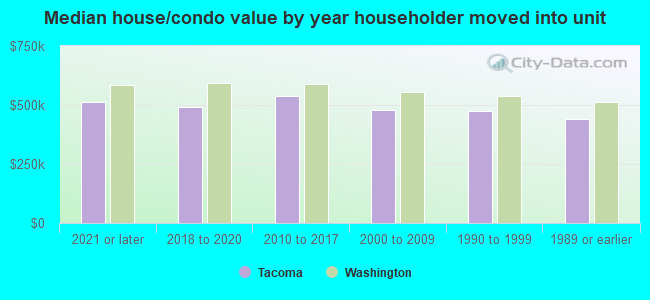
House/condo owner moved in on average (years ago)
Renter moved in on average (years ago)
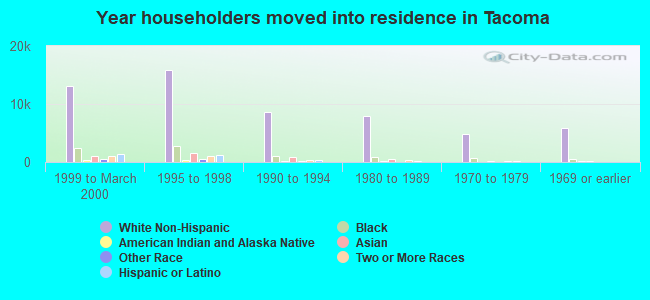
Year householder moved into unit - Moved in 1999 to March 2000 (%)
Year householder moved into unit - Moved in 1999 to March 2000 (%) - White
Year householder moved into unit - Moved in 1999 to March 2000 (%) - Black or African American
Year householder moved into unit - Moved in 1999 to March 2000 (%) - Asian
Year householder moved into unit - Moved in 1999 to March 2000 (%) - Hispanic or Latino
Year householder moved into unit - Moved in 1999 to March 2000 (%) - American Indian and Alaska Native
Year householder moved into unit - Moved in 1999 to March 2000 (%) - Multirace
Year householder moved into unit - Moved in 1999 to March 2000 (%) - Other Race
Year householder moved into unit - Moved in 1995 to 1998 (%)
Year householder moved into unit - Moved in 1995 to 1998 (%) - White
Year householder moved into unit - Moved in 1995 to 1998 (%) - Black or African American
Year householder moved into unit - Moved in 1995 to 1998 (%) - Asian
Year householder moved into unit - Moved in 1995 to 1998 (%) - Hispanic or Latino
Year householder moved into unit - Moved in 1995 to 1998 (%) - American Indian and Alaska Native
Year householder moved into unit - Moved in 1995 to 1998 (%) - Multirace
Year householder moved into unit - Moved in 1995 to 1998 (%) - Other Race
Year householder moved into unit - Moved in 1990 to 1994 (%)
Year householder moved into unit - Moved in 1990 to 1994 (%) - White
Year householder moved into unit - Moved in 1990 to 1994 (%) - Black or African American
Year householder moved into unit - Moved in 1990 to 1994 (%) - Asian
Year householder moved into unit - Moved in 1990 to 1994 (%) - Hispanic or Latino
Year householder moved into unit - Moved in 1990 to 1994 (%) - American Indian and Alaska Native
Year householder moved into unit - Moved in 1990 to 1994 (%) - Multirace
Year householder moved into unit - Moved in 1990 to 1994 (%) - Other Race
Year householder moved into unit - Moved in 1980 to 1989 (%)
Year householder moved into unit - Moved in 1980 to 1989 (%) - White
Year householder moved into unit - Moved in 1980 to 1989 (%) - Black or African American
Year householder moved into unit - Moved in 1980 to 1989 (%) - Asian
Year householder moved into unit - Moved in 1980 to 1989 (%) - Hispanic or Latino
Year householder moved into unit - Moved in 1980 to 1989 (%) - American Indian and Alaska Native
Year householder moved into unit - Moved in 1980 to 1989 (%) - Multirace
Year householder moved into unit - Moved in 1980 to 1989 (%) - Other Race
Year householder moved into unit - Moved in 1970 to 1979 (%)
Year householder moved into unit - Moved in 1970 to 1979 (%) - White
Year householder moved into unit - Moved in 1970 to 1979 (%) - Black or African American
Year householder moved into unit - Moved in 1970 to 1979 (%) - Asian
Year householder moved into unit - Moved in 1970 to 1979 (%) - Hispanic or Latino
Year householder moved into unit - Moved in 1970 to 1979 (%) - American Indian and Alaska Native
Year householder moved into unit - Moved in 1970 to 1979 (%) - Multirace
Year householder moved into unit - Moved in 1970 to 1979 (%) - Other Race
Year householder moved into unit - Moved in 1969 or earlier (%)
Year householder moved into unit - Moved in 1969 or earlier (%) - White
Year householder moved into unit - Moved in 1969 or earlier (%) - Black or African American
Year householder moved into unit - Moved in 1969 or earlier (%) - Asian
Year householder moved into unit - Moved in 1969 or earlier (%) - Hispanic or Latino
Year householder moved into unit - Moved in 1969 or earlier (%) - American Indian and Alaska Native
Year householder moved into unit - Moved in 1969 or earlier (%) - Multirace
Year householder moved into unit - Moved in 1969 or earlier (%) - Other Race
Housing units lacking complete plumbing facilities (%)
Housing units lacking complete kitchen facilities (%)
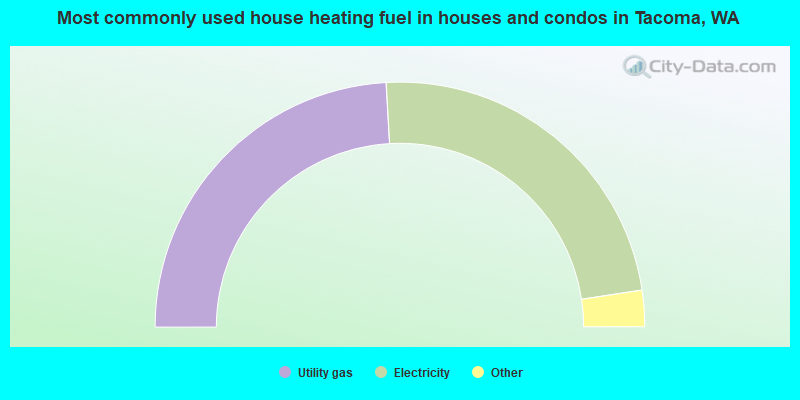
House heating fuel used in houses and condos - Utility gas (%)
House heating fuel used in houses and condos - Bottled, tank, or LP gas (%)
House heating fuel used in houses and condos - Electricity (%)
House heating fuel used in houses and condos - Fuel oil, kerosene, etc. (%)
House heating fuel used in houses and condos - Coal or coke (%)
House heating fuel used in houses and condos - Wood (%)
House heating fuel used in houses and condos - Solar energy (%)
House heating fuel used in houses and condos - Other fuel (%)
House heating fuel used in houses and condos - No fuel used (%)
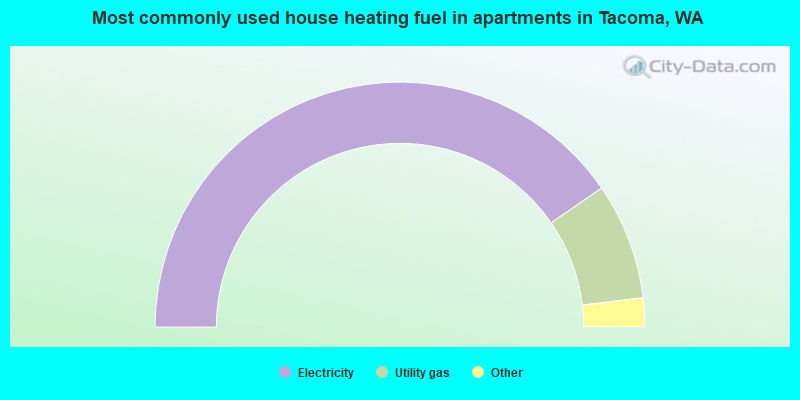
House heating fuel used in apartments - Utility gas (%)
House heating fuel used in apartments - Bottled, tank, or LP gas (%)
House heating fuel used in apartments - Electricity (%)
House heating fuel used in apartments - Fuel oil, kerosene, etc. (%)
House heating fuel used in apartments - Coal or coke (%)
House heating fuel used in apartments - Wood (%)
House heating fuel used in apartments - Solar energy (%)
House heating fuel used in apartments - Other fuel (%)
House heating fuel used in apartments - No fuel used (%)
Latest news about housing in Tacoma, WA collected exclusively by city-data.com from local newspapers, TV, and radio stations
Median year house/condo built: 1958Median year apartment built: 1976Household type by relationship:
Households: 221,790
Male householders: 45,297 (12,001 living alone ), Female householders: 46,654 (16,256 living alone )37,390 spouses (36,236 opposite-sex spouses ), 10,230 unmarried partners , (9,650 opposite-sex unmarried partners ), 50,877 children (47,179 natural , 1,163 adopted , 2,535 stepchildren ), 3,387 grandchildren , 2,450 brothers or sisters , 2,457 parents , 641 foster children , 3,802 other relatives , 12,920 non-relatives In group quarters: 5,685
Size of family households: 25,656 2-persons , 12,385 3-persons , 9,327 4-persons , 3,213 5-persons , 1,847 6-persons , 1,254 7-or-more-persons .
Size of nonfamily households: 28,257 1-person , 8,375 2-persons , 898 3-persons , 370 4-persons , 369 7-or-more-persons .
25,522 married couples with children. single-parent households (4,696 men , 7,902 women ).
83.4% of residents of Tacoma speak English at home. of residents speak Spanish at home (69% speak English very well , 23% speak English well , 7% speak English not well , 1% don't speak English at all ).of residents speak other Indo-European language at home (66% speak English very well , 13% speak English well , 17% speak English not well , 4% don't speak English at all ).of residents speak Asian or Pacific Island language at home (52% speak English very well , 20% speak English well , 26% speak English not well , 2% don't speak English at all ).of residents speak other language at home (53% speak English very well , 37% speak English well , 9% speak English not well , 1% don't speak English at all ).
Foreign born population: 26,630 (12.0%)of them are naturalized citizens )
Median number of rooms in houses and condos:
Median number of rooms in apartments
Owner-occupied Renter-occupied
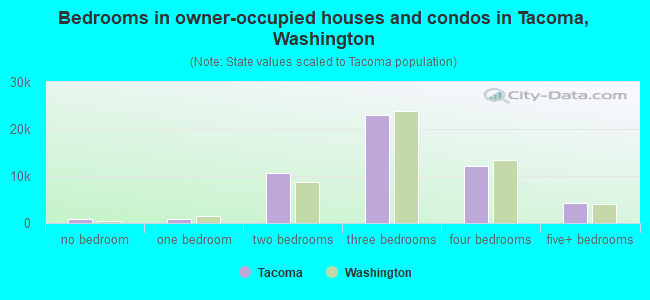
Bedrooms in owner-occupied houses and condos in Tacoma, Washington
921 no bedroom 892 1 bedroom 10,597 2 bedrooms 22,900 3 bedrooms 12,195 4 bedrooms 4,183 5+ bedrooms
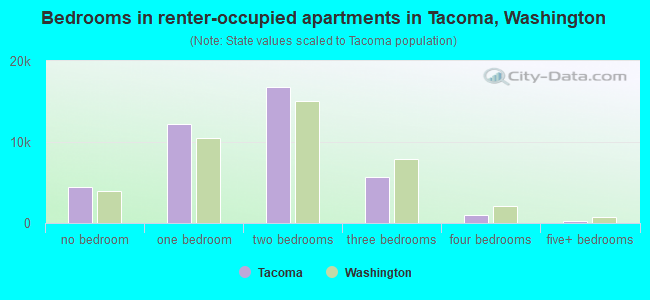
Bedrooms in renter-occupied apartments in Tacoma, Washington
4,426 no bedroom 12,248 1 bedroom 16,790 2 bedrooms 5,640 3 bedrooms 954 4 bedrooms 205 5+ bedrooms
Owner-occupied Renter-occupied
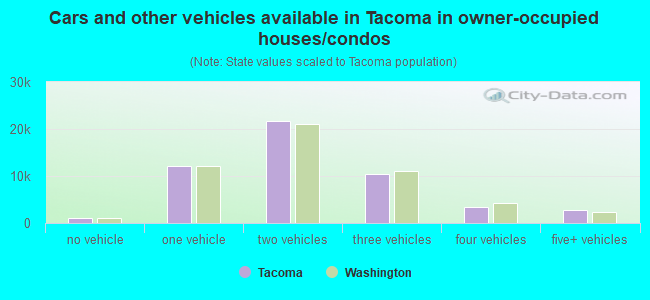
Cars and other vehicles available in Tacoma in owner-occupied houses/condos
1,119 no vehicle 12,196 1 vehicle 21,774 2 vehicles 10,424 3 vehicles 3,407 4 vehicles 2,768 5+ vehicles
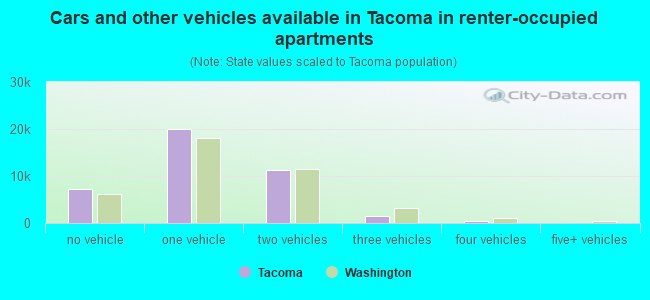
Cars and other vehicles available in Tacoma in renter-occupied apartments
7,196 no vehicle 20,051 1 vehicle 11,181 2 vehicles 1,480 3 vehicles 355 4 vehicles 0 5+ vehicles
Owner-occupied Renter-occupied
Rooms in owner-occupied houses in Tacoma, Washington
702 1 room 177 2 rooms 1,322 3 rooms 6,059 4 rooms 8,293 5 rooms 12,799 6 rooms 8,469 7 rooms 5,631 8 rooms 8,236 9+ rooms
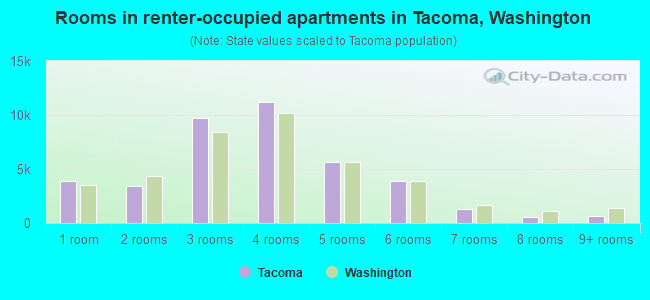
Rooms in renter-occupied apartments in Tacoma, Washington
3,861 1 room 3,386 2 rooms 9,749 3 rooms 11,224 4 rooms 5,602 5 rooms 3,920 6 rooms 1,309 7 rooms 558 8 rooms 654 9+ rooms
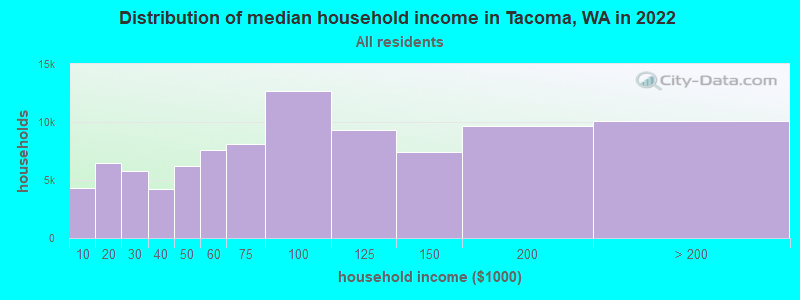
Tacoma, WA household income distribution 4,310 Less than $10,0006,428 $10,000 to $19,9995,762 $20,000 to $29,9994,239 $30,000 to $39,9996,237 $40,000 to $49,9997,551 $50,000 to $59,9998,141 $60,000 to $74,99912,682 $75,000 to $99,9999,342 $100,000 to $124,9997,451 $125,000 to $149,9999,680 $150,000 to $199,99910,128 $200,000 or more
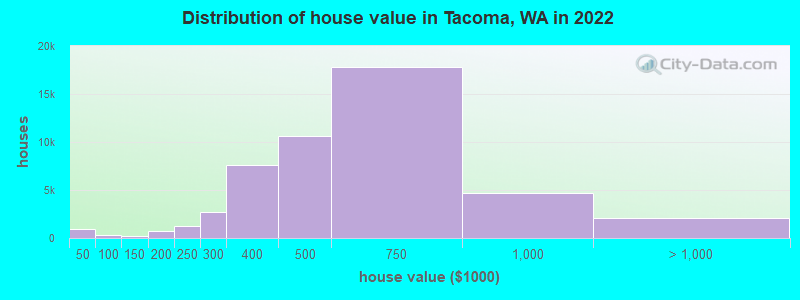
Home value of owner - occupied houses in 2022 in Tacoma, WA 414 Less than $10,00013 $10,000 to $14,99966 $15,000 to $19,99966 $20,000 to $24,99966 $25,000 to $29,99977 $30,000 to $34,999153 $35,000 to $39,99960 $40,000 to $49,999126 $50,000 to $59,99924 $60,000 to $69,99941 $70,000 to $79,99918 $80,000 to $89,99949 $90,000 to $99,999119 $100,000 to $124,999125 $125,000 to $149,999280 $150,000 to $174,999407 $175,000 to $199,9991,227 $200,000 to $249,9992,756 $250,000 to $299,9997,624 $300,000 to $399,99910,618 $400,000 to $499,99917,820 $500,000 to $749,9994,719 $750,000 to $999,9991,676 $1,000,000 to $1,499,999152 $1,500,000 to $1,999,999262 $2,000,000 or moreRent paid by renters in 2022 in Tacoma, WA 175 Less than $10070 $100 to $149298 $150 to $199959 $200 to $249295 $250 to $299533 $300 to $349282 $350 to $399205 $400 to $449273 $450 to $499358 $500 to $549248 $550 to $599204 $600 to $649403 $650 to $699178 $700 to $749239 $750 to $799915 $800 to $8992,826 $900 to $9996,167 $1,000 to $1,2497,414 $1,250 to $1,49911,931 $1,500 to $1,9993,325 $2,000 to $2,4991,212 $2,500 to $2,9991,078 $3,000 to $3,49979 $3,500 or more596 No cash rent
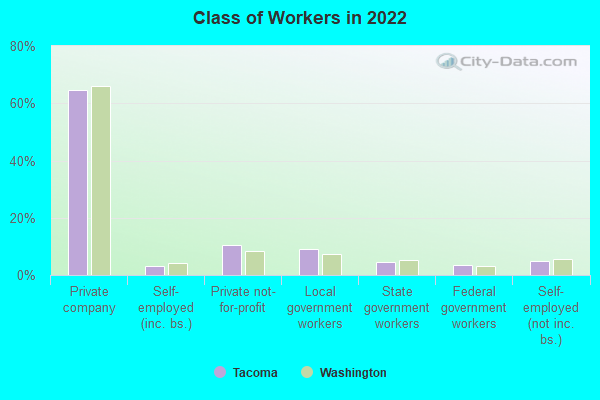
Percentage of workers working in this county: 75.6%Number of people working at home: 17,880 (16.5% of all workers )
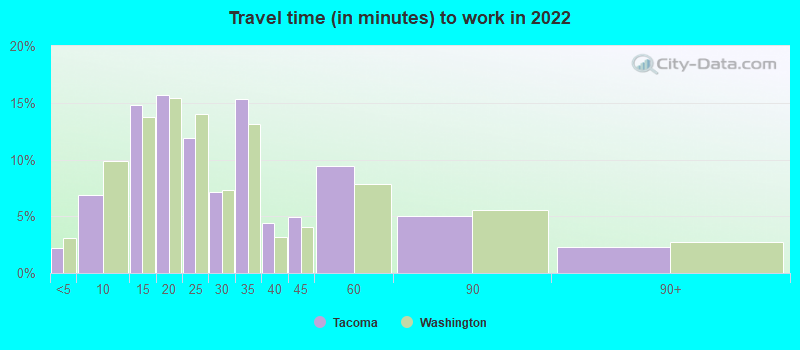
Travel time to work (commute)
Less than 5 minutes: 2,6565 to 9 minutes: 6,96210 to 14 minutes: 12,57615 to 19 minutes: 16,29120 to 24 minutes: 11,95925 to 29 minutes: 5,49830 to 34 minutes: 11,13935 to 39 minutes: 4,31840 to 44 minutes: 3,50545 to 59 minutes: 7,63060 to 89 minutes: 5,10290 or more minutes: 2,812
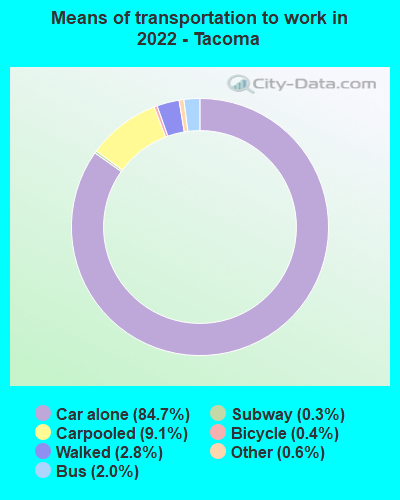
Means of transportation to work:
Drove a car alone: 87,154 (72.1%)Carpooled: 9,413 (7.8%)Bus : 2,108 (1.7%)Long-distance train or commuter rail : 306 (0.3%)Light rail, streetcar or trolley : 86 (0.1%)Taxi: 582 (0.5%)Bicycle: 387 (0.3%)Walked: 2,921 (2.4%)Worked at home: 17,880 (14.8%)
Unemployment by race in 2022
Unemployment rate for White non-Hispanic residents 6.0% Males4.1% FemalesUnemployment rate for Black residents 13.2% Males8.2% FemalesUnemployment rate for American Indian and Alaska Native residents 4.9% Males4.7% FemalesUnemployment rate for Asian residents 5.4% Males2.8% FemalesUnemployment rate for other race residents 6.5% Males3.0% FemalesUnemployment rate for two or more race residents 9.4% Males4.7% FemalesUnemployment rate for Hispanic or Latino residents 11.9% Males11.1% Females
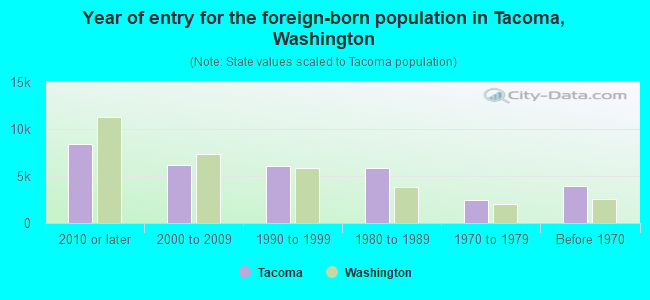
Year of entry for the foreign-born population in Tacoma, Washington
8,428 2010 or later 6,218 2000 to 2009 6,053 1990 to 1999 5,872 1980 to 1989 2,488 1970 to 1979 3,985 Before 1970
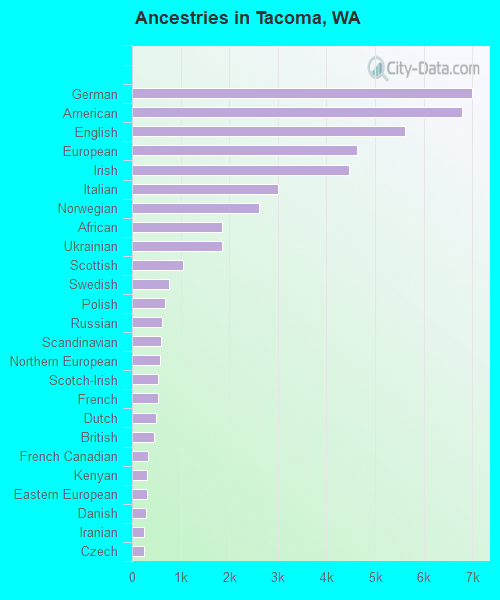
First ancestries reported:
German: 6,993 (7.0%)
American: 6,797 (6.8%)
English: 5,621 (5.7%)
European: 4,623 (4.6%)
Irish: 4,473 (4.5%)
Italian: 3,009 (3.0%)
Norwegian: 2,605 (2.6%)
African: 1,851 (1.9%)
Ukrainian: 1,851 (1.9%)
Scottish: 1,050 (1.1%)
Swedish: 770 (0.8%)
Polish: 669 (0.7%)
Russian: 618 (0.6%)
Scandinavian: 595 (0.6%)
Northern European: 567 (0.6%)
Scotch-Irish: 544 (0.5%)
French: 525 (0.5%)
Dutch: 498 (0.5%)
British: 462 (0.5%)
French Canadian: 331 (0.3%)
Kenyan: 307 (0.3%)
Eastern European: 300 (0.3%)
Danish: 287 (0.3%)
Iranian: 255 (0.3%)
Czech: 238 (0.2%)
Canadian: 230 (0.2%)
Nigerian: 218 (0.2%)
Jamaican: 215 (0.2%)
Romanian: 212 (0.2%)
Finnish: 161 (0.2%)
Ethiopian: 160 (0.2%)
Icelander: 158 (0.2%)
Croatian: 158 (0.2%)
Welsh: 131 (0.1%)
Trinidadian and Tobagonian: 107 (0.1%)
Ugandan: 96 (0.10%)
Belizean: 95 (0.10%)
Greek: 87 (0.09%)
Brazilian: 82 (0.08%)
British West Indian: 80 (0.08%)
Bulgarian: 64 (0.06%)
Swiss: 62 (0.06%)
South African: 51 (0.05%)
Somali: 47 (0.05%)
Liberian: 46 (0.05%)
Hungarian: 40 (0.04%)
West Indian: 37 (0.04%)
Slovak: 36 (0.04%)
Afghan: 34 (0.03%)
Lithuanian: 34 (0.03%)
Austrian: 32 (0.03%)
Australian: 28 (0.03%)
Celtic: 28 (0.03%)
Turkish: 27 (0.03%)
Yugoslavian: 27 (0.03%)
Albanian: 26 (0.03%)
Portuguese: 25 (0.03%)
Lebanese: 20 (0.02%)
German Russian: 20 (0.02%)
Belgian: 20 (0.02%)
Slovene: 17 (0.02%)
Basque: 15 (0.02%)
Carpatho Rusyn: 14 (0.01%)
Barbadian: 14 (0.01%)
Estonian: 13 (0.01%)
Armenian: 12 (0.01%)
Palestinian: 12 (0.01%)
Slavic: 12 (0.01%)
Latvian: 10 (0.01%)
Czechoslovakian: 9 (0.01%)
Assyrian: 7 (0.01%)
Arab: 5 (0.01%)
Most common places of birth for foreign-born residents (%): Mexico Tacoma:
16.2% (4,483)Washington:
21.1% (241,655)
Vietnam Tacoma:
11.8% (3,264)Washington:
5.4% (62,003)
Korea Tacoma:
7.4% (2,060)Washington:
4.3% (48,886)
Philippines Tacoma:
6.9% (1,919)Washington:
6.3% (71,661)
Ukraine Tacoma:
5.4% (1,503)Washington:
3.1% (35,872)
Cambodia Tacoma:
4.5% (1,250)Washington:
1.0% (10,993)
China, excluding Hong Kong and Taiwan Tacoma:
3.3% (924)Washington:
7.4% (84,470)
Canada Tacoma:
3.1% (858)Washington:
4.1% (47,238)
Russia Tacoma:
3.0% (818)Washington:
1.9% (21,540)
Kenya Tacoma:
2.8% (764)Washington:
1.1% (12,735)
Germany Tacoma:
2.3% (645)Washington:
1.6% (17,761)
Thailand Tacoma:
2.0% (555)Washington:
0.9% (9,937)
India Tacoma:
1.8% (507)Washington:
8.9% (101,353)
Laos Tacoma:
1.7% (484)Washington:
0.5% (5,926)
Japan Tacoma:
1.6% (453)Washington:
1.5% (17,453)
Place of birth for U.S.-born residents:
This state: 107,911Other state: 82,005Northeast: 8,945Midwest: 16,762South: 19,159West: 37,139 82.8% of Tacoma residents lived in the same house 1 years ago.
Out of people who lived in different houses, 32.8% lived in this county.
Out of people who lived in different counties, 53.5% lived in Washington.
Tacoma:
82.8%State average:
85.2%
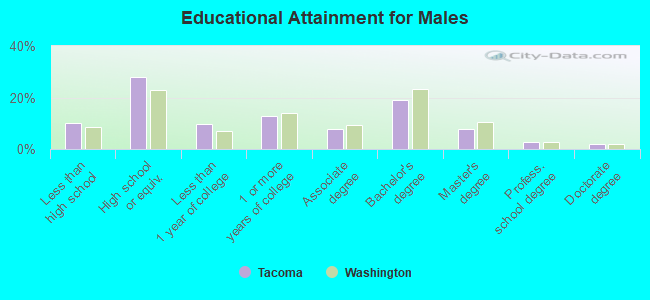
Education attainment for males 25 years and older:
No schooling: 1,749Nursery to 4th grade: 255th and 6th grade: 6927th and 8th grade: 4539th grade: 25010th grade: 29111th grade: 2,56812th grade, no diploma: 1,936High school graduate (or equivalency): 21,930Less than 1 year of college: 7,449Some college more than 1 year, no degree: 10,059Associate degree: 5,976Bachelor's degree: 14,955Master's degree: 6,202Professional school degree: 2,069Doctorate degree: 1,400
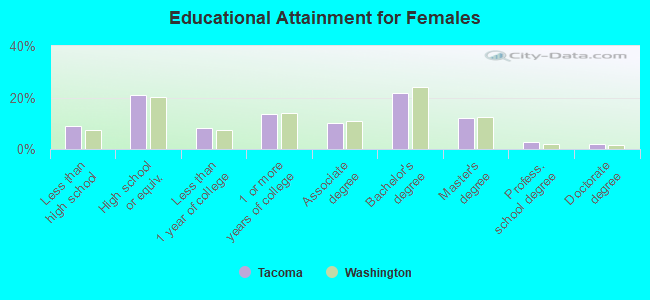
Education attainment for females 25 years and older:
No schooling: 1,749Nursery to 4th grade: 3495th and 6th grade: 8237th and 8th grade: 3589th grade: 12810th grade: 1,01611th grade: 79712th grade, no diploma: 1,901High school graduate (or equivalency): 16,739Less than 1 year of college: 6,578Some college more than 1 year, no degree: 10,665Associate degree: 8,008Bachelor's degree: 17,192Master's degree: 9,501Professional school degree: 2,306Doctorate degree: 1,427
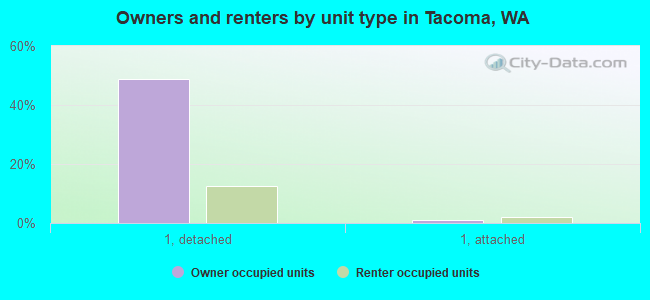
Housing units in structures:
One, detached: 58,116One, attached: 2,926Two: 2,4183 or 4: 5,7305 to 9: 6,95210 to 19: 5,88420 to 49: 6,48550 or more: 9,035Mobile homes: 326Boats, RVs, vans, etc.: 62Median worth of mobile homes: $158,300
Housing units lacking complete plumbing facilities in 2022: 0.7%Housing units lacking complete kitchen facilities in 2022: 1.8%House/condo owner moved in on average 9 years ago
Renter moved in on average 2 years ago
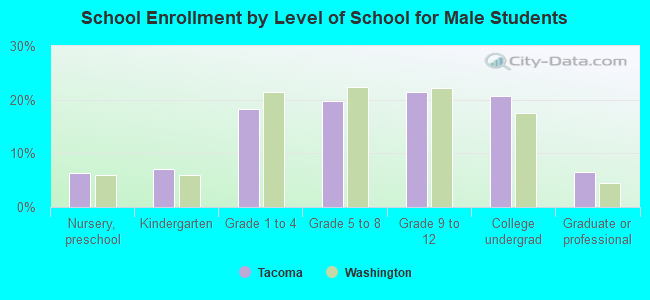
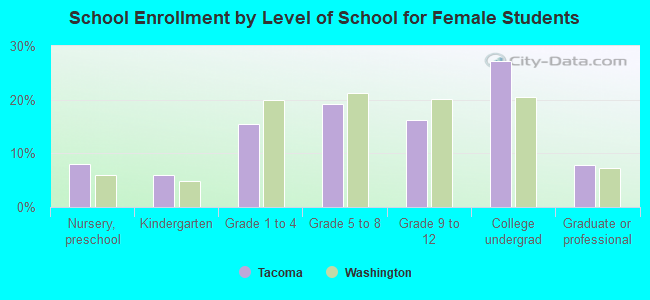
Private vs. public school enrollment:
Students in private schools in grades 1 to 8 (elementary and middle school): 2,351 Here:
13.3%Washington:
12.4%
Students in private schools in grades 9 to 12 (high school): 1,135 Here:
12.5%Washington:
9.2%
Students in private undergraduate colleges: 3,226 Here:
27.7%Washington:
16.5%