Housing density: 1,009 houses/condos per square mile
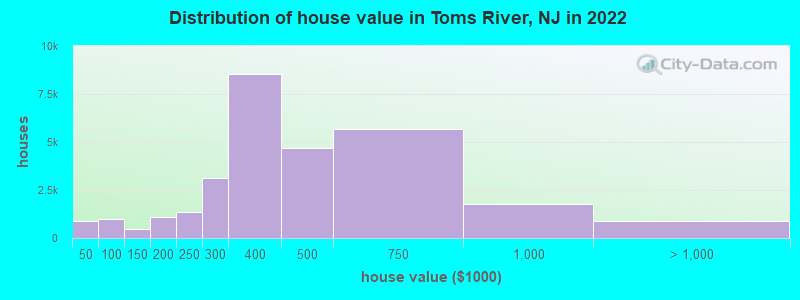
Median price asked for vacant for-sale houses and condos in 2022: $334,579.
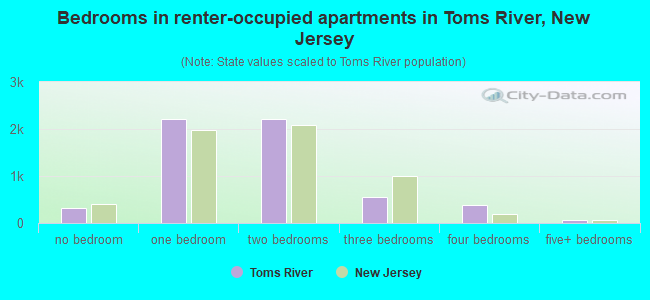
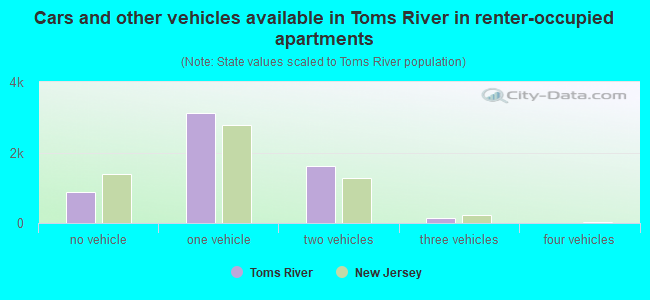
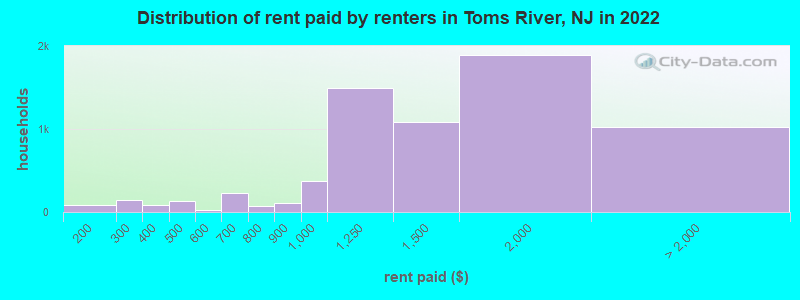
Median contract rent in 2022: $1,300 (lower quartile is $1,019, upper quartile is $1,674)
Median rent asked for vacant for-rent units in 2022: $4,851
Median gross rent in Toms River, NJ in 2022: $1,428
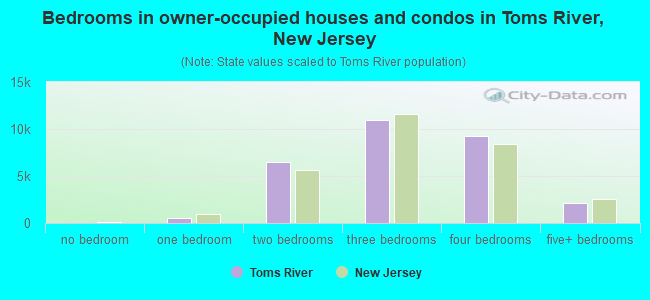
Housing units in Toms River with a mortgage: 19,215 (1,616 second mortgage, 64 home equity loan, 1,258 both second mortgage and home equity loan) Houses without a mortgage: 743
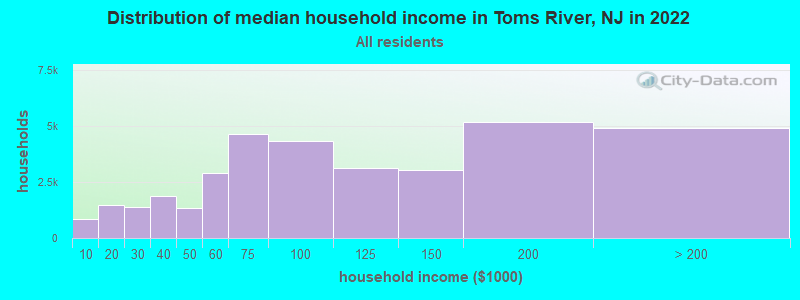
Median household income for houses/condos with a mortgage: $122,660
Median household income for apartments without a mortgage: $71,628
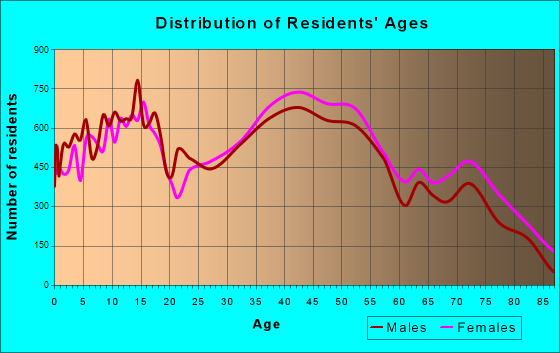
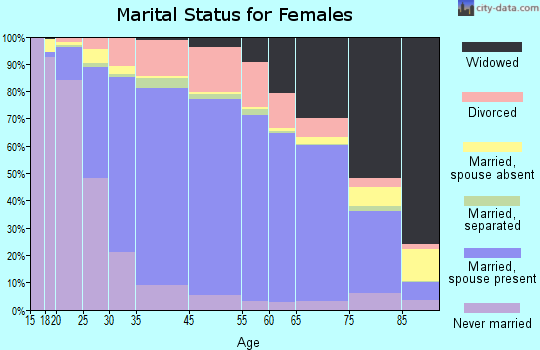
14,202 married couples with children.
5,029 single-parent households (919 men, 4,110 women).
87.7% of residents of Toms River speak English at home.
5.9% of residents speak Spanish at home (67% speak English very well, 22% speak English well, 8% speak English not well, 2% don't speak English at all).
3.0% of residents speak other Indo-European language at home (74% speak English very well, 16% speak English well, 7% speak English not well, 3% don't speak English at all).
1.9% of residents speak Asian or Pacific Island language at home (58% speak English very well, 36% speak English well, 6% speak English not well).
1.1% of residents speak other language at home (84% speak English very well, 7% speak English well, 9% speak English not well).
Foreign born population: 8,130 (8.6%)
(67.6% of them are naturalized citizens)
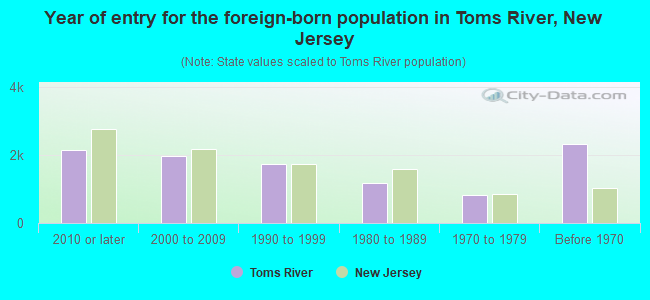
Year of entry for the foreign-born population in Toms River, New Jersey
2,1332010 or later
1,9592000 to 2009
1,7421990 to 1999
1,1821980 to 1989
8161970 to 1979
2,320Before 1970
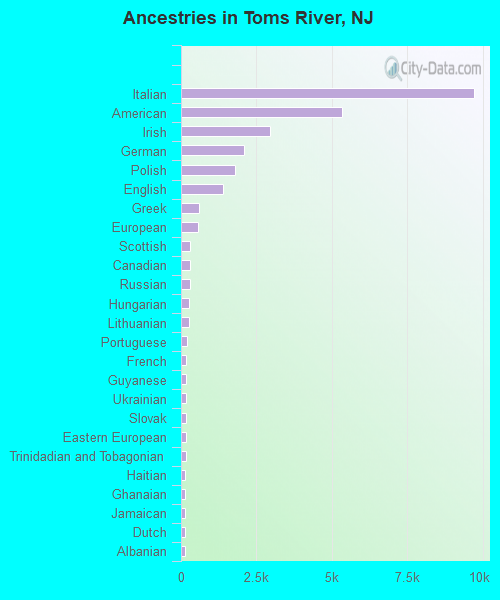
First ancestries reported:
Italian: 9,719 (24.1%)
American: 5,344 (13.2%)
Irish: 2,933 (7.3%)
German: 2,100 (5.2%)
Polish: 1,799 (4.5%)
English: 1,377 (3.4%)
Greek: 582 (1.4%)
European: 552 (1.4%)
Scottish: 306 (0.8%)
Canadian: 285 (0.7%)
Russian: 285 (0.7%)
Hungarian: 256 (0.6%)
Lithuanian: 251 (0.6%)
Portuguese: 183 (0.5%)
French: 181 (0.4%)
Guyanese: 166 (0.4%)
Ukrainian: 159 (0.4%)
Slovak: 152 (0.4%)
Eastern European: 152 (0.4%)
Trinidadian and Tobagonian: 150 (0.4%)
Haitian: 146 (0.4%)
Ghanaian: 143 (0.4%)
Jamaican: 141 (0.3%)
Dutch: 140 (0.3%)
Albanian: 116 (0.3%)
Scandinavian: 100 (0.2%)
Turkish: 99 (0.2%)
Egyptian: 90 (0.2%)
Norwegian: 88 (0.2%)
Israeli: 88 (0.2%)
Scotch-Irish: 82 (0.2%)
Swedish: 66 (0.2%)
Austrian: 59 (0.1%)
Latvian: 55 (0.1%)
Armenian: 55 (0.1%)
Lebanese: 53 (0.1%)
Czechoslovakian: 52 (0.1%)
Welsh: 49 (0.1%)
Czech: 46 (0.1%)
Iranian: 43 (0.1%)
British: 39 (0.10%)
Brazilian: 29 (0.07%)
Slavic: 28 (0.07%)
Croatian: 23 (0.06%)
Cypriot: 18 (0.04%)
African: 17 (0.04%)
French Canadian: 16 (0.04%)
Moroccan: 16 (0.04%)
Celtic: 14 (0.03%)
Bahamian: 13 (0.03%)
Pennsylvania German: 10 (0.02%)
Romanian: 10 (0.02%)
South African: 10 (0.02%)
Maltese: 9 (0.02%)
Basque: 8 (0.02%)
Danish: 7 (0.02%)
Serbian: 7 (0.02%)
Swiss: 7 (0.02%)
Northern European: 6 (0.01%)
Icelander: 4 (0.01%)
Estonian: 3 (0.01%)
Assyrian: 3 (0.01%)
Most common places of birth for foreign-born residents (%):
Philippines
Toms River:
15.0% (1,315)
New Jersey:
4.0% (85,934)
Mexico
Toms River:
6.5% (567)
New Jersey:
4.8% (102,527)
Guatemala
Toms River:
5.4% (476)
New Jersey:
2.2% (46,813)
Italy
Toms River:
5.3% (461)
New Jersey:
1.5% (33,198)
Colombia
Toms River:
5.0% (441)
New Jersey:
4.2% (90,817)
Israel
Toms River:
3.4% (297)
New Jersey:
0.5% (10,975)
El Salvador
Toms River:
3.3% (286)
New Jersey:
2.3% (48,885)
Costa Rica
Toms River:
2.8% (249)
New Jersey:
0.7% (14,848)
Greece
Toms River:
2.8% (249)
New Jersey:
0.3% (7,501)
Haiti
Toms River:
2.7% (238)
New Jersey:
2.3% (49,491)
India
Toms River:
2.7% (234)
New Jersey:
12.8% (274,609)
Germany
Toms River:
2.5% (222)
New Jersey:
0.8% (17,217)
Peru
Toms River:
2.3% (200)
New Jersey:
2.7% (58,563)
Lithuania
Toms River:
2.2% (196)
New Jersey:
0.1% (1,662)
Poland
Toms River:
2.1% (183)
New Jersey:
2.3% (48,811)
Korea
Toms River:
2.1% (180)
New Jersey:
3.3% (70,512)
Dominican Republic
Toms River:
1.9% (170)
New Jersey:
9.7% (209,055)
Guyana
Toms River:
1.9% (167)
New Jersey:
1.2% (26,173)
Ghana
Toms River:
1.9% (162)
New Jersey:
0.8% (17,949)
Spain
Toms River:
1.8% (154)
New Jersey:
0.5% (10,246)
England
Toms River:
1.7% (148)
New Jersey:
0.5% (10,886)
Turkey
Toms River:
1.6% (141)
New Jersey:
0.8% (16,778)
Cuba
Toms River:
1.6% (136)
New Jersey:
2.1% (45,435)
Georgia
Toms River:
1.6% (136)
New Jersey:
0.1% (2,747)
Place of birth for U.S.-born residents:
This state: 61,438
Other state: 24,062
Northeast: 19,885
Midwest: 790
South: 2,171
West: 1,216
88.8% of Toms River residents lived in the same house 1 years ago. Out of people who lived in different houses, 42.3% lived in this county. Out of people who lived in different counties, 57.2% lived in New Jersey.
Toms River:
88.8%
State average:
90.4%
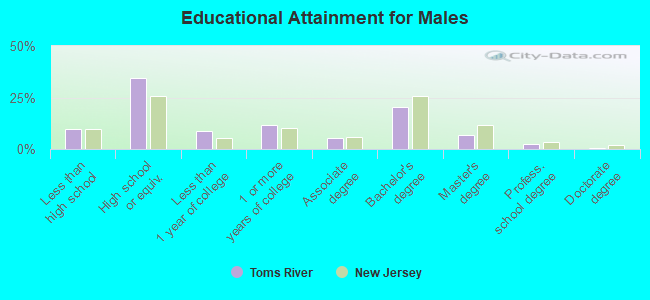
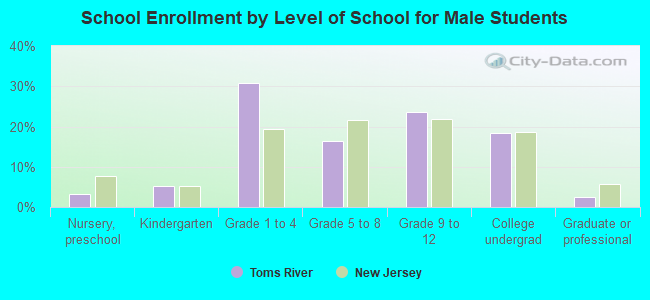
Education attainment for males 25 years and older:
No schooling: 918
Nursery to 4th grade: 109
5th and 6th grade: 101
7th and 8th grade: 152
9th grade: 505
10th grade: 413
11th grade: 360
12th grade, no diploma: 694
High school graduate (or equivalency): 11,450
Less than 1 year of college: 2,897
Some college more than 1 year, no degree: 3,806
Associate degree: 1,721
Bachelor's degree: 6,753
Master's degree: 2,207
Professional school degree: 845
Doctorate degree: 151
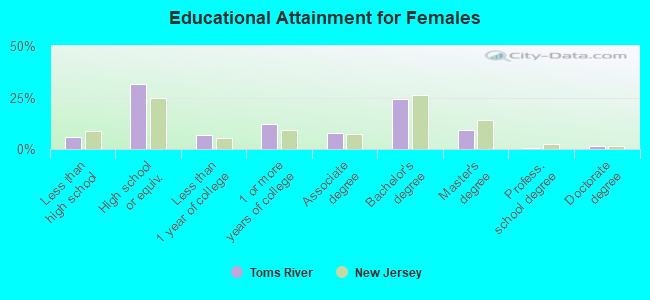
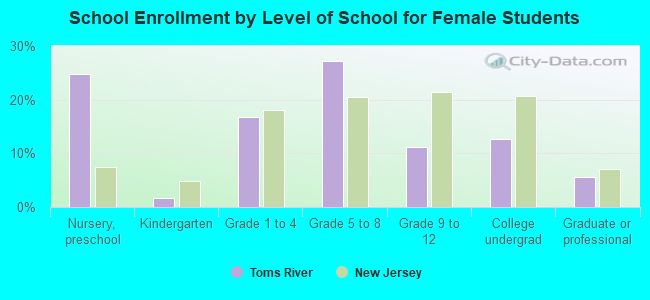
Education attainment for females 25 years and older:
No schooling: 125
Nursery to 4th grade: 56
5th and 6th grade: 231
7th and 8th grade: 334
9th grade: 56
10th grade: 490
11th grade: 189
12th grade, no diploma: 583
High school graduate (or equivalency): 11,140
Less than 1 year of college: 2,432
Some college more than 1 year, no degree: 4,263
Associate degree: 2,752
Bachelor's degree: 8,591
Master's degree: 3,305
Professional school degree: 230
Doctorate degree: 438
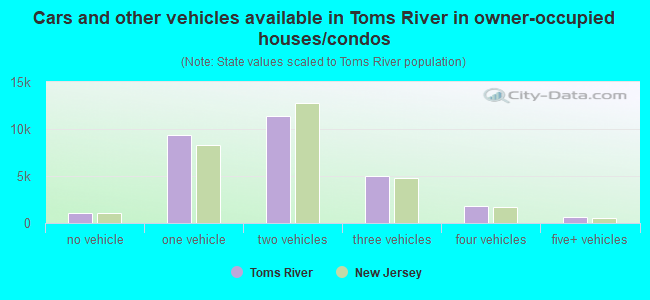
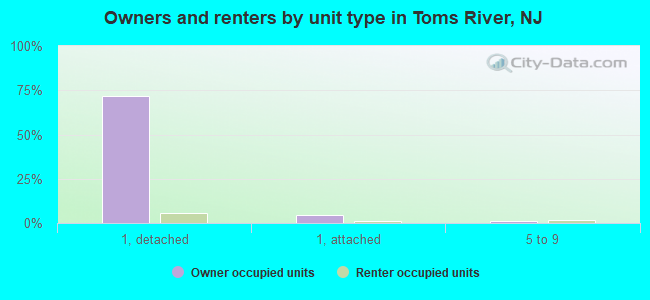
Housing units in structures:
One, detached: 31,292
One, attached: 2,371
Two: 377
3 or 4: 619
5 to 9: 1,016
10 to 19: 1,111
20 to 49: 525
50 or more: 1,458
Mobile homes: 971
Median worth of mobile homes: $160,900
Housing units lacking complete plumbing facilities in 2022: 0.6%
Housing units lacking complete kitchen facilities in 2022: 0.5%
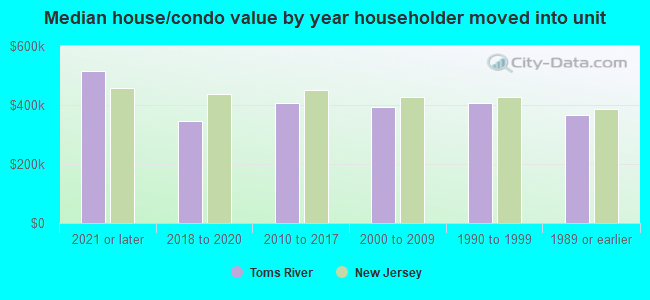
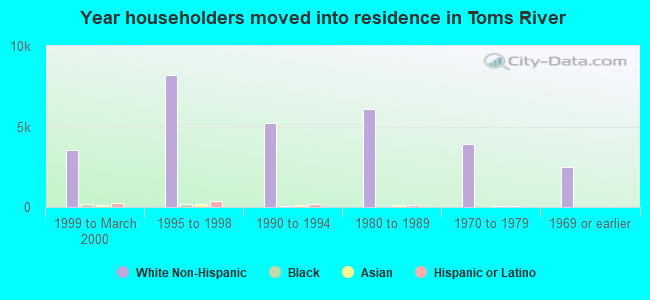
House/condo owner moved in on average 10 years ago