Wanaque, NJ (New Jersey) Houses and Residents
| Wanaque: | $367,755 |
| New Jersey: | $428,900 |
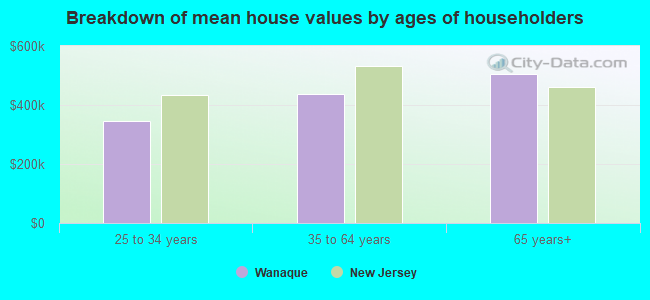
Mean price in 2022:
Detached houses: $356,206
Here: $356,206 State: $537,591 Townhouses or other attached units: $318,565
Here: $318,565 State: $381,113 In 2-unit structures: $401,545
Here: $401,545 State: $444,476 In 3-to-4-unit structures: $351,157
Here: $351,157 State: $457,463 In 5-or-more-unit structures: $399,972
Here: $399,972 State: $368,745
Total population: 11,447 (Urban population: 10,085, Rural population: 181 (all nonfarm))
Houses: 4,443 (4,292 occupied: 3,321 owner occupied, 1,005 renter occupied)
| % of renters here: | 23% |
| State: | 35% |
Housing density: 557 houses/condos per square mile
Median price asked for vacant for-sale houses and condos in 2022: $555,065.
Median contract rent in 2022: $1,594 (lower quartile is $1,159, upper quartile is over $2,000)
Median gross rent in Wanaque, NJ in 2022: $1,794
Housing units in Wanaque with a mortgage: 2,227 (343 second mortgage, 0 home equity loan, 272 both second mortgage and home equity loan)
Houses without a mortgage: 121
Median household income for houses/condos with a mortgage: $114,604
Median household income for apartments without a mortgage: $87,466
Median monthly housing costs: $1,981
Compare current foreclosures near Wanaque, NJ:
| Photo | Address | Area | Beds / Baths | Price | Details |
|---|---|---|---|---|---|

|
#1
Warrens Way
Wanaque, NJ 07465
|
- sq. feet
|
- baths - beds |
show details | |

|
#2
Ringwood Ave # 1c
Wanaque, NJ 07465
|
- sq. feet
|
- baths - beds |
show details | |

|
#3
Maple Ave
Stockholm, NJ 07460
|
1,305 sq. feet
|
1 baths 3 beds |
$364,900
|
show details |

|
#4
Oakdale Mnr Apt A6d
Suffern, NY 10901
|
750 sq. feet
|
1 baths 1 beds |
$99,900
|
show details |

|
#5
Ackerman St
Maywood, NJ 07607
|
1,914 sq. feet
|
4 baths 5 beds |
$525,200
|
show details |

|
#6
Bloomfield Ave
Caldwell, NJ 07006
|
1,216 sq. feet
|
2 baths 2 beds |
$400,000
|
show details |

|
#7
Martin Dr
Harrington Park, NJ 07640
|
1,746 sq. feet
|
3 baths 3 beds |
$950,000
|
show details |

|
#8
Forest Ave
Paramus, NJ 07652
|
2,428 sq. feet
|
3 baths 5 beds |
$749,900
|
show details |

|
#9
N Main St Apt C-15
Spring Valley, NY 10977
|
800 sq. feet
|
1 baths 1 beds |
$85,000
|
show details |

|
#10
Garbarino Ave
Wanaque, NJ 07465
|
- sq. feet
|
- baths - beds |
show details |
| Photo | Address | Area | Beds / Baths | Price | Details |
|---|---|---|---|---|---|

|
#11
Oak Ter
Wanaque, NJ 07465
|
- sq. feet
|
- baths - beds |
show details | |

|
#12
Warrens Way
Wanaque, NJ 07465
|
- sq. feet
|
- baths - beds |
show details | |

|
#13
Conklintown Rd
Wanaque, NJ 07465
|
- sq. feet
|
- baths - beds |
show details | |

|
#14
Midvale Ave
Wanaque, NJ 07465
|
- sq. feet
|
- baths - beds |
show details | |

|
#15
Warren Hagstrom Blvd
Wanaque, NJ 07465
|
- sq. feet
|
- baths - beds |
show details | |

|
#16
Aldrin Dr
Wanaque, NJ 07465
|
- sq. feet
|
- baths - beds |
show details | |

|
#17
Cannonball Rd
Wanaque, NJ 07465
|
- sq. feet
|
- baths - beds |
show details | |

|
#18
Crescent Rd
Wanaque, NJ 07465
|
- sq. feet
|
- baths - beds |
show details | |

|
#19
Scrivani Dr
Wanaque, NJ 07465
|
- sq. feet
|
- baths - beds |
show details | |

|
#20
Howe Ave
Passaic, NJ 07055
|
- sq. feet
|
2 baths 5 beds |
$332,800
|
show details |
| Photo | Address | Area | Beds / Baths | Price | Details |
|---|---|---|---|---|---|

|
#21
5th St
Fair Lawn, NJ 07410
|
- sq. feet
|
3 baths 3 beds |
$431,600
|
show details |

|
#22
Colonial Ter Apt 3
Hackensack, NJ 07601
|
- sq. feet
|
1 baths 2 beds |
$267,750
|
show details |

|
#23
Lafayette Ave
Hawthorne, NJ 07506
|
1,676 sq. feet
|
1 baths 3 beds |
show details | |

|
#24
Clinton Ln
Spring Valley, NY 10977
|
3,137 sq. feet
|
3 baths 6 beds |
show details | |

|
#25
Highland Ave
Passaic, NJ 07055
|
2,018 sq. feet
|
2 baths 4 beds |
show details | |

|
#26
Wallace Ln
Little Falls, NJ 07424
|
1,305 sq. feet
|
1 baths 3 beds |
show details | |

|
#27
E 4th St
Clifton, NJ 07011
|
774 sq. feet
|
1 baths 2 beds |
show details | |

|
#28
Colonial Rd
Westwood, NJ 07675
|
2,528 sq. feet
|
3 baths 5 beds |
show details | |

|
#29
Mohawk Trl
Wayne, NJ 07470
|
1,920 sq. feet
|
2 baths 3 beds |
show details | |

|
#30
Orchard St
Bloomingdale, NJ 07403
|
1,536 sq. feet
|
1 baths 4 beds |
show details |
| Photo | Address | Area | Beds / Baths | Price | Details |
|---|---|---|---|---|---|

|
#31
Luisser St
Clifton, NJ 07012
|
1,464 sq. feet
|
1 baths 3 beds |
show details | |

|
#32
Marlboro Rd
Glen Rock, NJ 07452
|
1,400 sq. feet
|
2 baths 3 beds |
show details | |

|
#33
Summit Ave
Hackensack, NJ 07601
|
4,025 sq. feet
|
3 baths 5 beds |
show details | |

|
#34
Post Oak Ct
Hamburg, NJ 07419
|
1,984 sq. feet
|
2 baths 3 beds |
show details | |

|
#35
Coger St
Saddle Brook, NJ 07663
|
1,470 sq. feet
|
2 baths 5 beds |
show details | |

|
#36
Lenox Ave
Paterson, NJ 07502
|
1,028 sq. feet
|
2 baths 3 beds |
show details | |

|
#37
Genoble Rd
Montville, NJ 07045
|
863 sq. feet
|
1 baths 1 beds |
show details | |

|
#38
Sherman Ave
Paterson, NJ 07502
|
2,288 sq. feet
|
2 baths 5 beds |
show details | |

|
#39
Wenonah Ave
Oakland, NJ 07436
|
984 sq. feet
|
2 baths 2 beds |
show details | |

|
#40
Quince Lane Aka 41 N. Quince Lane
Monsey, NY 10952
|
4,522 sq. feet
|
5 baths 8 beds |
show details |
| Photo | Address | Area | Beds / Baths | Price | Details |
|---|---|---|---|---|---|

|
#41
Lyons Ave
Stockholm, NJ 07460
|
582 sq. feet
|
1 baths 2 beds |
show details | |

|
#42
E 26th St
Paterson, NJ 07514
|
1,344 sq. feet
|
3 baths 5 beds |
show details | |

|
#43
Voorhis Ave
New Milford, NJ 07646
|
2,200 sq. feet
|
2 baths 3 beds |
show details | |

|
#44
Parkway Ct
Township Of Washington, NJ 07676
|
3,200 sq. feet
|
3 baths 4 beds |
show details | |

|
#45
Glen Rd
Sparta, NJ 07871
|
1,317 sq. feet
|
1 baths 3 beds |
show details | |

|
#46
Lea Ct
Pomona, NY 10970
|
3,188 sq. feet
|
3 baths 5 beds |
show details | |

|
#47
Berdan St
Rochelle Park, NJ 07662
|
1,900 sq. feet
|
2 baths 3 beds |
show details | |

|
#48
Rella Dr
New City, NY 10956
|
3,433 sq. feet
|
3 baths 6 beds |
show details | |

|
#49
Underwood Rd
Montville, NJ 07045
|
3,419 sq. feet
|
2 baths 3 beds |
show details | |

|
Check over 1 million property listings on Foreclosure.com!
|
browse all offers | |||

Latest news about housing in Wanaque, NJ collected exclusively by city-data.com from local newspapers, TV, and radio stations

 | Wanaque Reserve Condos In Wanaque NJ (8 replies) |
| Looking to rent a house/condo in Pompton Lakes, New Jersey (2 replies) |
| What is the next up and coming area/town? (36 replies) |
| Should I consider buying a home in Wanaque/Haskell NJ? What should I know? (2 replies) |
| First time home buyer..300k..Good Schools.. (42 replies) |
| Town List for first time home buyers (16 replies) |

Median year apartment built: 1950
Household type by relationship:
Households: 11,086- Male householders: 2,053 (453 living alone), Female householders: 2,173 (606 living alone)
2,245 spouses (2,233 opposite-sex spouses), 613 unmarried partners, (613 opposite-sex unmarried partners), 2,832 children (2,795 natural, 18 adopted, 18 stepchildren), 129 grandchildren, 74 brothers or sisters, 157 parents, 0 foster children, 155 other relatives, 261 non-relatives
- In group quarters: 389
Size of family households: 1,196 2-persons, 645 3-persons, 443 4-persons, 148 5-persons, 148 6-persons, 37 7-or-more-persons.
Size of nonfamily households: 1,252 1-person, 441 2-persons, 36 3-persons, 27 4-persons.
1,362 married couples with children.
217 single-parent households (34 men, 183 women).
77.7% of residents of Wanaque speak English at home.
12.8% of residents speak Spanish at home (82% speak English very well, 4% speak English well, 11% speak English not well, 3% don't speak English at all).
5.8% of residents speak other Indo-European language at home (63% speak English very well, 18% speak English well, 19% speak English not well).
2.2% of residents speak Asian or Pacific Island language at home (66% speak English very well, 34% speak English well).
0.7% of residents speak other language at home (65% speak English very well, 35% speak English well).
Foreign born population: 1,422 (12.8%)
(78.0% of them are naturalized citizens)
| Here: | 6.3 |
| State: | 6.8 |
| Here: | 4.7 |
| State: | 3.9 |
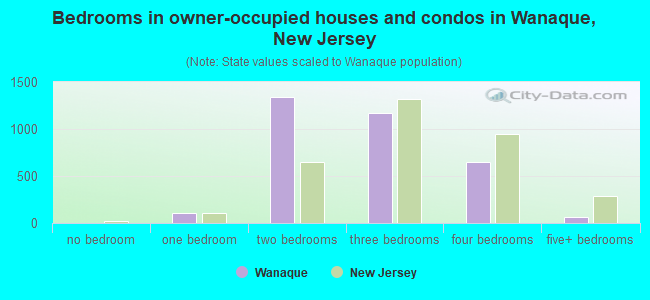
- Bedrooms in owner-occupied houses and condos in Wanaque, New Jersey
- 0no bedroom
- 1041 bedroom
- 1,3422 bedrooms
- 1,1653 bedrooms
- 6484 bedrooms
- 645+ bedrooms
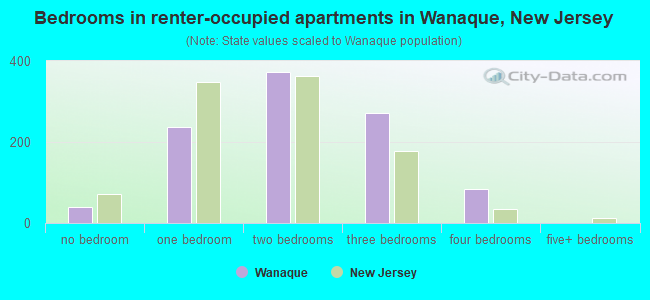
- Bedrooms in renter-occupied apartments in Wanaque, New Jersey
- 39no bedroom
- 2381 bedroom
- 3722 bedrooms
- 2713 bedrooms
- 854 bedrooms
- 05+ bedrooms
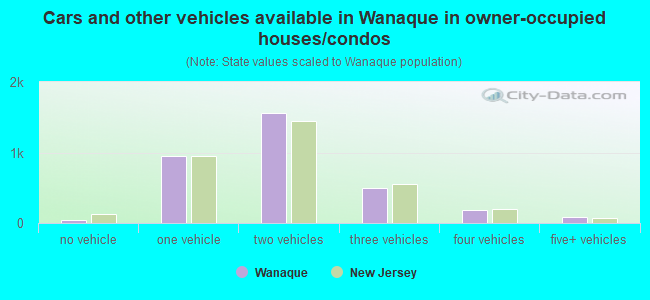
- Cars and other vehicles available in Wanaque in owner-occupied houses/condos
- 49no vehicle
- 9471 vehicle
- 1,5662 vehicles
- 4983 vehicles
- 1814 vehicles
- 815+ vehicles
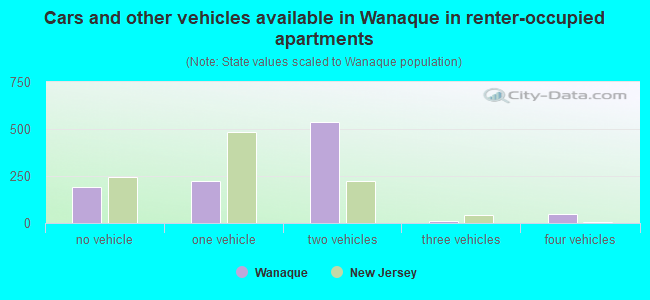
- Cars and other vehicles available in Wanaque in renter-occupied apartments
- 193no vehicle
- 2221 vehicle
- 5352 vehicles
- 103 vehicles
- 464 vehicles
- 05+ vehicles
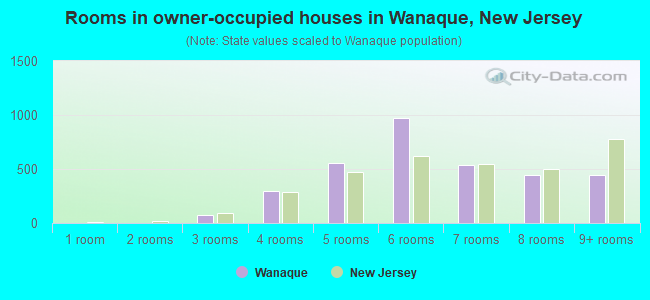
- Rooms in owner-occupied houses in Wanaque, New Jersey
- 01 room
- 02 rooms
- 723 rooms
- 2934 rooms
- 5525 rooms
- 9756 rooms
- 5347 rooms
- 4478 rooms
- 4479+ rooms
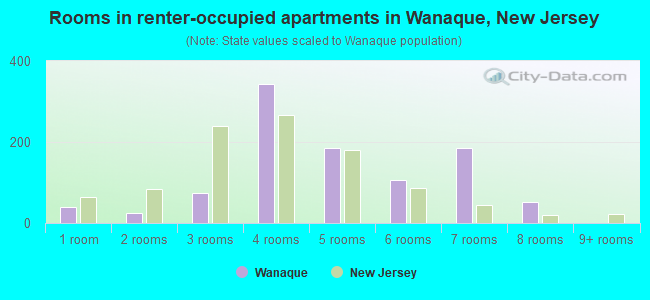
- Rooms in renter-occupied apartments in Wanaque, New Jersey
- 391 room
- 252 rooms
- 733 rooms
- 3424 rooms
- 1845 rooms
- 1066 rooms
- 1857 rooms
- 518 rooms
- 09+ rooms
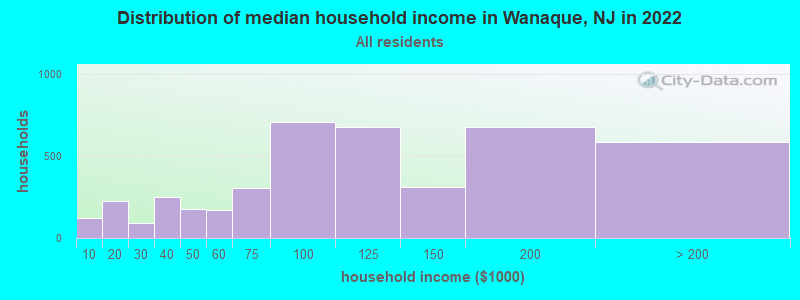
Wanaque, NJ household income distribution

- 124Less than $10,000
- 228$10,000 to $19,999
- 90$20,000 to $29,999
- 251$30,000 to $39,999
- 175$40,000 to $49,999
- 170$50,000 to $59,999
- 302$60,000 to $74,999
- 707$75,000 to $99,999
- 679$100,000 to $124,999
- 310$125,000 to $149,999
- 677$150,000 to $199,999
- 586$200,000 or more
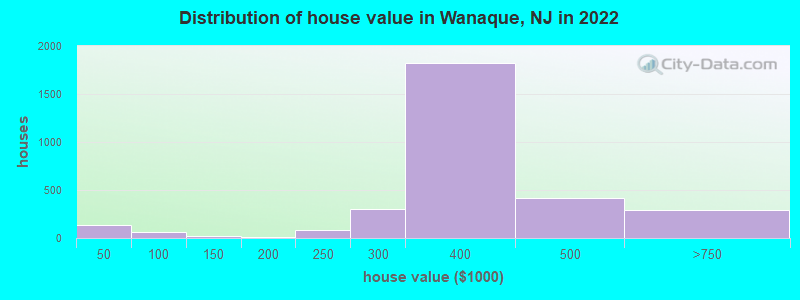
Home value of owner - occupied houses in 2022 in Wanaque, NJ
-
- 32$30,000 to $34,999
- 66$35,000 to $39,999
- 41$40,000 to $49,999
- 24$80,000 to $89,999
- 5$100,000 to $124,999
- 10$125,000 to $149,999
- 12$175,000 to $199,999
- 84$200,000 to $249,999
- 297$250,000 to $299,999
- 1,819$300,000 to $399,999
- 416$400,000 to $499,999
- 280$500,000 to $749,999
- 16$750,000 to $999,999
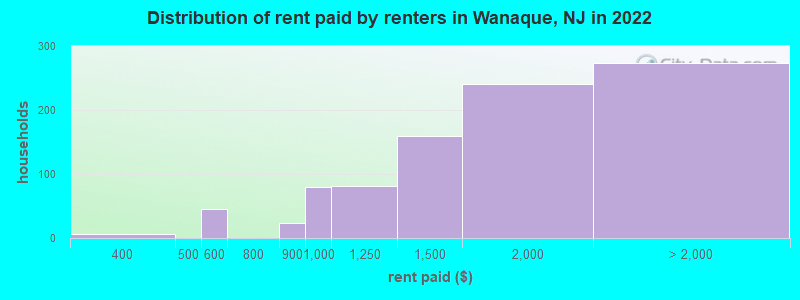
Rent paid by renters in 2022 in Wanaque, NJ
-
- 7$300 to $349
- 46$500 to $549
- 22$800 to $899
- 80$900 to $999
- 82$1,000 to $1,249
- 158$1,250 to $1,499
- 240$1,500 to $1,999
- 154$2,000 to $2,499
- 5$2,500 to $2,999
- 12$3,000 to $3,499
- 75$3,500 or more
- 25No cash rent
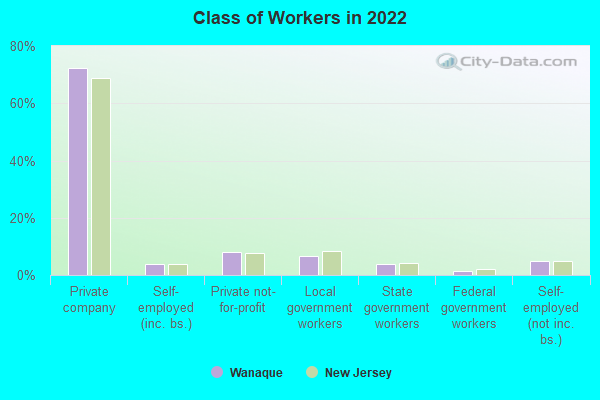
Percentage of workers working in this county: 39.0%
Number of people working at home: 411 (6.9% of all workers)
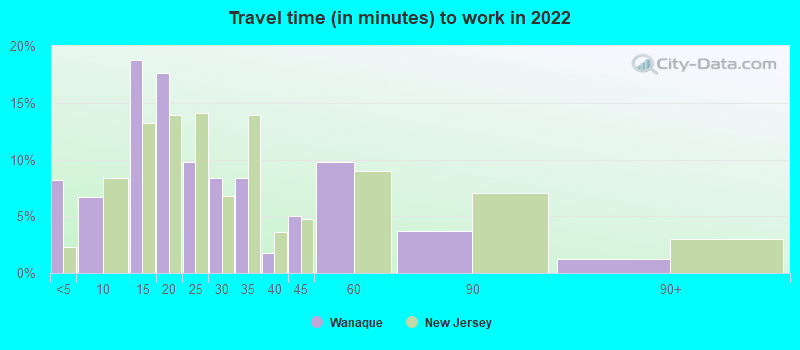
Travel time to work (commute)
- Less than 5 minutes: 261
- 5 to 9 minutes: 141
- 10 to 14 minutes: 538
- 15 to 19 minutes: 456
- 20 to 24 minutes: 883
- 25 to 29 minutes: 413
- 30 to 34 minutes: 884
- 35 to 39 minutes: 235
- 40 to 44 minutes: 529
- 45 to 59 minutes: 365
- 60 to 89 minutes: 349
- 90 or more minutes: 165
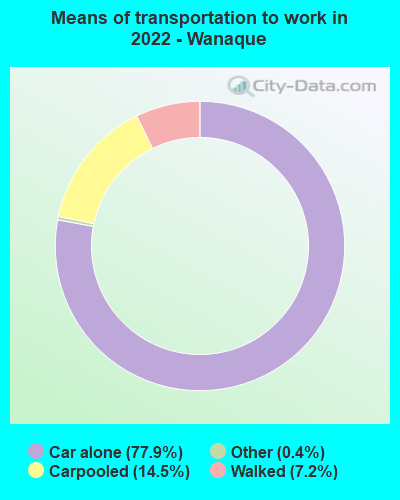
Means of transportation to work:
- Drove a car alone: 1,793 (64.6%)
- Carpooled: 352 (12.7%)
- Taxi: 11 (0.4%)
- Walked: 201 (7.2%)
- Worked at home: 411 (14.8%)
- Unemployment by race in 2022
- Unemployment rate for White non-Hispanic residents
- 3.0%Males
- 2.8%Females
- Unemployment rate for other race residents
- 27.6%Males
- Unemployment rate for Hispanic or Latino residents
- 4.0%Males
- 3.1%Females
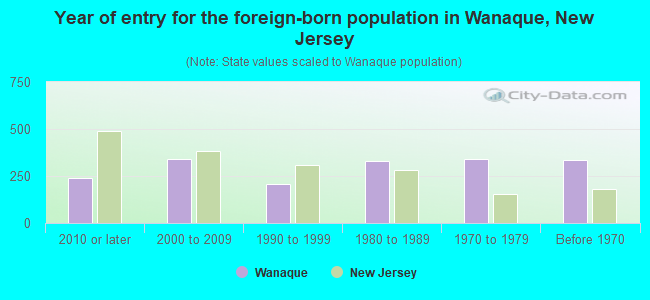
- Year of entry for the foreign-born population in Wanaque, New Jersey
- 2422010 or later
- 3432000 to 2009
- 2051990 to 1999
- 3321980 to 1989
- 3401970 to 1979
- 334Before 1970
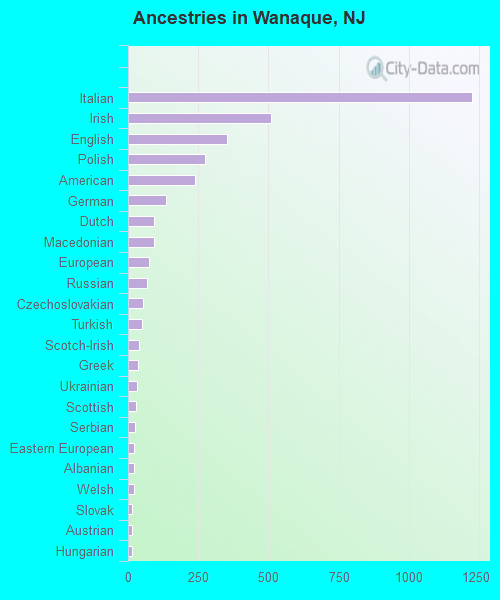
First ancestries reported:
- Italian: 1,224 (21.3%)
- Irish: 509 (8.9%)
- English: 354 (6.2%)
- Polish: 274 (4.8%)
- American: 239 (4.2%)
- German: 134 (2.3%)
- Dutch: 94 (1.6%)
- Macedonian: 93 (1.6%)
- European: 73 (1.3%)
- Russian: 67 (1.2%)
- Czechoslovakian: 55 (1.0%)
- Turkish: 49 (0.9%)
- Scotch-Irish: 38 (0.7%)
- Greek: 34 (0.6%)
- Ukrainian: 31 (0.5%)
- Scottish: 28 (0.5%)
- Serbian: 26 (0.5%)
- Eastern European: 21 (0.4%)
- Albanian: 20 (0.3%)
- Welsh: 20 (0.3%)
- Slovak: 16 (0.3%)
- Austrian: 13 (0.2%)
- Hungarian: 13 (0.2%)
- Lebanese: 10 (0.2%)
- Norwegian: 10 (0.2%)
- Czech: 9 (0.2%)
- Scandinavian: 8 (0.1%)
- Bulgarian: 6 (0.1%)
- Romanian: 6 (0.1%)
Most common places of birth for foreign-born residents (%):
| Wanaque: | 11.1% (167) |
| New Jersey: | 4.0% (85,934) |
| Wanaque: | 8.3% (124) |
| New Jersey: | 2.2% (46,813) |
| Wanaque: | 7.5% (113) |
| New Jersey: | 2.7% (58,563) |
| Wanaque: | 6.4% (96) |
| New Jersey: | 2.1% (45,435) |
| Wanaque: | 5.1% (77) |
| New Jersey: | 9.7% (209,055) |
| Wanaque: | 5.1% (76) |
| New Jersey: | 2.3% (48,811) |
| Wanaque: | 4.8% (72) |
| New Jersey: | 0.4% (8,146) |
| Wanaque: | 4.4% (66) |
| New Jersey: | 3.7% (78,969) |
| Wanaque: | 4.4% (66) |
| New Jersey: | 0.2% (5,094) |
| Wanaque: | 3.8% (57) |
| New Jersey: | 4.4% (95,275) |
| Wanaque: | 3.5% (53) |
| New Jersey: | 1.1% (22,760) |
| Wanaque: | 3.5% (52) |
| New Jersey: | 1.5% (33,198) |
| Wanaque: | 3.5% (52) |
| New Jersey: | 4.2% (90,817) |
| Wanaque: | 2.5% (38) |
| New Jersey: | 0.9% (20,371) |
| Wanaque: | 2.5% (38) |
| New Jersey: | 0.2% (4,324) |
| Wanaque: | 2.2% (33) |
| New Jersey: | 0.3% (5,966) |
| Wanaque: | 2.1% (32) |
| New Jersey: | 0.3% (7,501) |
| Wanaque: | 1.9% (28) |
| New Jersey: | 0.1% (2,470) |
| Wanaque: | 1.5% (23) |
| New Jersey: | 12.8% (274,609) |
Place of birth for U.S.-born residents:
- This state: 6,873
- Other state: 2,626
- Northeast: 2,130
- Midwest: 250
- South: 143
- West: 64
93.3% of Wanaque residents lived in the same house 1 years ago.
Out of people who lived in different houses, 33.1% lived in this county.
Out of people who lived in different counties, 90.6% lived in New Jersey.
| Wanaque: | 93.3% |
| State average: | 90.4% |
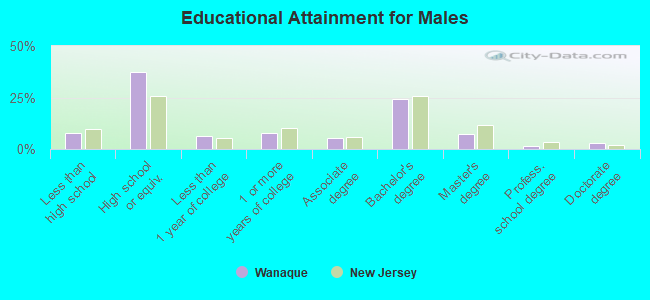
Education attainment for males 25 years and older:
- No schooling: 0
- Nursery to 4th grade: 0
- 5th and 6th grade: 68
- 7th and 8th grade: 15
- 9th grade: 10
- 10th grade: 28
- 11th grade: 72
- 12th grade, no diploma: 140
- High school graduate (or equivalency): 1,614
- Less than 1 year of college: 270
- Some college more than 1 year, no degree: 335
- Associate degree: 230
- Bachelor's degree: 1,056
- Master's degree: 318
- Professional school degree: 61
- Doctorate degree: 129
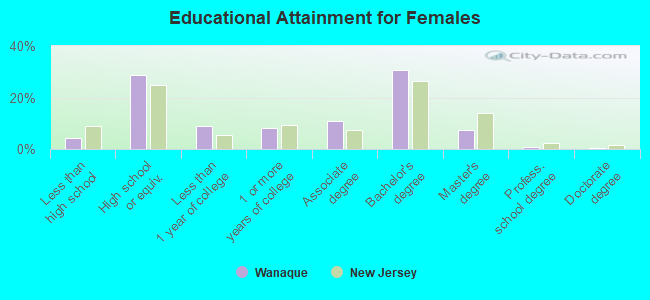
Education attainment for females 25 years and older:
- No schooling: 0
- Nursery to 4th grade: 0
- 5th and 6th grade: 48
- 7th and 8th grade: 38
- 9th grade: 29
- 10th grade: 53
- 11th grade: 14
- 12th grade, no diploma: 0
- High school graduate (or equivalency): 1,182
- Less than 1 year of college: 363
- Some college more than 1 year, no degree: 332
- Associate degree: 443
- Bachelor's degree: 1,257
- Master's degree: 310
- Professional school degree: 40
- Doctorate degree: 9


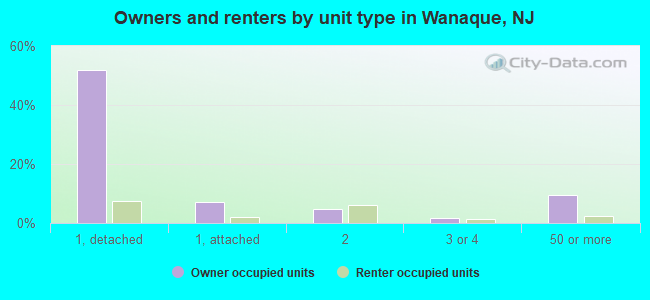
Housing units in structures:
- One, detached: 2,653
- One, attached: 392
- Two: 541
- 3 or 4: 123
- 5 to 9: 43
- 10 to 19: 34
- 20 to 49: 62
- 50 or more: 593
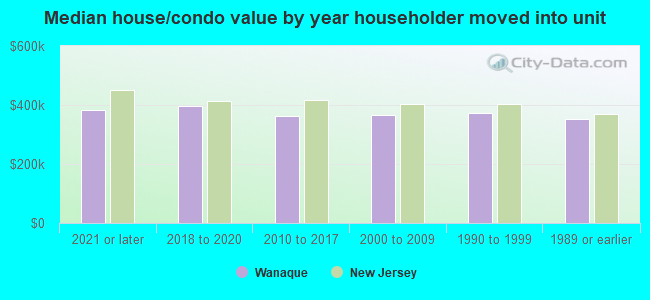
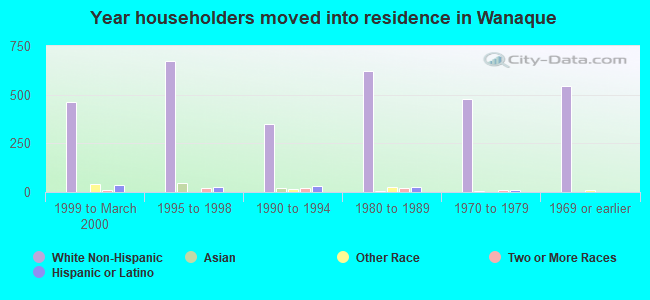
House/condo owner moved in on average 12 years ago
Renter moved in on average 3 years ago
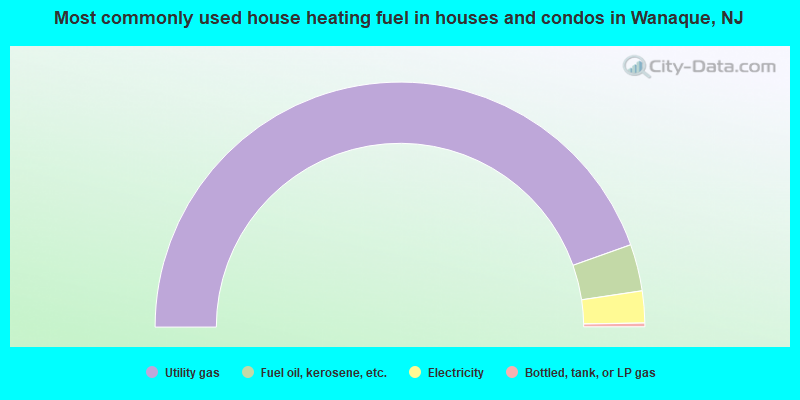
- 89.1%Utility gas
- 6.2%Fuel oil, kerosene, etc.
- 4.2%Electricity
- 0.5%Bottled, tank, or LP gas
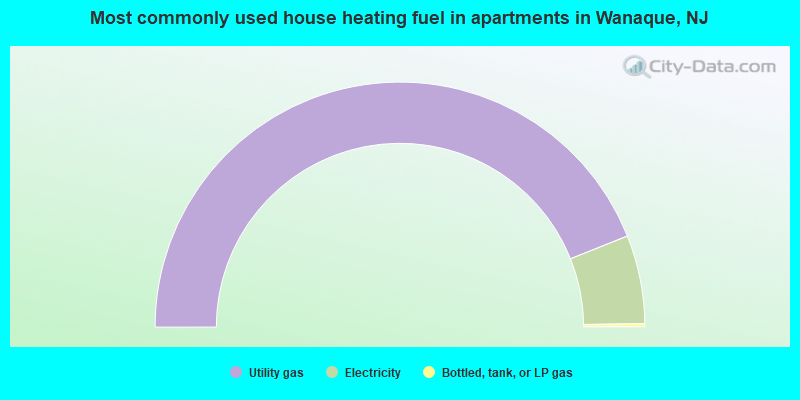
- 87.9%Utility gas
- 11.7%Electricity
- 0.4%Bottled, tank, or LP gas
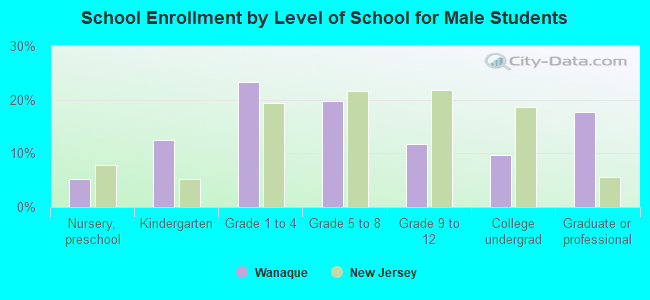
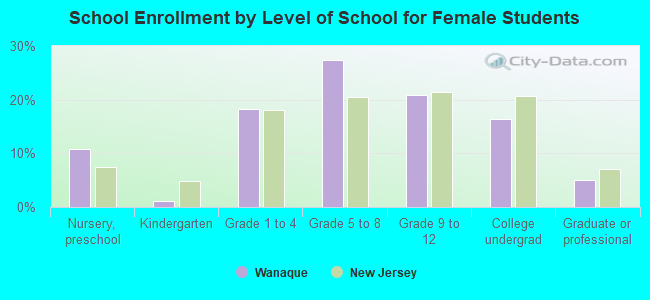
Private vs. public school enrollment:
| Here: | 3.3% |
| New Jersey: | 12.3% |
| Here: | 6.4% |
| New Jersey: | 13.1% |
| Here: | 32.4% |
| New Jersey: | 33.2% |