Warren, CT (Connecticut) Houses and Residents
| Warren: | $466,536 |
| Connecticut: | $347,200 |
Total population: 1,461 (Urban population: 0, Rural population: 1,254 (9 farm, 1,245 nonfarm))
Houses: 650 (497 occupied: 434 owner occupied, 63 renter occupied)
| % of renters here: | 13% |
| State: | 34% |
Housing density: 25 houses/condos per square mile
Median price asked for vacant for-sale houses and condos in 2022 in this county: $399,480.
Median contract rent in 2022: $1,597 (lower quartile is $1,210, upper quartile is over $2,000)
Median rent asked for vacant for-rent units in 2022: $1,526
Median gross rent in Warren, CT in 2022: $1,825
Housing units in Warren with a mortgage: 248 (17 second mortgage, 42 home equity loan, 2 both second mortgage and home equity loan)
Houses without a mortgage: 87
Compare current foreclosures near Warren, CT:
| Photo | Address | Area | Beds / Baths | Price | Details |
|---|---|---|---|---|---|

|
#1
Wieting Rd
New Milford, CT 06776
|
3,210 sq. feet
|
3 baths 5 beds |
$549,900
|
show details |

|
#2
Woodbine St
Torrington, CT 06790
|
2,756 sq. feet
|
3 baths 6 beds |
$419,900
|
show details |

|
#3
Litchfield Rd
Norfolk, CT 06058
|
3,678 sq. feet
|
3 baths 6 beds |
$650,000
|
show details |

|
#4
Marcia Dr
Torrington, CT 06790
|
1,496 sq. feet
|
2 baths 4 beds |
show details | |

|
#5
Litchfield Rd
Harwinton, CT 06791
|
2,216 sq. feet
|
1 baths 3 beds |
show details | |

|
#6
Bch St
Goshen, CT 06756
|
1,380 sq. feet
|
1 baths 4 beds |
show details | |

|
#7
Chestnut Ridge Rd
Dover Plains, NY 12522
|
1,002 sq. feet
|
1 baths 2 beds |
show details | |

|
#8
Woolson St
Watertown, CT 06795
|
1,701 sq. feet
|
2 baths 3 beds |
show details | |

|
#9
Woodpark Dr
Watertown, CT 06795
|
1,205 sq. feet
|
1 baths 3 beds |
show details | |

|
#10
Mapleridge Dr
Torrington, CT 06790
|
1,059 sq. feet
|
1 baths 3 beds |
show details |
| Photo | Address | Area | Beds / Baths | Price | Details |
|---|---|---|---|---|---|

|
#11
Wynwood Dr
New Milford, CT 06776
|
1,189 sq. feet
|
2 baths 3 beds |
show details | |

|
#12
Route 343
Dover Plains, NY 12522
|
1,352 sq. feet
|
1 baths 3 beds |
show details | |

|
#13
Martha Way
Thomaston, CT 06787
|
2,128 sq. feet
|
2 baths 4 beds |
show details | |

|
#14
Willow Spgs
New Milford, CT 06776
|
1,038 sq. feet
|
1 baths 1 beds |
show details | |

|
#15
Cookes Rdg
Torrington, CT 06790
|
872 sq. feet
|
1 baths 2 beds |
show details | |

|
#16
Ridge Rd
Dover Plains, NY 12522
|
1,120 sq. feet
|
2 baths 4 beds |
show details | |

|
#17
Saw Pit Hill Rd
Woodbury, CT 06798
|
3,112 sq. feet
|
3 baths 6 beds |
show details | |

|
#18
Edwin Ln
Thomaston, CT 06787
|
1,848 sq. feet
|
2 baths 3 beds |
show details | |

|
#19
Branch Rd Unit 8e
Thomaston, CT 06787
|
1,128 sq. feet
|
1 baths 2 beds |
show details | |

|
#20
Nutmeg Dr
Torrington, CT 06790
|
872 sq. feet
|
1 baths 4 beds |
show details |
| Photo | Address | Area | Beds / Baths | Price | Details |
|---|---|---|---|---|---|

|
#21
Atwood Rd
Thomaston, CT 06787
|
2,022 sq. feet
|
2 baths 5 beds |
show details | |

|
#22
Moore Dr
Torrington, CT 06790
|
1,236 sq. feet
|
2 baths 3 beds |
show details | |

|
#23
Putnam St
Torrington, CT 06790
|
1,400 sq. feet
|
2 baths 3 beds |
show details | |

|
#24
Charles St
Torrington, CT 06790
|
1,330 sq. feet
|
1 baths 2 beds |
show details | |

|
#25
Vista Dr
Harwinton, CT 06791
|
1,933 sq. feet
|
1 baths 3 beds |
show details | |

|
#26
Route 44
Amenia, NY 12501
|
2,016 sq. feet
|
2 baths 3 beds |
show details | |

|
#27
Route 22
Amenia, NY 12501
|
1,941 sq. feet
|
2 baths 3 beds |
show details | |

|
#28
Fairlawn Dr
Torrington, CT 06790
|
1,549 sq. feet
|
1 baths 3 beds |
show details | |

|
#29
Jordan Ln
Torrington, CT 06790
|
1,550 sq. feet
|
2 baths 3 beds |
show details | |

|
#30
Scott Ave
Watertown, CT 06795
|
2,080 sq. feet
|
2 baths 3 beds |
show details |
| Photo | Address | Area | Beds / Baths | Price | Details |
|---|---|---|---|---|---|

|
#31
Dennison Dr
Torrington, CT 06790
|
1,330 sq. feet
|
1 baths 3 beds |
show details | |

|
#32
Greenwoods Rd
Torrington, CT 06790
|
1,848 sq. feet
|
1 baths 3 beds |
show details | |

|
#33
Holt St Apt 70
Terryville, CT 06786
|
1,064 sq. feet
|
1 baths 2 beds |
show details | |

|
#34
Riverford Rd
Brookfield, CT 06804
|
3,682 sq. feet
|
3 baths 4 beds |
show details | |

|
#35
Cedar Ln
Torrington, CT 06790
|
1,502 sq. feet
|
2 baths 3 beds |
show details | |

|
#36
Woods Way
Woodbury, CT 06798
|
1,467 sq. feet
|
2 baths 3 beds |
show details | |

|
#37
Armbruster Rd
Terryville, CT 06786
|
1,132 sq. feet
|
1 baths 3 beds |
show details | |

|
#38
Wood Duck Dr
Torrington, CT 06790
|
1,884 sq. feet
|
2 baths 4 beds |
show details | |

|
#39
Oak Dr
Watertown, CT 06795
|
2,068 sq. feet
|
2 baths 4 beds |
show details | |

|
#40
Watch Tower Rd
Plymouth, CT 06782
|
2,036 sq. feet
|
3 baths 3 beds |
show details |
| Photo | Address | Area | Beds / Baths | Price | Details |
|---|---|---|---|---|---|

|
#41
Greenwoods Rd
Torrington, CT 06790
|
1,038 sq. feet
|
1 baths 3 beds |
show details | |

|
#42
Ridge Rd
Terryville, CT 06786
|
3,157 sq. feet
|
3 baths 5 beds |
show details | |

|
#43
Bunker Hill Rd
Watertown, CT 06795
|
1,040 sq. feet
|
1 baths 3 beds |
show details | |

|
#44
Yale Ave
Torrington, CT 06790
|
1,196 sq. feet
|
1 baths 2 beds |
show details | |

|
#45
Route 39 S
Sherman, CT 06784
|
2,724 sq. feet
|
3 baths 3 beds |
show details | |

|
#46
N Harwinton Ave
Terryville, CT 06786
|
2,046 sq. feet
|
3 baths 3 beds |
show details | |

|
#47
Orenaug Ave
Woodbury, CT 06798
|
2,058 sq. feet
|
1 baths 3 beds |
show details | |

|
#48
Cedar Mountain Rd
Thomaston, CT 06787
|
1,404 sq. feet
|
2 baths 2 beds |
show details | |

|
#49
Hillside Ave
Plymouth, CT 06782
|
1,336 sq. feet
|
1 baths 2 beds |
show details | |

|
Check over 1 million property listings on Foreclosure.com!
|
browse all offers | |||
Latest news about housing in Warren, CT collected exclusively by city-data.com from local newspapers, TV, and radio stations


Household type by relationship:
Households: 187,123- In family households: 156,490 (36,561 male householders, 14,969 female householders)
41,185 spouses, 52,814 children (49,404 natural, 1,325 adopted, 2,085 stepchildren), 2,365 grandchildren, 1,073 brothers or sisters, 1,650 parents, foster children, 1,216 other relatives, 3,500 non-relatives
- In nonfamily households: 30,633 (11,692 male householders (9,019 living alone)), 13,418 female householders (11,384 living alone)), 5,523 nonrelatives
- In group quarters: 2,804 (1,566 institutionalized population)
34,479 married couples with children.
7,472 single-parent households (1,895 men, 5,577 women).
97.1% of residents of Warren speak English at home.
0.8% of residents speak Spanish at home (56% speak English very well, 22% speak English well, 22% speak English not well).
1.9% of residents speak other Indo-European language at home (74% speak English very well, 9% speak English well, 17% speak English not well).
0.2% of residents speak other language at home (100% speak English not well).
Foreign born population: 56 (3.7%)
(92.9% of them are naturalized citizens)
| Here: | 7.2 |
| State: | 6.5 |
| Here: | 5.9 |
| State: | 4.0 |

- Bedrooms in owner-occupied houses and condos in Warren, Connecticut
- 0no bedroom
- 181 bedroom
- 742 bedrooms
- 2133 bedrooms
- 1084 bedrooms
- 215+ bedrooms

- Bedrooms in renter-occupied apartments in Warren, Connecticut
- 2no bedroom
- 121 bedroom
- 172 bedrooms
- 263 bedrooms
- 34 bedrooms
- 35+ bedrooms

- Cars and other vehicles available in Warren in owner-occupied houses/condos
- 12no vehicle
- 901 vehicle
- 2002 vehicles
- 863 vehicles
- 274 vehicles
- 195+ vehicles

- Cars and other vehicles available in Warren in renter-occupied apartments
- 2no vehicle
- 281 vehicle
- 252 vehicles
- 03 vehicles
- 54 vehicles
- 35+ vehicles

- Rooms in owner-occupied houses in Warren, Connecticut
- 01 room
- 42 rooms
- 83 rooms
- 114 rooms
- 685 rooms
- 1016 rooms
- 1167 rooms
- 598 rooms
- 679+ rooms

- Rooms in renter-occupied apartments in Warren, Connecticut
- 21 room
- 42 rooms
- 53 rooms
- 134 rooms
- 145 rooms
- 116 rooms
- 27 rooms
- 78 rooms
- 59+ rooms


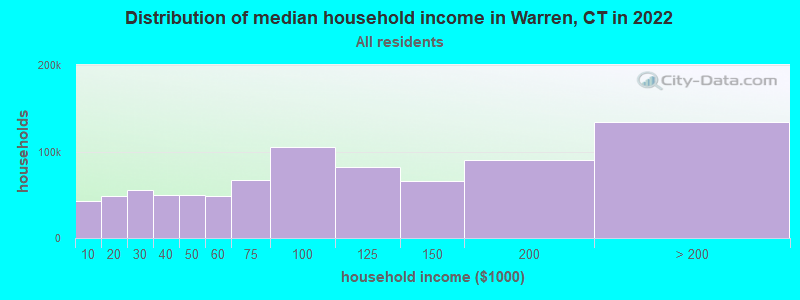
Warren, CT household income distribution

- 4,750Less than $10,000
- 3,856$10,000 to $19,999
- 6,030$20,000 to $29,999
- 7,776$30,000 to $39,999
- 6,296$40,000 to $49,999
- 7,627$50,000 to $59,999
- 14,761$60,000 to $74,999
- 21,326$75,000 to $99,999
- 20,339$100,000 to $124,999
- 16,395$125,000 to $149,999
- 23,601$150,000 to $199,999
- 43,399$200,000 or more
Percentage of workers working in this county: 79.7%
Number of people working at home: 142 (18.7% of all workers)
Travel time to work (commute)
- Less than 5 minutes: 20
- 5 to 9 minutes: 36
- 10 to 14 minutes: 75
- 15 to 19 minutes: 50
- 20 to 24 minutes: 129
- 25 to 29 minutes: 40
- 30 to 34 minutes: 72
- 35 to 39 minutes: 18
- 40 to 44 minutes: 18
- 45 to 59 minutes: 75
- 60 to 89 minutes: 34
- 90 or more minutes: 33
Means of transportation to work:
- Drove a car alone: 529 (81.8%)
- Carpooled: 45 (7.0%)
- Bus or trolley bus: 2 (0.3%)
- Subway or elevated: 13 (2.0%)
- Railroad: 2 (0.3%)
- Taxi: 3 (0.5%)
- Walked: 6 (0.9%)
- Worked at home: 47 (7.3%)


- Year of entry for the foreign-born population in Warren, Connecticut
- 21995 to March 2000
- 91990 to 1994
- 01985 to 1989
- 21980 to 1984
- 01975 to 1979
- 01970 to 1974
- 01965 to 1969
- 21Before 1965

First ancestries reported:
- Irish: 284 (16.7%)
- German: 274 (16.1%)
- English: 245 (14.4%)
- Italian: 168 (9.9%)
- French: 127 (7.5%)
- Other: 89 (5.2%)
- Polish: 79 (4.6%)
- United States: 69 (4.1%)
- Swedish: 55 (3.2%)
- Russian: 53 (3.1%)
- Scottish: 46 (2.7%)
- French Canadian: 38 (2.2%)
- Hungarian: 38 (2.2%)
- Scotch-Irish: 31 (1.8%)
- Dutch: 24 (1.4%)
- Norwegian: 16 (0.9%)
- Czech: 14 (0.8%)
- Welsh: 14 (0.8%)
- Lithuanian: 13 (0.8%)
- Danish: 7 (0.4%)
- Greek: 6 (0.4%)
- Swiss: 4 (0.2%)
- Arab: 2 (0.1%)
- West Indian: 2 (0.1%)
- Ukrainian: 1 (0.06%)
Most common places of birth for foreign-born residents (%):
| Warren: | 20.6% (7) |
| Connecticut: | 3.1% (11,432) |
| Warren: | 17.6% (6) |
| Connecticut: | 0.7% (2,742) |
| Warren: | 17.6% (6) |
| Connecticut: | 0.5% (2,025) |
| Warren: | 11.8% (4) |
| Connecticut: | 4.4% (16,395) |
| Warren: | 8.8% (3) |
| Connecticut: | 1.2% (4,344) |
| Warren: | 5.9% (2) |
| Connecticut: | 1.2% (4,622) |
| Warren: | 5.9% (2) |
| Connecticut: | 1.5% (5,508) |
| Warren: | 5.9% (2) |
| Connecticut: | 0.5% (1,723) |
| Warren: | 5.9% (2) |
| Connecticut: | 0.1% (299) |
Place of birth for U.S.-born residents:
- This state: 760
- Other state: 451
- Northeast: 350
- Midwest: 55
- South: 42
- West: 4
73% of Warren residents lived in the same house 5 years ago.
Out of people who lived in different houses, 58% lived in this county.
Out of people who lived in different counties, 53% lived in Connecticut.
Education attainment for males 25 years and older:
- No schooling: 0
- Nursery to 4th grade: 0
- 5th and 6th grade: 0
- 7th and 8th grade: 10
- 9th grade: 9
- 10th grade: 8
- 11th grade: 4
- 12th grade, no diploma: 19
- High school graduate (or equivalency): 133
- Less than 1 year of college: 19
- Some college more than 1 year, no degree: 65
- Associate degree: 26
- Bachelor's degree: 114
- Master's degree: 29
- Professional school degree: 20
- Doctorate degree: 1

Education attainment for females 25 years and older:
- No schooling: 3
- Nursery to 4th grade: 0
- 5th and 6th grade: 0
- 7th and 8th grade: 0
- 9th grade: 2
- 10th grade: 8
- 11th grade: 2
- 12th grade, no diploma: 8
- High school graduate (or equivalency): 143
- Less than 1 year of college: 30
- Some college more than 1 year, no degree: 62
- Associate degree: 41
- Bachelor's degree: 97
- Master's degree: 40
- Professional school degree: 9
- Doctorate degree: 2


Housing units in structures:
- One, detached: 621
- One, attached: 9
- Two: 8
- 3 or 4: 5
- 5 to 9: 2
- 10 to 19: 3
- 50 or more: 2
Housing units lacking complete kitchen facilities: 0.8%

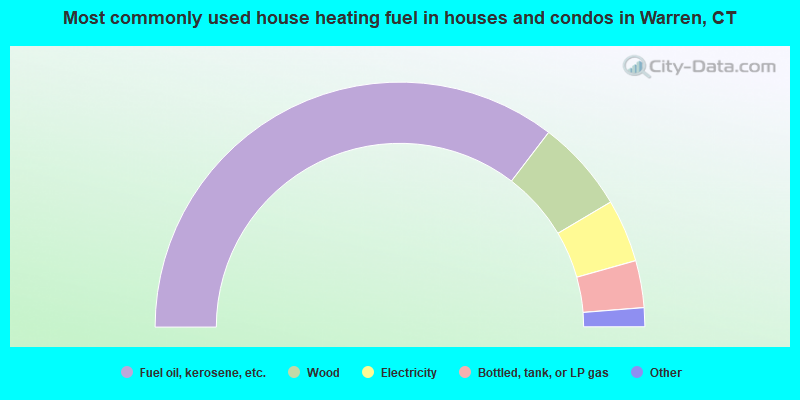
- 70.7%Fuel oil, kerosene, etc.
- 12.2%Wood
- 8.3%Electricity
- 6.2%Bottled, tank, or LP gas
- 1.2%Other fuel
- 0.9%Coal or coke
- 0.5%Solar energy
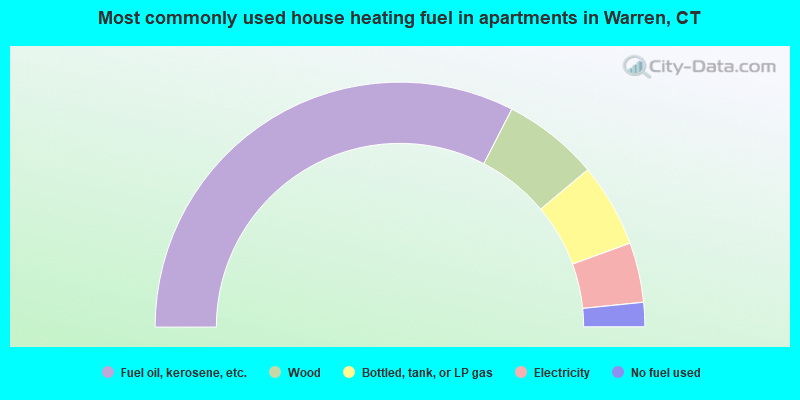
- 65.1%Fuel oil, kerosene, etc.
- 12.7%Wood
- 11.1%Bottled, tank, or LP gas
- 7.9%Electricity
- 3.2%No fuel used
Private vs. public school enrollment:
| Here: | 13.3% |
| Connecticut: | 9.9% |
| Here: | 18.2% |
| Connecticut: | 11.0% |
| Here: | 0.0% |
| Connecticut: | 33.4% |


