Warrenville, IL (Illinois) Houses and Residents
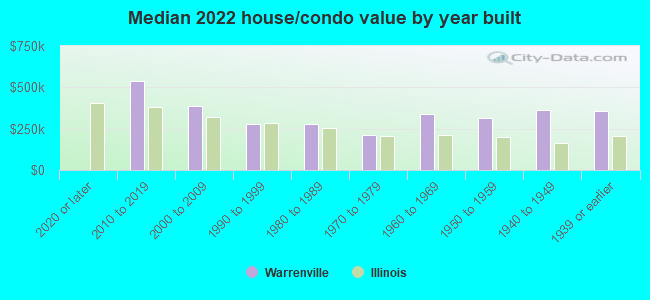
| Warrenville: | $255,137 |
| Illinois: | $251,600 |
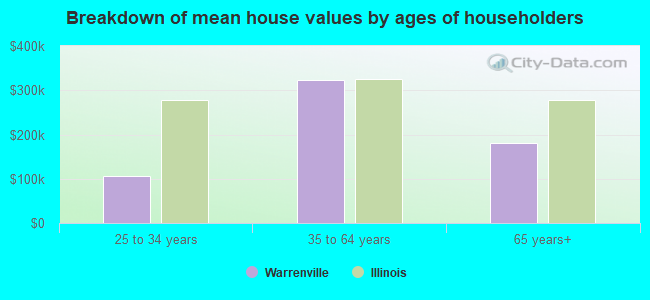
Mean price in 2022:
Detached houses: $345,619
Here: $345,619 State: $310,164 Townhouses or other attached units: $216,709
Here: $216,709 State: $286,230 In 3-to-4-unit structures: $158,779
Here: $158,779 State: $330,907 In 5-or-more-unit structures: $132,604
Here: $132,604 State: $318,887
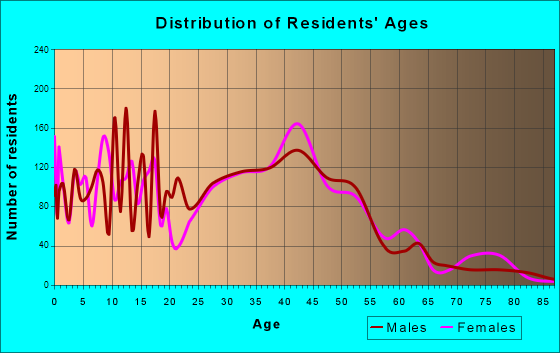
Total population: 13,336 (Urban population: 13,194, Rural population: 0)
Houses: 5,704 (5,502 occupied: 4,353 owner occupied, 1,155 renter occupied)
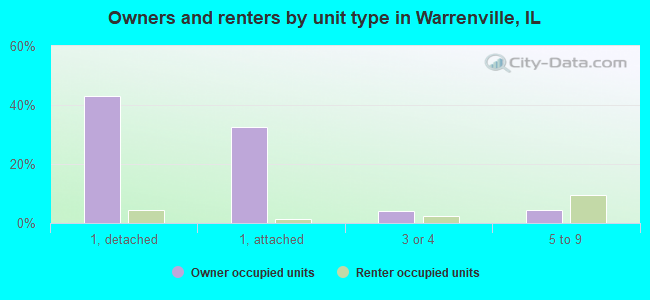
| % of renters here: | 21% |
| State: | 33% |
Housing density: 1,037 houses/condos per square mile
Median price asked for vacant for-sale houses and condos in 2022: $248,231.
Median contract rent in 2022: $1,493 (lower quartile is $1,076, upper quartile is $1,859)
Median rent asked for vacant for-rent units in 2022: $2,125
Median gross rent in Warrenville, IL in 2022: $1,549
Housing units in Warrenville with a mortgage: 3,064 (243 second mortgage, 0 home equity loan, 216 both second mortgage and home equity loan)
Houses without a mortgage: 47
Median household income for houses/condos with a mortgage: $110,896
Median household income for apartments without a mortgage: $77,903
Median monthly housing costs: $1,493
Compare current foreclosures in Warrenville, IL:
| Photo | Address | Area | Beds / Baths | Price | Details |
|---|---|---|---|---|---|

|
#1
Continental Drive
Warrenville, IL 60555
|
1,630 sq. feet
|
- baths - beds |
show details | |

|
#2
Batavia Rd, Apt 316
Warrenville, IL 60555
|
- sq. feet
|
- baths - beds |
show details | |

|
#3
Timber Dr
Warrenville, IL 60555
|
- sq. feet
|
- baths - beds |
show details | |

|
#4
Brighton Ct
Warrenville, IL 60555
|
- sq. feet
|
- baths - beds |
show details | |

|
#5
Williams Ct
Warrenville, IL 60555
|
- sq. feet
|
- baths - beds |
show details | |

|
#6
Williams Ct
Warrenville, IL 60555
|
- sq. feet
|
- baths - beds |
show details | |

|
#7
Timber Dr
Warrenville, IL 60555
|
- sq. feet
|
- baths - beds |
show details | |

|
#8
Williams Rd
Warrenville, IL 60555
|
- sq. feet
|
- baths - beds |
show details | |

|
#9
Timber Dr
Warrenville, IL 60555
|
- sq. feet
|
- baths - beds |
show details | |

|
#10
Ferry Rd
Warrenville, IL 60555
|
- sq. feet
|
- baths - beds |
show details |
| Photo | Address | Area | Beds / Baths | Price | Details |
|---|---|---|---|---|---|

|
#11
Continental Dr
Warrenville, IL 60555
|
- sq. feet
|
- baths - beds |
show details | |

|
#12
Waltham Ct
Warrenville, IL 60555
|
- sq. feet
|
- baths - beds |
show details | |

|
#13
Diehl Rd # 452
Warrenville, IL 60555
|
- sq. feet
|
- baths - beds |
show details | |

|
#14
Candlewood Ln
Warrenville, IL 60555
|
- sq. feet
|
- baths - beds |
show details | |

|
#15
Hawthorne Ln
Warrenville, IL 60555
|
- sq. feet
|
- baths - beds |
show details | |

|
#16
Ferry Rd, Apt 161
Warrenville, IL 60555
|
- sq. feet
|
- baths - beds |
show details | |

|
#17
Wood Ct
Warrenville, IL 60555
|
- sq. feet
|
- baths - beds |
show details | |

|
#18
Chestnut Ct
Warrenville, IL 60555
|
- sq. feet
|
- baths - beds |
show details | |

|
#19
Timber Dr
Warrenville, IL 60555
|
- sq. feet
|
- baths - beds |
show details | |

|
#20
Winchester Cir
Warrenville, IL 60555
|
- sq. feet
|
- baths - beds |
show details |
| Photo | Address | Area | Beds / Baths | Price | Details |
|---|---|---|---|---|---|

|
#21
Pattermann Rd
Warrenville, IL 60555
|
- sq. feet
|
- baths - beds |
show details | |

|
#22
Butternut Ln
Warrenville, IL 60555
|
- sq. feet
|
- baths - beds |
show details | |

|
#23
Main St
Warrenville, IL 60555
|
- sq. feet
|
- baths - beds |
show details | |

|
#24
Heather Ct
Warrenville, IL 60555
|
- sq. feet
|
- baths - beds |
show details | |

|
#25
Townline Rd
Warrenville, IL 60555
|
- sq. feet
|
- baths - beds |
show details | |

|
#26
Rogers Ave
Warrenville, IL 60555
|
- sq. feet
|
- baths - beds |
show details | |

|
#27
Bedford Ct
Warrenville, IL 60555
|
- sq. feet
|
- baths - beds |
show details | |

|
#28
White Oak Dr
Warrenville, IL 60555
|
- sq. feet
|
- baths - beds |
show details | |

|
#29
Pattermann Rd
Warrenville, IL 60555
|
- sq. feet
|
- baths - beds |
show details | |

|
#30
Willow Ln
Warrenville, IL 60555
|
- sq. feet
|
- baths - beds |
show details |
| Photo | Address | Area | Beds / Baths | Price | Details |
|---|---|---|---|---|---|

|
#31
River Oaks Dr
Warrenville, IL 60555
|
- sq. feet
|
- baths - beds |
show details | |

|
#32
Continental Dr
Warrenville, IL 60555
|
- sq. feet
|
- baths - beds |
show details | |

|
Check over 1 million property listings on Foreclosure.com!
|
browse all offers | |||

Latest news about housing in Warrenville, IL collected exclusively by city-data.com from local newspapers, TV, and radio stations

 | Four Lakes condos? (8 replies) |
| Townhouse in Warrenville (4 replies) |
| Reputation of Winchester condos in Warrenville (4 replies) |
| Very weak housing market in Highland Park (66 replies) |
| Nature-filled areas with older homes & young families (23 replies) |
| Homesteading + supportive community (16 replies) |
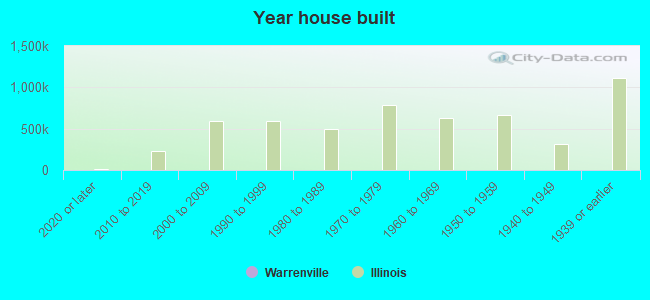
Median year apartment built: 1985
Household type by relationship:
Households: 13,800- Male householders: 2,904 (631 living alone), Female householders: 2,513 (700 living alone)
2,559 spouses (2,532 opposite-sex spouses), 538 unmarried partners, (533 opposite-sex unmarried partners), 3,801 children (3,612 natural, 64 adopted, 124 stepchildren), 219 grandchildren, 232 brothers or sisters, 318 parents, 24 foster children, 131 other relatives, 482 non-relatives
- In group quarters: 73
Size of family households: 1,564 2-persons, 670 3-persons, 660 4-persons, 407 5-persons, 19 6-persons, 71 7-or-more-persons.
Size of nonfamily households: 1,380 1-person, 724 2-persons, 29 3-persons.
1,843 married couples with children.
630 single-parent households (26 men, 604 women).
75.9% of residents of Warrenville speak English at home.
17.8% of residents speak Spanish at home (54% speak English very well, 24% speak English well, 14% speak English not well, 9% don't speak English at all).
4.0% of residents speak other Indo-European language at home (69% speak English very well, 25% speak English well, 7% speak English not well).
2.2% of residents speak Asian or Pacific Island language at home (53% speak English very well, 33% speak English well, 14% speak English not well).
0.7% of residents speak other language at home (52% speak English very well, 42% speak English well, 7% speak English not well).
Foreign born population: 2,191 (15.9%)
(53.0% of them are naturalized citizens)
| Here: | 6.0 |
| State: | 6.4 |
| Here: | 4.2 |
| State: | 4.1 |
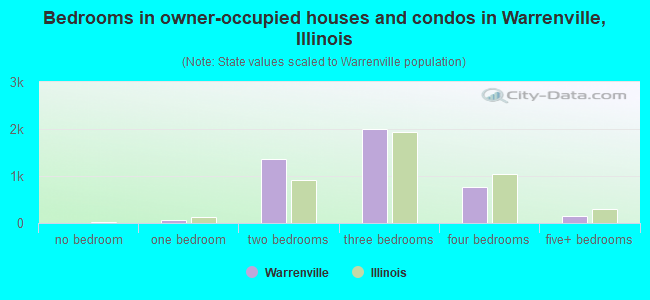
- Bedrooms in owner-occupied houses and condos in Warrenville, Illinois
- 7no bedroom
- 581 bedroom
- 1,3692 bedrooms
- 2,0103 bedrooms
- 7704 bedrooms
- 1395+ bedrooms
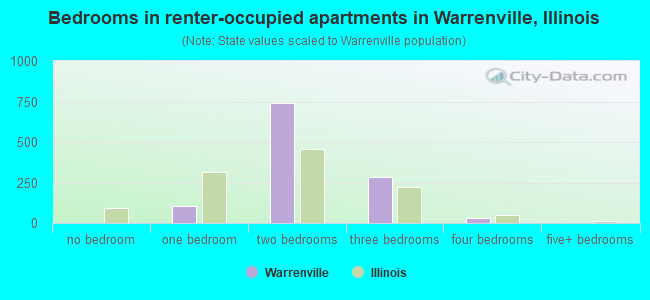
- Bedrooms in renter-occupied apartments in Warrenville, Illinois
- 0no bedroom
- 1031 bedroom
- 7392 bedrooms
- 2833 bedrooms
- 314 bedrooms
- 05+ bedrooms
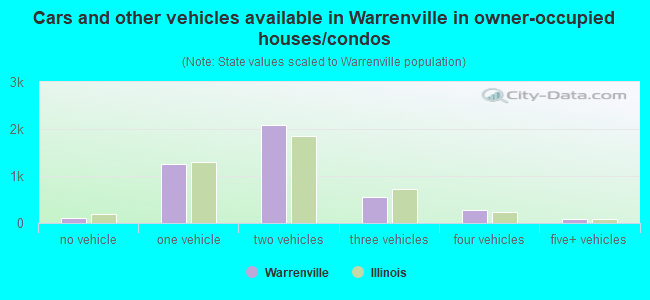
- Cars and other vehicles available in Warrenville in owner-occupied houses/condos
- 101no vehicle
- 1,2591 vehicle
- 2,0952 vehicles
- 5513 vehicles
- 2674 vehicles
- 815+ vehicles
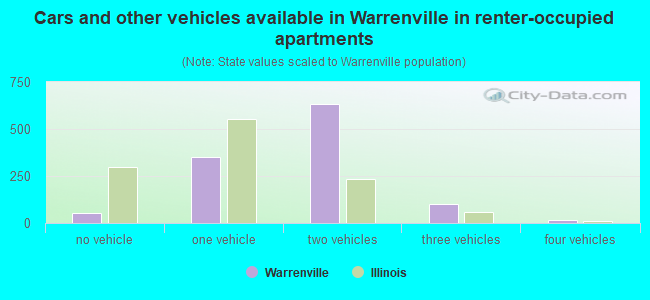
- Cars and other vehicles available in Warrenville in renter-occupied apartments
- 52no vehicle
- 3531 vehicle
- 6332 vehicles
- 1023 vehicles
- 154 vehicles
- 05+ vehicles
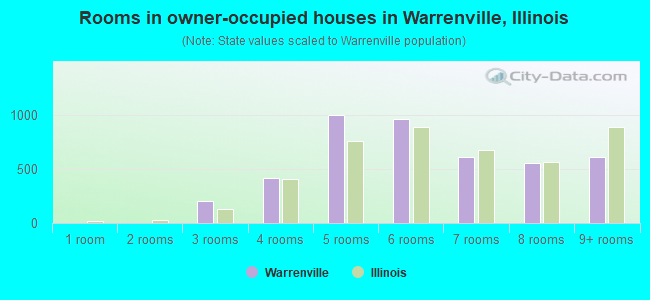
- Rooms in owner-occupied houses in Warrenville, Illinois
- 01 room
- 02 rooms
- 2023 rooms
- 4134 rooms
- 9995 rooms
- 9596 rooms
- 6077 rooms
- 5598 rooms
- 6159+ rooms
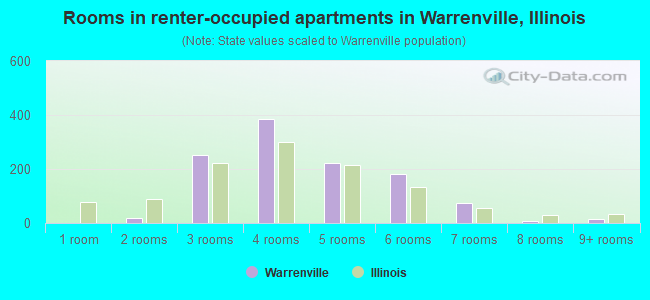
- Rooms in renter-occupied apartments in Warrenville, Illinois
- 01 room
- 202 rooms
- 2523 rooms
- 3854 rooms
- 2235 rooms
- 1816 rooms
- 747 rooms
- 68 rooms
- 139+ rooms
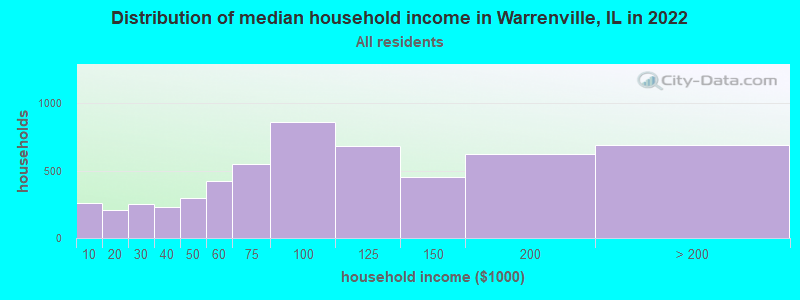
Warrenville, IL household income distribution

- 259Less than $10,000
- 204$10,000 to $19,999
- 250$20,000 to $29,999
- 230$30,000 to $39,999
- 297$40,000 to $49,999
- 419$50,000 to $59,999
- 545$60,000 to $74,999
- 860$75,000 to $99,999
- 681$100,000 to $124,999
- 453$125,000 to $149,999
- 624$150,000 to $199,999
- 689$200,000 or more
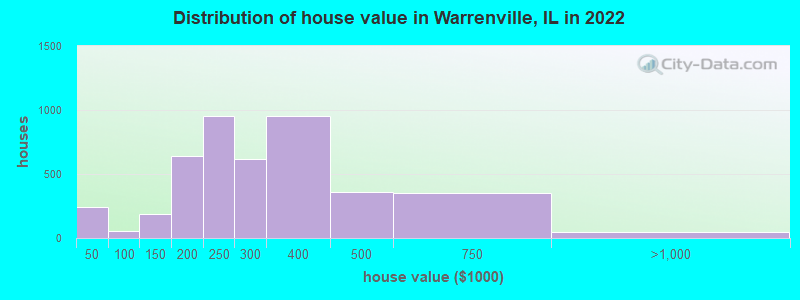
Home value of owner - occupied houses in 2022 in Warrenville, IL
-
- 203Less than $10,000
- 16$15,000 to $19,999
- 14$20,000 to $24,999
- 4$35,000 to $39,999
- 19$50,000 to $59,999
- 36$70,000 to $79,999
- 54$100,000 to $124,999
- 132$125,000 to $149,999
- 302$150,000 to $174,999
- 336$175,000 to $199,999
- 951$200,000 to $249,999
- 614$250,000 to $299,999
- 955$300,000 to $399,999
- 356$400,000 to $499,999
- 351$500,000 to $749,999
- 34$750,000 to $999,999
- 11$1,000,000 to $1,499,999
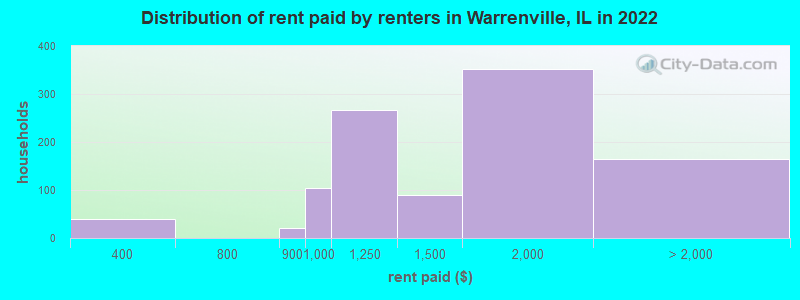
Rent paid by renters in 2022 in Warrenville, IL
-
- 40$300 to $349
- 19$800 to $899
- 105$900 to $999
- 266$1,000 to $1,249
- 90$1,250 to $1,499
- 352$1,500 to $1,999
- 151$2,000 to $2,499
- 2$2,500 to $2,999
- 10No cash rent
Percentage of workers working in this county: 76.5%
Number of people working at home: 1,064 (13.3% of all workers)
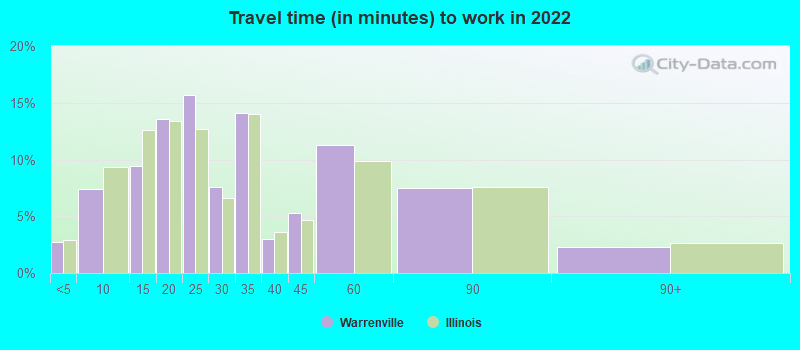
Travel time to work (commute)
- Less than 5 minutes: 170
- 5 to 9 minutes: 525
- 10 to 14 minutes: 840
- 15 to 19 minutes: 1,669
- 20 to 24 minutes: 1,029
- 25 to 29 minutes: 432
- 30 to 34 minutes: 642
- 35 to 39 minutes: 208
- 40 to 44 minutes: 429
- 45 to 59 minutes: 361
- 60 to 89 minutes: 342
- 90 or more minutes: 229
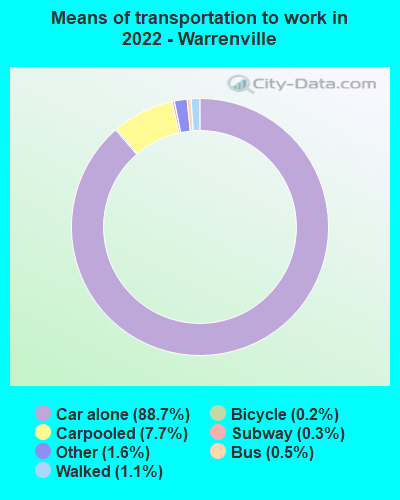
Means of transportation to work:
- Drove a car alone: 6,610 (75.4%)
- Carpooled: 703 (8.0%)
- Bus: 54 (0.6%)
- Long-distance train or commuter rail: 22 (0.3%)
- Taxi: 135 (1.5%)
- Bicycle: 10 (0.1%)
- Walked: 77 (0.9%)
- Worked at home: 1,064 (12.1%)
- Unemployment by race in 2022
- Unemployment rate for White non-Hispanic residents
- 2.8%Males
- 1.4%Females
- Unemployment rate for Black residents
- 12.7%Males
- 7.5%Females
- Unemployment rate for American Indian and Alaska Native residents
- 69.4%Males
- Unemployment rate for Asian residents
- 11.3%Females
- Unemployment rate for two or more race residents
- 4.1%Males
- 0.9%Females
- Unemployment rate for Hispanic or Latino residents
- 6.0%Males
- 1.3%Females
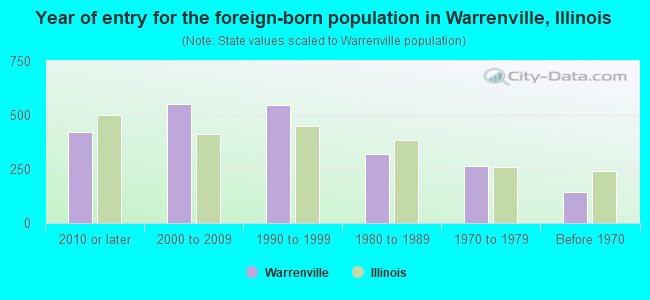
- Year of entry for the foreign-born population in Warrenville, Illinois
- 4212010 or later
- 5502000 to 2009
- 5461990 to 1999
- 3181980 to 1989
- 2621970 to 1979
- 145Before 1970
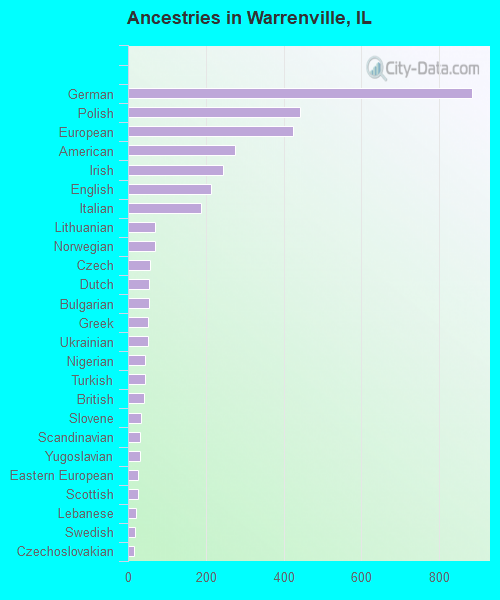
First ancestries reported:
- German: 884 (13.7%)
- Polish: 443 (6.9%)
- European: 423 (6.6%)
- American: 275 (4.3%)
- Irish: 244 (3.8%)
- English: 213 (3.3%)
- Italian: 187 (2.9%)
- Lithuanian: 70 (1.1%)
- Norwegian: 69 (1.1%)
- Czech: 57 (0.9%)
- Dutch: 55 (0.9%)
- Bulgarian: 53 (0.8%)
- Greek: 52 (0.8%)
- Ukrainian: 51 (0.8%)
- Nigerian: 43 (0.7%)
- Turkish: 43 (0.7%)
- British: 41 (0.6%)
- Slovene: 34 (0.5%)
- Scandinavian: 31 (0.5%)
- Yugoslavian: 30 (0.5%)
- Eastern European: 26 (0.4%)
- Scottish: 26 (0.4%)
- Lebanese: 21 (0.3%)
- Swedish: 18 (0.3%)
- Czechoslovakian: 15 (0.2%)
- Croatian: 14 (0.2%)
- Arab: 10 (0.2%)
- Russian: 9 (0.1%)
- Armenian: 8 (0.1%)
- Scotch-Irish: 8 (0.1%)
- Moroccan: 7 (0.1%)
- Hungarian: 7 (0.1%)
- Israeli: 7 (0.1%)
- French Canadian: 6 (0.09%)
- Slovak: 6 (0.09%)
- French: 5 (0.08%)
- Serbian: 5 (0.08%)
- Albanian: 4 (0.06%)
- Northern European: 3 (0.05%)
Most common places of birth for foreign-born residents (%):
| Warrenville: | 55.0% (1,211) |
| Illinois: | 34.7% (626,958) |
| Warrenville: | 3.5% (78) |
| Illinois: | 1.0% (18,753) |
| Warrenville: | 3.0% (67) |
| Illinois: | 6.9% (124,474) |
| Warrenville: | 2.7% (60) |
| Illinois: | 0.1% (1,403) |
| Warrenville: | 2.4% (53) |
| Illinois: | 5.2% (93,003) |
| Warrenville: | 2.3% (50) |
| Illinois: | 0.2% (3,977) |
| Warrenville: | 2.1% (47) |
| Illinois: | 1.2% (22,269) |
| Warrenville: | 2.0% (45) |
| Illinois: | 1.1% (19,306) |
| Warrenville: | 2.0% (43) |
| Illinois: | 1.2% (21,186) |
| Warrenville: | 1.9% (42) |
| Illinois: | 0.5% (8,235) |
| Warrenville: | 1.8% (40) |
| Illinois: | 9.2% (166,409) |
| Warrenville: | 1.7% (38) |
| Illinois: | 0.6% (10,249) |
| Warrenville: | 1.7% (37) |
| Illinois: | 0.8% (14,165) |
| Warrenville: | 1.6% (35) |
| Illinois: | 0.9% (16,553) |
Place of birth for U.S.-born residents:
- This state: 9,075
- Other state: 2,350
- Northeast: 342
- Midwest: 1,090
- South: 526
- West: 380
91.2% of Warrenville residents lived in the same house 1 years ago.
Out of people who lived in different houses, 42.4% lived in this county.
Out of people who lived in different counties, 88.7% lived in Illinois.
| Warrenville: | 91.2% |
| State average: | 88.3% |
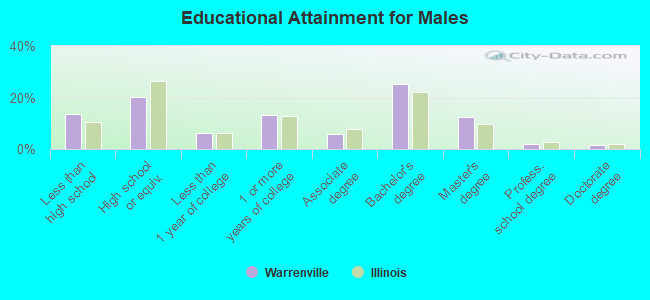
Education attainment for males 25 years and older:
- No schooling: 437
- Nursery to 4th grade: 0
- 5th and 6th grade: 0
- 7th and 8th grade: 28
- 9th grade: 47
- 10th grade: 0
- 11th grade: 41
- 12th grade, no diploma: 120
- High school graduate (or equivalency): 1,007
- Less than 1 year of college: 314
- Some college more than 1 year, no degree: 649
- Associate degree: 280
- Bachelor's degree: 1,250
- Master's degree: 613
- Professional school degree: 93
- Doctorate degree: 79
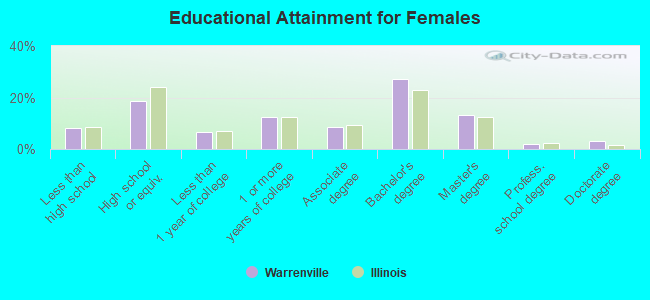
Education attainment for females 25 years and older:
- No schooling: 198
- Nursery to 4th grade: 49
- 5th and 6th grade: 46
- 7th and 8th grade: 0
- 9th grade: 67
- 10th grade: 10
- 11th grade: 6
- 12th grade, no diploma: 26
- High school graduate (or equivalency): 934
- Less than 1 year of college: 330
- Some college more than 1 year, no degree: 613
- Associate degree: 421
- Bachelor's degree: 1,349
- Master's degree: 653
- Professional school degree: 103
- Doctorate degree: 157
Housing units in structures:
- One, detached: 2,712
- One, attached: 1,747
- Two: 26
- 3 or 4: 433
- 5 to 9: 692
- 10 to 19: 72
- 50 or more: 20
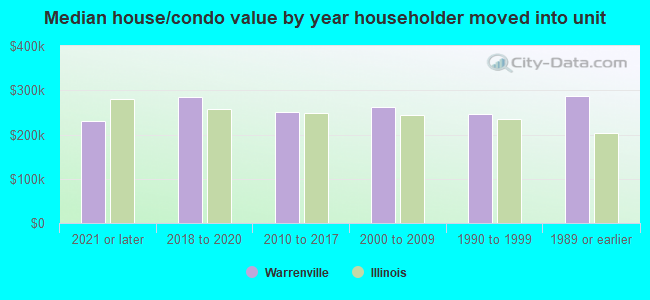
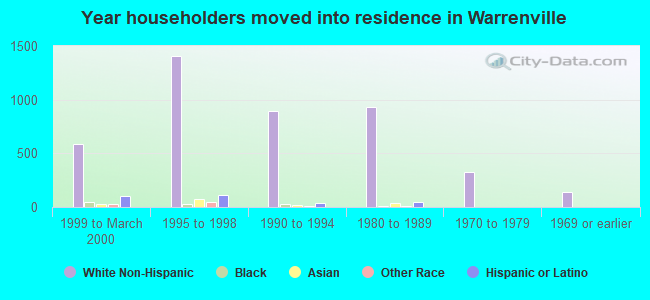
House/condo owner moved in on average 12 years ago
Renter moved in on average 1 years ago
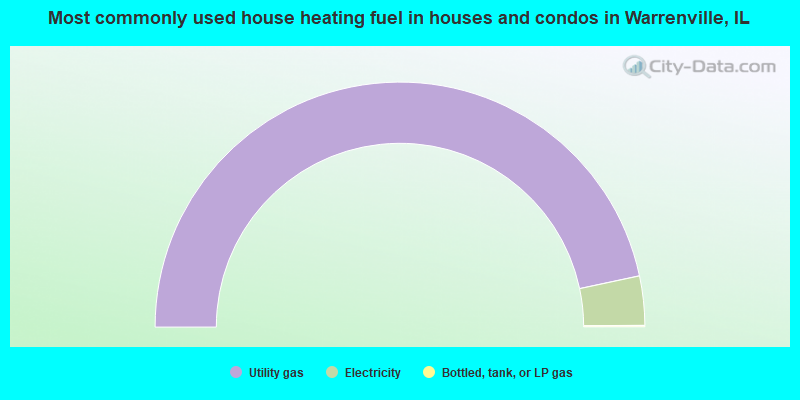
- 93.3%Utility gas
- 6.5%Electricity
- 0.2%Bottled, tank, or LP gas
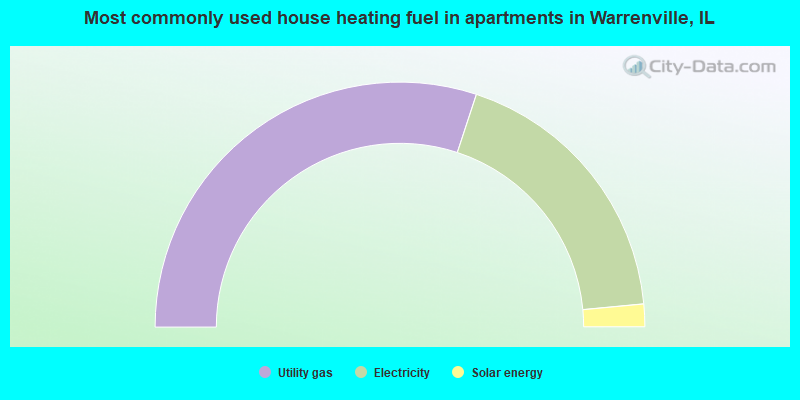
- 60.1%Utility gas
- 36.9%Electricity
- 3.0%Solar energy
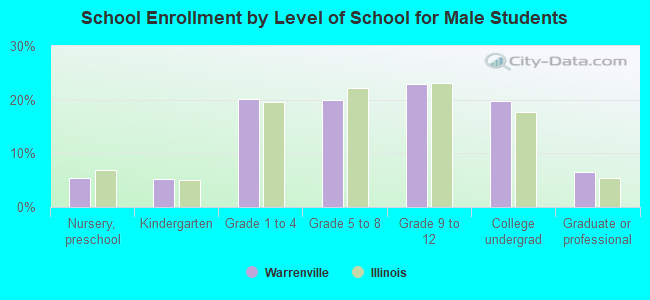
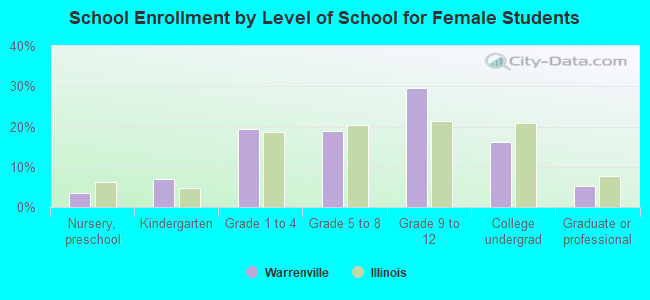
Private vs. public school enrollment:
| Here: | 8.1% |
| Illinois: | 13.3% |
| Here: | 5.0% |
| Illinois: | 9.9% |
| Here: | 29.5% |
| Illinois: | 27.4% |