Washington, IA (Iowa) Houses and Residents
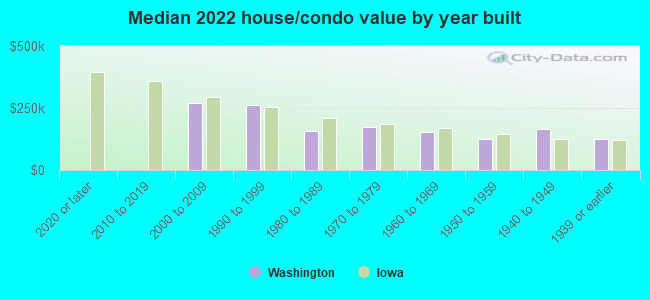
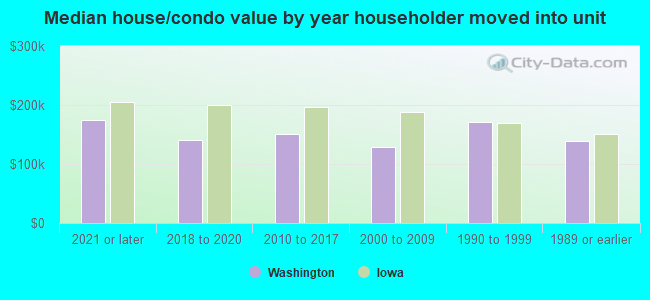
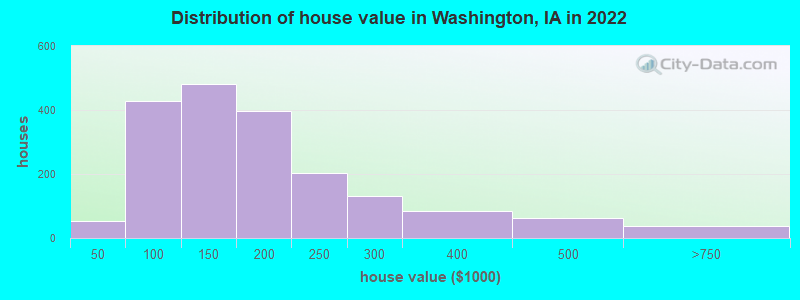
| Washington: | $151,629 |
| Iowa: | $194,600 |
Total population: 7,349 (Urban population: 6,707 (all inside urban clusters), Rural population: 281 (all nonfarm))
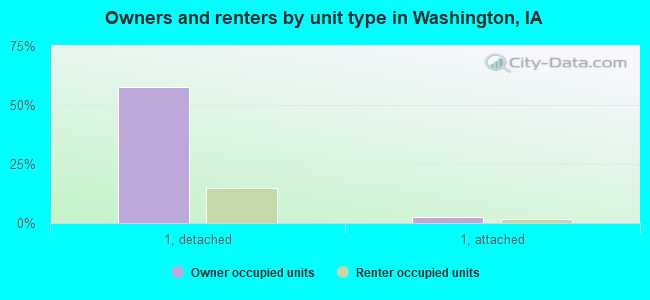
Houses: 3,240 (3,064 occupied: 1,912 owner occupied, 1,201 renter occupied)
| % of renters here: | 39% |
| State: | 28% |
Housing density: 669 houses/condos per square mile
Median price asked for vacant for-sale houses and condos in 2022 in this county: $263,851.
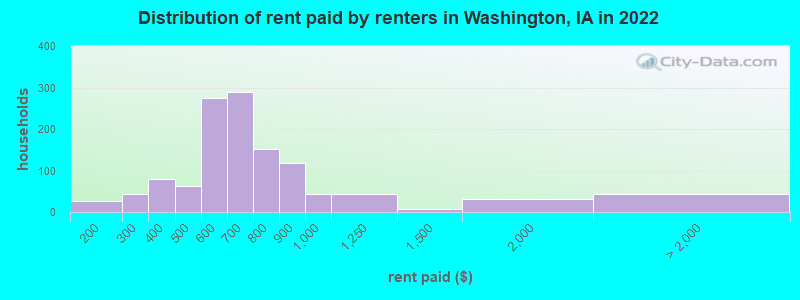
Median contract rent in 2022: $649 (lower quartile is $529, upper quartile is $742)
Median rent asked for vacant for-rent units in 2022: $658
Median gross rent in Washington, IA in 2022: $891
Housing units in Washington with a mortgage: 1,082 (165 second mortgage, 6 home equity loan, 92 both second mortgage and home equity loan)
Houses without a mortgage: 51
Median household income for houses/condos with a mortgage: $77,414
Median household income for apartments without a mortgage: $72,845
Median monthly housing costs: $899
Compare current foreclosures near Washington, IA:
| Photo | Address | Area | Beds / Baths | Price | Details |
|---|---|---|---|---|---|

|
#1
S Avenue D
Washington, IA 52353
|
1,826 sq. feet
|
- baths 3 beds |
show details | |

|
#2
W 6th St
Washington, IA 52353
|
1,146 sq. feet
|
- baths 3 beds |
show details | |

|
#3
E 3rd St
Washington, IA 52353
|
1,728 sq. feet
|
- baths 3 beds |
show details | |

|
#4
S 9th Ave
Washington, IA 52353
|
1,821 sq. feet
|
- baths 3 beds |
show details | |

|
#5
E Jefferson St
Washington, IA 52353
|
1,503 sq. feet
|
- baths 3 beds |
show details | |

|
#6
S Iowa Ave
Washington, IA 52353
|
1,181 sq. feet
|
- baths 3 beds |
show details | |

|
#7
N 6th Ave
Washington, IA 52353
|
1,092 sq. feet
|
- baths 3 beds |
show details | |

|
#8
Highland Ave
Washington, IA 52353
|
- sq. feet
|
- baths - beds |
show details | |

|
#9
W Washington St
Brighton, IA 52540
|
3,156 sq. feet
|
1 baths 4 beds |
$69,900
|
show details |

|
#10
Kentucky Ave
Winfield, IA 52659
|
1,794 sq. feet
|
2 baths 4 beds |
show details |
| Photo | Address | Area | Beds / Baths | Price | Details |
|---|---|---|---|---|---|

|
#11
Kentucky Ave
Winfield, IA 52659
|
1,794 sq. feet
|
2 baths 4 beds |
show details | |

|
#12
5th St
Wellman, IA 52356
|
660 sq. feet
|
- baths 2 beds |
show details | |

|
#13
130th St
Riverside, IA 52327
|
- sq. feet
|
- baths - beds |
show details | |

|
#14
8th Ave
Wellman, IA 52356
|
- sq. feet
|
- baths - beds |
show details | |

|
#15
Highway 1 And 78
Richland, IA 52585
|
- sq. feet
|
- baths - beds |
show details | |

|
#16
Gabriel Ave
Wayland, IA 52654
|
- sq. feet
|
- baths - beds |
show details | |

|
#17
E Washington St Apt C
Brighton, IA 52540
|
- sq. feet
|
- baths - beds |
show details | |

|
#18
Howard St
Kalona, IA 52247
|
- sq. feet
|
- baths - beds |
show details | |

|
Check over 1 million property listings on Foreclosure.com!
|
browse all offers | |||

Latest news about housing in Washington, IA collected exclusively by city-data.com from local newspapers, TV, and radio stations

 | Why is Trump so Popular in Iowa? (152 replies) |
| John Wayne Gacy & others that have ties to Iowa (2 replies) |
| Dog-friendly apartments? (3 replies) |
| Moving from the East Coast to either Iowa, Michigan, or Minnesota (33 replies) |
| Congraulations Iowa! You're now number 1... in Covid! (26 replies) |
| Grad. Student in the Quad Cities searching for safe rental housing (12 replies) |

Median year apartment built: 1958
Household type by relationship:
Households: 7,355- Male householders: 1,319 (317 living alone), Female householders: 1,710 (743 living alone)
1,238 spouses (1,231 opposite-sex spouses), 330 unmarried partners, (330 opposite-sex unmarried partners), 2,120 children (1,967 natural, 52 adopted, 101 stepchildren), 77 grandchildren, 9 brothers or sisters, 35 parents, 0 foster children, 77 other relatives, 202 non-relatives
- In group quarters: 234
Size of family households: 942 2-persons, 210 3-persons, 406 4-persons, 216 5-persons, 71 6-persons.
Size of nonfamily households: 1,103 1-person, 127 2-persons, 29 4-persons.
944 married couples with children.
619 single-parent households (129 men, 490 women).
90.2% of residents of Washington speak English at home.
8.5% of residents speak Spanish at home (35% speak English very well, 28% speak English well, 31% speak English not well, 6% don't speak English at all).
0.5% of residents speak other Indo-European language at home (84% speak English very well, 16% speak English well).
1.3% of residents speak Asian or Pacific Island language at home (62% speak English very well, 7% speak English well, 31% speak English not well).
Foreign born population: 582 (7.9%)
(43.1% of them are naturalized citizens)
| Here: | 6.9 |
| State: | 6.8 |
| Here: | 4.9 |
| State: | 4.2 |
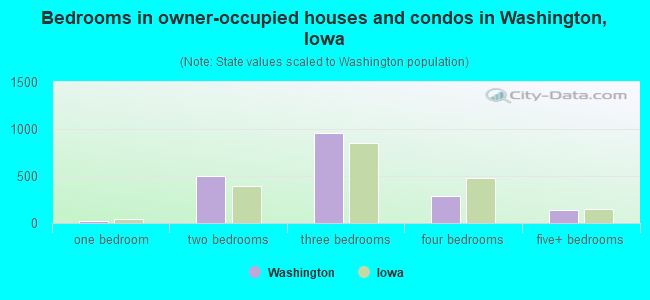
- Bedrooms in owner-occupied houses and condos in Washington, Iowa
- 7no bedroom
- 201 bedroom
- 5032 bedrooms
- 9533 bedrooms
- 2874 bedrooms
- 1425+ bedrooms
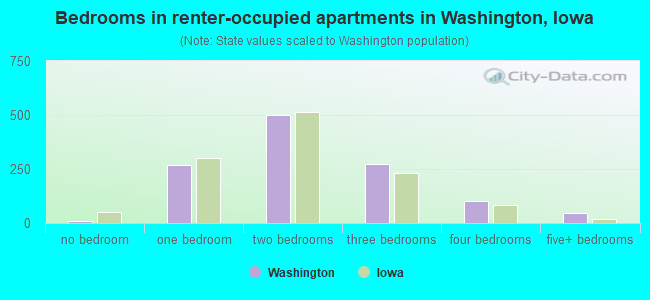
- Bedrooms in renter-occupied apartments in Washington, Iowa
- 9no bedroom
- 2671 bedroom
- 5022 bedrooms
- 2753 bedrooms
- 1034 bedrooms
- 445+ bedrooms
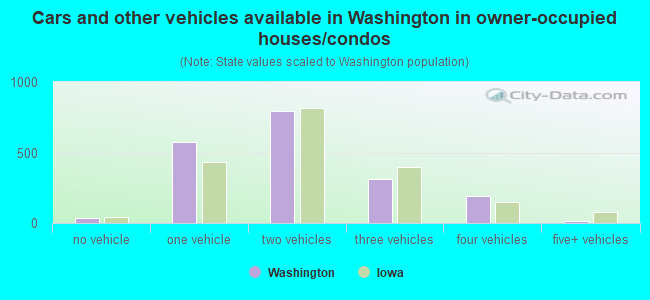
- Cars and other vehicles available in Washington in owner-occupied houses/condos
- 37no vehicle
- 5711 vehicle
- 7942 vehicles
- 3103 vehicles
- 1894 vehicles
- 125+ vehicles
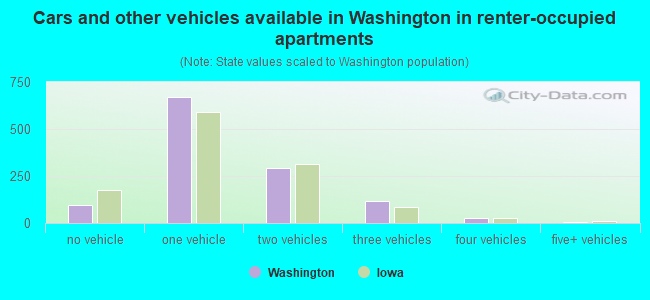
- Cars and other vehicles available in Washington in renter-occupied apartments
- 96no vehicle
- 6691 vehicle
- 2902 vehicles
- 1183 vehicles
- 274 vehicles
- 35+ vehicles
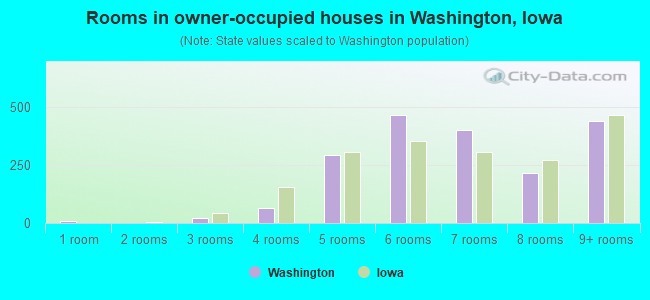
- Rooms in owner-occupied houses in Washington, Iowa
- 71 room
- 02 rooms
- 203 rooms
- 674 rooms
- 2955 rooms
- 4676 rooms
- 4007 rooms
- 2178 rooms
- 4399+ rooms
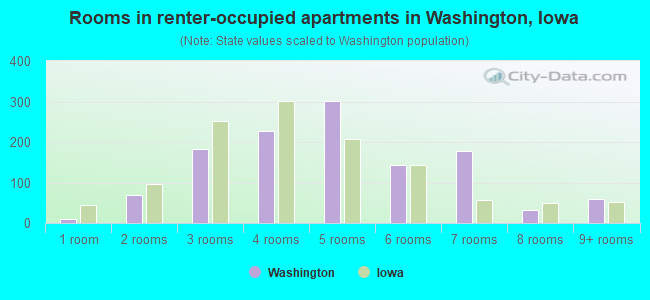
- Rooms in renter-occupied apartments in Washington, Iowa
- 91 room
- 692 rooms
- 1833 rooms
- 2264 rooms
- 3015 rooms
- 1436 rooms
- 1787 rooms
- 338 rooms
- 599+ rooms
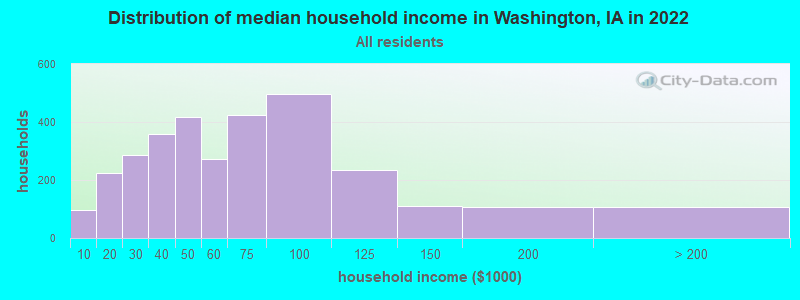
Washington, IA household income distribution

- 98Less than $10,000
- 223$10,000 to $19,999
- 287$20,000 to $29,999
- 360$30,000 to $39,999
- 416$40,000 to $49,999
- 272$50,000 to $59,999
- 424$60,000 to $74,999
- 495$75,000 to $99,999
- 234$100,000 to $124,999
- 110$125,000 to $149,999
- 106$150,000 to $199,999
- 106$200,000 or more
Home value of owner - occupied houses in 2022 in Washington, IA
-
- 14Less than $10,000
- 7$10,000 to $14,999
- 15$25,000 to $29,999
- 17$40,000 to $49,999
- 30$50,000 to $59,999
- 78$60,000 to $69,999
- 123$70,000 to $79,999
- 125$80,000 to $89,999
- 52$90,000 to $99,999
- 286$100,000 to $124,999
- 194$125,000 to $149,999
- 298$150,000 to $174,999
- 98$175,000 to $199,999
- 203$200,000 to $249,999
- 131$250,000 to $299,999
- 82$300,000 to $399,999
- 61$400,000 to $499,999
- 32$500,000 to $749,999
- 7$750,000 to $999,999
Rent paid by renters in 2022 in Washington, IA
-
- 25$100 to $149
- 6$200 to $249
- 36$250 to $299
- 61$300 to $349
- 17$350 to $399
- 38$400 to $449
- 23$450 to $499
- 148$500 to $549
- 125$550 to $599
- 84$600 to $649
- 204$650 to $699
- 142$700 to $749
- 9$750 to $799
- 117$800 to $899
- 43$900 to $999
- 44$1,000 to $1,249
- 8$1,250 to $1,499
- 32$1,500 to $1,999
- 22$2,000 to $2,499
- 20No cash rent
Percentage of workers working in this county: 79.6%
Number of people working at home: 238 (6.8% of all workers)
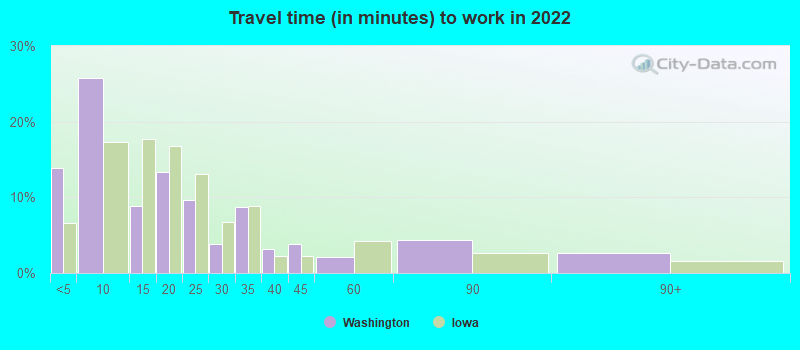
Travel time to work (commute)
- Less than 5 minutes: 644
- 5 to 9 minutes: 1,025
- 10 to 14 minutes: 211
- 15 to 19 minutes: 243
- 20 to 24 minutes: 263
- 25 to 29 minutes: 106
- 30 to 34 minutes: 121
- 35 to 39 minutes: 120
- 40 to 44 minutes: 167
- 45 to 59 minutes: 281
- 60 to 89 minutes: 24
- 90 or more minutes: 0
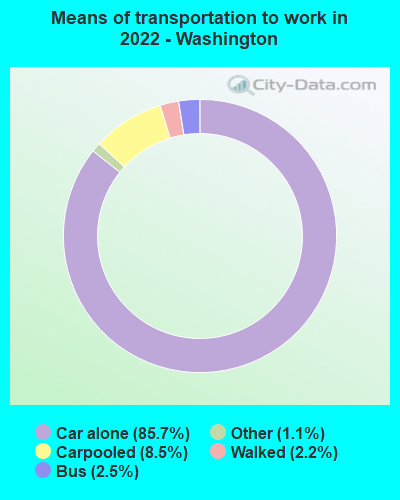
Means of transportation to work:
- Drove a car alone: 3,495 (79.8%)
- Carpooled: 367 (8.4%)
- Bus: 105 (2.4%)
- Taxi: 41 (0.9%)
- Walked: 88 (2.0%)
- Worked at home: 238 (5.4%)
- Unemployment by race in 2022
- Unemployment rate for White non-Hispanic residents
- 0.7%Males
- 2.9%Females
- Unemployment rate for other race residents
- 15.3%Females
- Unemployment rate for Hispanic or Latino residents
- 5.2%Males
- 6.4%Females
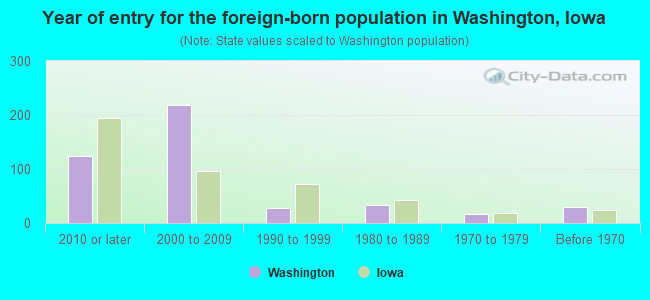
- Year of entry for the foreign-born population in Washington, Iowa
- 1252010 or later
- 2192000 to 2009
- 271990 to 1999
- 331980 to 1989
- 171970 to 1979
- 30Before 1970
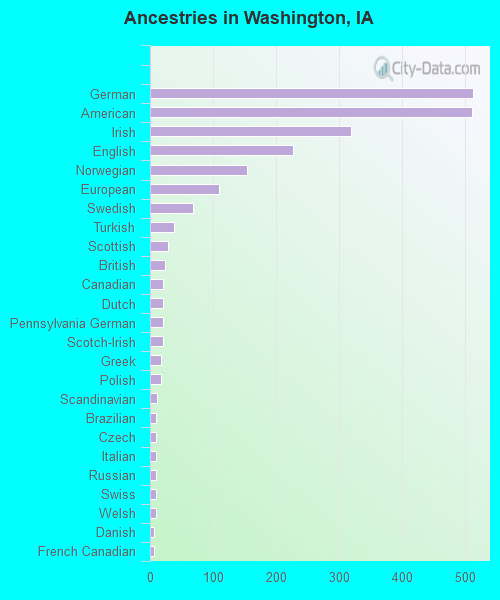
First ancestries reported:
- German: 512 (15.8%)
- American: 511 (15.7%)
- Irish: 319 (9.8%)
- English: 227 (7.0%)
- Norwegian: 154 (4.7%)
- European: 110 (3.4%)
- Swedish: 68 (2.1%)
- Turkish: 38 (1.2%)
- Scottish: 29 (0.9%)
- British: 23 (0.7%)
- Canadian: 20 (0.6%)
- Dutch: 20 (0.6%)
- Pennsylvania German: 20 (0.6%)
- Scotch-Irish: 20 (0.6%)
- Greek: 17 (0.5%)
- Polish: 17 (0.5%)
- Scandinavian: 11 (0.3%)
- Brazilian: 10 (0.3%)
- Czech: 10 (0.3%)
- Italian: 10 (0.3%)
- Russian: 9 (0.3%)
- Swiss: 9 (0.3%)
- Welsh: 9 (0.3%)
- Danish: 6 (0.2%)
- French Canadian: 6 (0.2%)
- Serbian: 4 (0.1%)
Most common places of birth for foreign-born residents (%):
| Washington: | 52.1% (289) |
| Iowa: | 23.3% (41,625) |
| Washington: | 22.3% (124) |
| Iowa: | 3.2% (5,672) |
| Washington: | 5.6% (31) |
| Iowa: | 4.6% (8,194) |
| Washington: | 3.8% (21) |
| Iowa: | 2.6% (4,675) |
| Washington: | 3.6% (20) |
| Iowa: | 0.2% (287) |
| Washington: | 3.2% (18) |
| Iowa: | 1.0% (1,803) |
| Washington: | 2.3% (13) |
| Iowa: | 0.5% (848) |
| Washington: | 2.3% (13) |
| Iowa: | 0.7% (1,326) |
| Washington: | 2.2% (12) |
| Iowa: | 0.7% (1,209) |
Place of birth for U.S.-born residents:
- This state: 5,348
- Other state: 1,444
- Northeast: 54
- Midwest: 894
- South: 268
- West: 226
83.1% of Washington residents lived in the same house 1 years ago.
Out of people who lived in different houses, 38.2% lived in this county.
Out of people who lived in different counties, 59.2% lived in Iowa.
| Washington: | 83.1% |
| State average: | 87.2% |
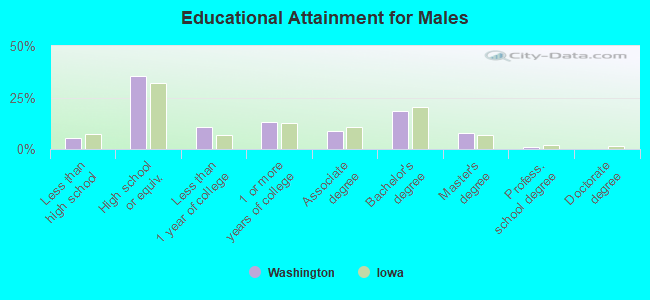
Education attainment for males 25 years and older:
- No schooling: 14
- Nursery to 4th grade: 8
- 5th and 6th grade: 27
- 7th and 8th grade: 0
- 9th grade: 5
- 10th grade: 33
- 11th grade: 2
- 12th grade, no diploma: 34
- High school graduate (or equivalency): 788
- Less than 1 year of college: 238
- Some college more than 1 year, no degree: 289
- Associate degree: 192
- Bachelor's degree: 412
- Master's degree: 174
- Professional school degree: 18
- Doctorate degree: 0
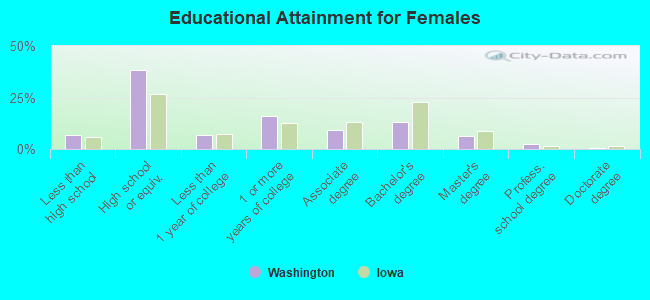
Education attainment for females 25 years and older:
- No schooling: 28
- Nursery to 4th grade: 57
- 5th and 6th grade: 30
- 7th and 8th grade: 0
- 9th grade: 6
- 10th grade: 25
- 11th grade: 24
- 12th grade, no diploma: 12
- High school graduate (or equivalency): 1,063
- Less than 1 year of college: 193
- Some college more than 1 year, no degree: 439
- Associate degree: 255
- Bachelor's degree: 358
- Master's degree: 179
- Professional school degree: 73
- Doctorate degree: 18


Housing units in structures:
- One, detached: 2,396
- One, attached: 120
- Two: 178
- 3 or 4: 116
- 5 to 9: 157
- 10 to 19: 137
- 20 to 49: 78
- 50 or more: 32
- Mobile homes: 16
- Boats, RVs, vans, etc.: 6
Housing units lacking complete kitchen facilities in 2022: 1.4%
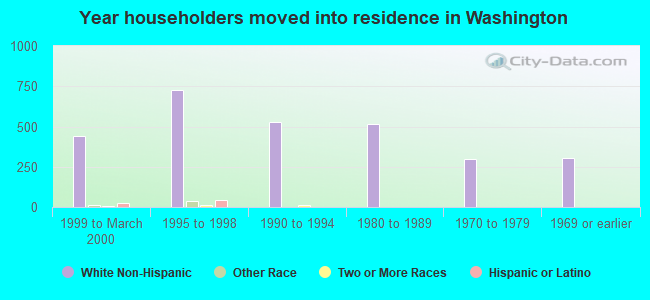
House/condo owner moved in on average 10 years ago
Renter moved in on average 4 years ago
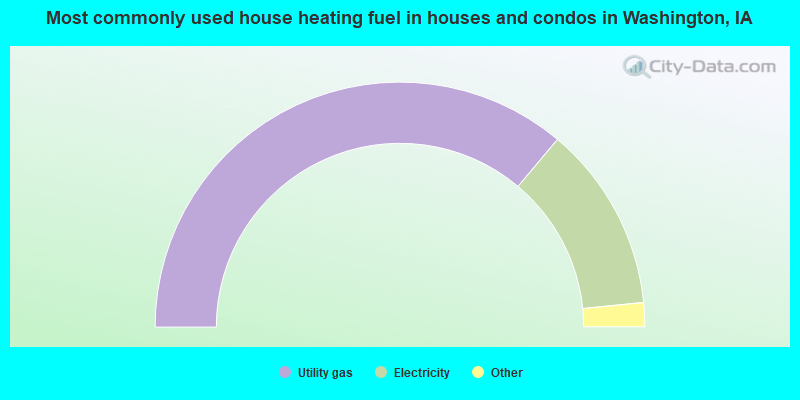
- 72.3%Utility gas
- 24.6%Electricity
- 1.8%Bottled, tank, or LP gas
- 0.6%Other fuel
- 0.4%Wood
- 0.4%No fuel used
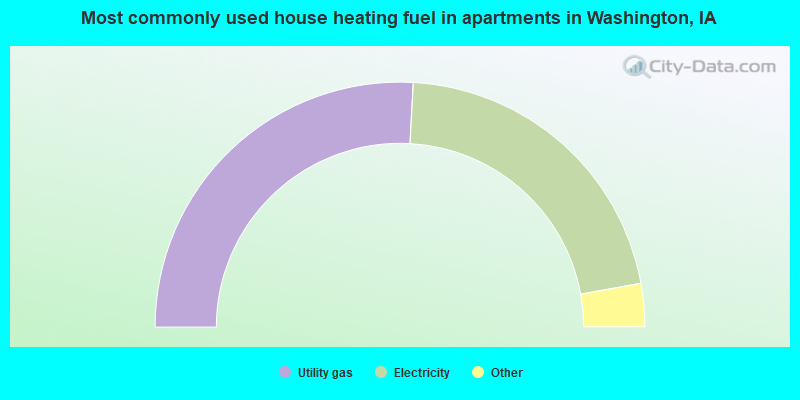
- 51.8%Utility gas
- 42.6%Electricity
- 3.2%No fuel used
- 1.8%Other fuel
- 0.6%Bottled, tank, or LP gas
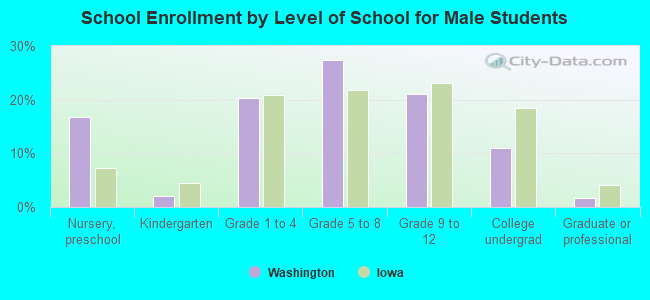
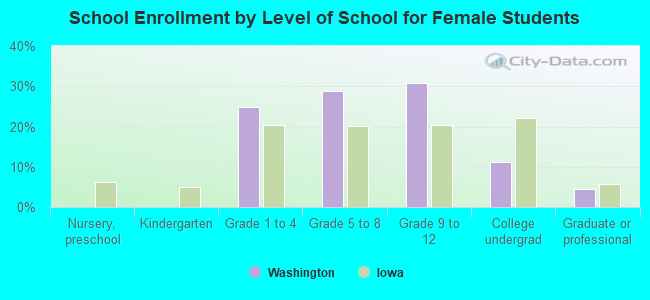
Private vs. public school enrollment:
| Here: | 0.0% |
| Iowa: | 10.6% |
| Here: | 0.0% |
| Iowa: | 7.9% |
| Here: | 23.7% |
| Iowa: | 23.9% |