Wawayanda, NY (New York) Houses and Residents
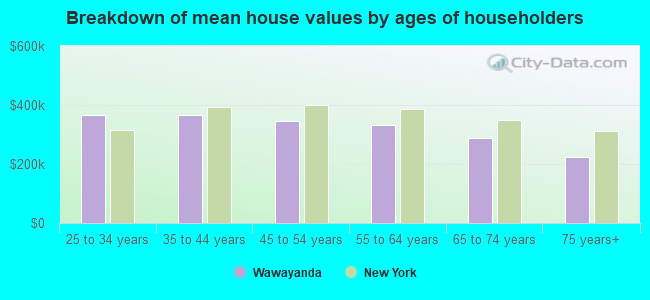
| Wawayanda: | $400,225 |
| New York: | $400,400 |
Total population: 7,266 (Urban population: 1,335, Rural population: 4,938 (121 farm, 4,817 nonfarm))
Houses: 2,174 (2,095 occupied: 1,791 owner occupied, 304 renter occupied)
| % of renters here: | 15% |
| State: | 46% |
Housing density: 62 houses/condos per square mile
Median price asked for vacant for-sale houses and condos in 2022 in this county: $283,793.
Median contract rent in 2022: $1,346 (lower quartile is $956, upper quartile is $1,873)
Median rent asked for vacant for-rent units in 2022: $211
Median gross rent in Wawayanda, NY in 2022: $1,635
Housing units in Wawayanda with a mortgage: 1,102 (116 second mortgage, 102 home equity loan, 9 both second mortgage and home equity loan)
Houses without a mortgage: 368
Compare current foreclosures near Wawayanda, NY:
| Photo | Address | Area | Beds / Baths | Price | Details |
|---|---|---|---|---|---|

|
#1
Maiden Ln
Maybrook, NY 12543
|
770 sq. feet
|
1 baths 2 beds |
$345,000
|
show details |

|
#2
Lake Shore Dr E
Rock Hill, NY 12775
|
2,820 sq. feet
|
3 baths 4 beds |
$439,900
|
show details |

|
#3
Locust Rd
Sussex, NJ 07461
|
830 sq. feet
|
1 baths 3 beds |
$385,000
|
show details |

|
#4
State St
Middletown, NY 10940
|
1,000 sq. feet
|
1 baths 3 beds |
$365,000
|
show details |

|
#5
Phlox Ter
Glenwood, NJ 07418
|
2,448 sq. feet
|
2 baths 3 beds |
$356,900
|
show details |

|
#6
Paul Ct
Washingtonville, NY 10992
|
3,100 sq. feet
|
3 baths 4 beds |
show details | |

|
#7
Hickory Ln
Vernon, NJ 07462
|
652 sq. feet
|
1 baths 2 beds |
show details | |

|
#8
E Lakeshore Dr
Highland Lakes, NJ 07422
|
1,276 sq. feet
|
1 baths 3 beds |
show details | |

|
#9
Birch St
Bloomingburg, NY 12721
|
2,604 sq. feet
|
2 baths 5 beds |
show details | |

|
#10
Lincoln Dr
Washingtonville, NY 10992
|
960 sq. feet
|
1 baths 3 beds |
show details |
| Photo | Address | Area | Beds / Baths | Price | Details |
|---|---|---|---|---|---|

|
#11
Dolsontown Rd
Middletown, NY 10940
|
- sq. feet
|
1 baths 2 beds |
show details | |

|
#12
Scotchtown Collabar Rd
Middletown, NY 10941
|
2,887 sq. feet
|
3 baths 4 beds |
show details | |

|
#13
Main St
Sparrow Bush, NY 12780
|
1,824 sq. feet
|
1 baths 3 beds |
show details | |

|
#14
Wedgewood Dr
Goshen, NY 10924
|
1,284 sq. feet
|
1 baths 3 beds |
show details | |

|
#15
Raleigh Close
Middletown, NY 10940
|
1,608 sq. feet
|
1 baths 3 beds |
show details | |

|
#16
Old Anvil Ln
Middletown, NY 10940
|
1,452 sq. feet
|
2 baths 3 beds |
show details | |

|
#17
Wickham Dr
Warwick, NY 10990
|
925 sq. feet
|
1 baths 3 beds |
show details | |

|
#18
Ferguson Ln
Wurtsboro, NY 12790
|
- sq. feet
|
- baths - beds |
$36,900
|
show details |

|
#19
Sarine Rd
Wurtsboro, NY 12790
|
1,657 sq. feet
|
2 baths 4 beds |
show details | |

|
#20
Marian Ct
Warwick, NY 10990
|
1,248 sq. feet
|
1 baths 2 beds |
show details |
| Photo | Address | Area | Beds / Baths | Price | Details |
|---|---|---|---|---|---|

|
#21
Maple Trl
Wurtsboro, NY 12790
|
1,136 sq. feet
|
1 baths 1 beds |
show details | |

|
#22
Howard Dr
Middletown, NY 10941
|
1,892 sq. feet
|
2 baths 3 beds |
show details | |

|
#23
Warwick Tpke
Hewitt, NJ 07421
|
1,888 sq. feet
|
2 baths 3 beds |
show details | |

|
#24
Fire Tower Rd
Bloomingburg, NY 12721
|
2,256 sq. feet
|
2 baths 4 beds |
show details | |

|
#25
Sagamore Dr
Otisville, NY 10963
|
1,710 sq. feet
|
1 baths 3 beds |
show details | |

|
#26
Roe Rd
Bloomingburg, NY 12721
|
1,862 sq. feet
|
2 baths 3 beds |
show details | |

|
#27
Youngblood Rd
Montgomery, NY 12549
|
2,781 sq. feet
|
2 baths 4 beds |
show details | |

|
#28
Oxford Rd
Chester, NY 10918
|
1,400 sq. feet
|
1 baths 3 beds |
show details | |

|
#29
Marc Ln
Wurtsboro, NY 12790
|
1,008 sq. feet
|
2 baths 3 beds |
show details | |

|
#30
Conklin Rd
Warwick, NY 10990
|
5,326 sq. feet
|
5 baths 8 beds |
show details |
| Photo | Address | Area | Beds / Baths | Price | Details |
|---|---|---|---|---|---|

|
#31
Joshua Dr
Bloomingburg, NY 12721
|
2,320 sq. feet
|
4 baths 4 beds |
show details | |

|
#32
Grosso Ct
Montgomery, NY 12549
|
2,496 sq. feet
|
2 baths 4 beds |
show details | |

|
#33
Hickory Ln
Monroe, NY 10950
|
960 sq. feet
|
2 baths 3 beds |
show details | |

|
#34
Dunthorne Dr
Bloomingburg, NY 12721
|
2,110 sq. feet
|
1 baths 4 beds |
show details | |

|
#35
Stone Schoolhouse Rd
Bloomingburg, NY 12721
|
2,278 sq. feet
|
2 baths 4 beds |
show details | |

|
#36
Hulsetown Rd
Campbell Hall, NY 10916
|
3,024 sq. feet
|
2 baths 4 beds |
show details | |

|
#37
Dickerson Ave
Montgomery, NY 12549
|
3,102 sq. feet
|
2 baths 4 beds |
show details | |

|
#38
Beyers Rd
Montgomery, NY 12549
|
3,889 sq. feet
|
4 baths 4 beds |
show details | |

|
#39
View Point Dr
Slate Hill, NY 10973
|
2,106 sq. feet
|
2 baths 3 beds |
show details | |

|
#40
Sussex St
Port Jervis, NY 12771
|
2,724 sq. feet
|
2 baths 4 beds |
show details |
| Photo | Address | Area | Beds / Baths | Price | Details |
|---|---|---|---|---|---|

|
#41
Howe St
Warwick, NY 10990
|
1,264 sq. feet
|
1 baths 2 beds |
show details | |

|
#42
Whispering Hls
Chester, NY 10918
|
1,331 sq. feet
|
2 baths 3 beds |
show details | |

|
#43
Melissa Ter
Middletown, NY 10941
|
3,266 sq. feet
|
2 baths 4 beds |
show details | |

|
#44
Scotty Ter
Circleville, NY 10919
|
1,860 sq. feet
|
2 baths 3 beds |
show details | |

|
#45
Prosperous Valley Rd
Middletown, NY 10940
|
1,823 sq. feet
|
2 baths 4 beds |
show details | |

|
#46
Nancy Ln
Chester, NY 10918
|
2,906 sq. feet
|
2 baths 3 beds |
show details | |

|
#47
Lindsey Rd
Warwick, NY 10990
|
1,392 sq. feet
|
2 baths 3 beds |
show details | |

|
#48
Lindsey Rd
Warwick, NY 10990
|
1,392 sq. feet
|
2 baths 3 beds |
show details | |

|
#49
Colonial Ave
Warwick, NY 10990
|
1,306 sq. feet
|
2 baths 4 beds |
show details | |

|
Check over 1 million property listings on Foreclosure.com!
|
browse all offers | |||

Household type by relationship:
Households: 360,583- In family households: 317,442 (63,291 male householders, 28,166 female householders)
69,510 spouses, 125,783 children (119,039 natural, 2,320 adopted, 4,424 stepchildren), 6,501 grandchildren, 3,433 brothers or sisters, 3,829 parents, foster children, 5,071 other relatives, 8,812 non-relatives
- In nonfamily households: 43,141 (15,980 male householders (12,145 living alone)), 18,488 female householders (15,623 living alone)), 8,673 nonrelatives
- In group quarters: 12,230 (5,044 institutionalized population)
72,993 married couples with children.
18,103 single-parent households (4,320 men, 13,783 women).
88.8% of residents of Wawayanda speak English at home.
4.2% of residents speak Spanish at home (68% speak English very well, 12% speak English well, 11% speak English not well, 10% don't speak English at all).
6.9% of residents speak other Indo-European language at home (70% speak English very well, 15% speak English well, 15% speak English not well).
0.1% of residents speak Asian or Pacific Island language at home (100% speak English very well).
Foreign born population: 836 (11.2%)
(82.8% of them are naturalized citizens)
| Here: | 6.7 |
| State: | 6.3 |
| Here: | 4.3 |
| State: | 3.8 |
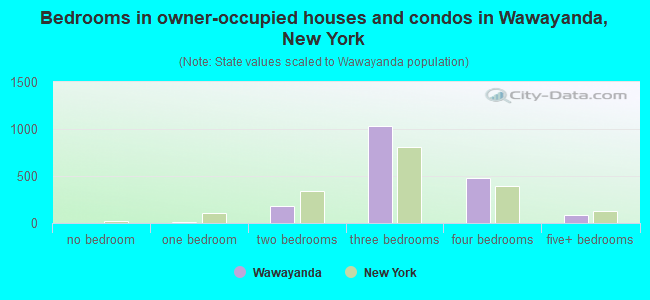
- Bedrooms in owner-occupied houses and condos in Wawayanda, New York
- 0no bedroom
- 61 bedroom
- 1852 bedrooms
- 1,0293 bedrooms
- 4834 bedrooms
- 885+ bedrooms
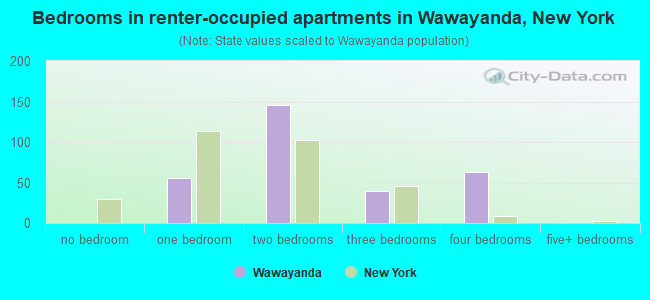
- Bedrooms in renter-occupied apartments in Wawayanda, New York
- 0no bedroom
- 561 bedroom
- 1462 bedrooms
- 393 bedrooms
- 634 bedrooms
- 05+ bedrooms
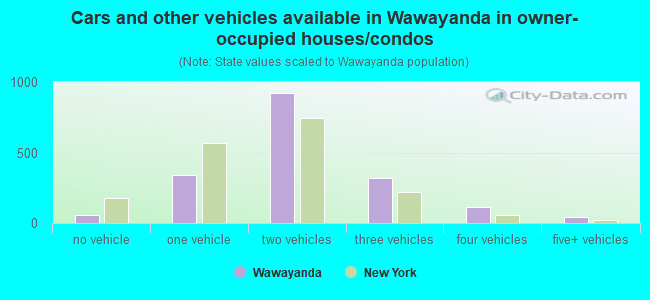
- Cars and other vehicles available in Wawayanda in owner-occupied houses/condos
- 59no vehicle
- 3381 vehicle
- 9242 vehicles
- 3173 vehicles
- 1104 vehicles
- 435+ vehicles
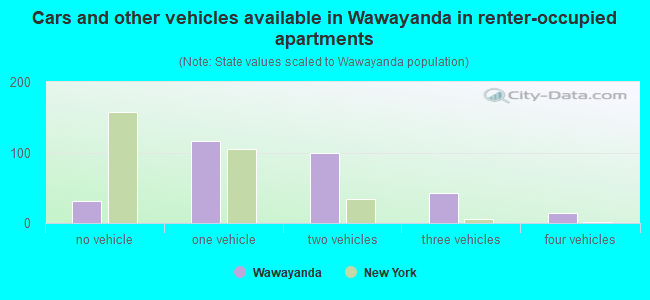
- Cars and other vehicles available in Wawayanda in renter-occupied apartments
- 31no vehicle
- 1171 vehicle
- 1002 vehicles
- 423 vehicles
- 144 vehicles
- 05+ vehicles
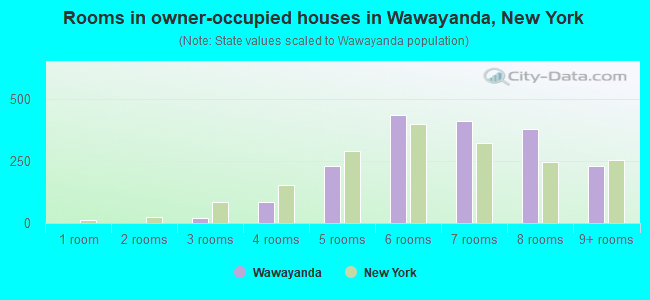
- Rooms in owner-occupied houses in Wawayanda, New York
- 01 room
- 02 rooms
- 193 rooms
- 834 rooms
- 2325 rooms
- 4366 rooms
- 4117 rooms
- 3818 rooms
- 2299+ rooms
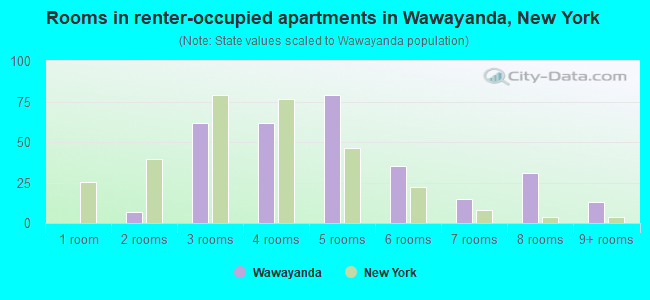
- Rooms in renter-occupied apartments in Wawayanda, New York
- 01 room
- 72 rooms
- 623 rooms
- 624 rooms
- 795 rooms
- 356 rooms
- 157 rooms
- 318 rooms
- 139+ rooms
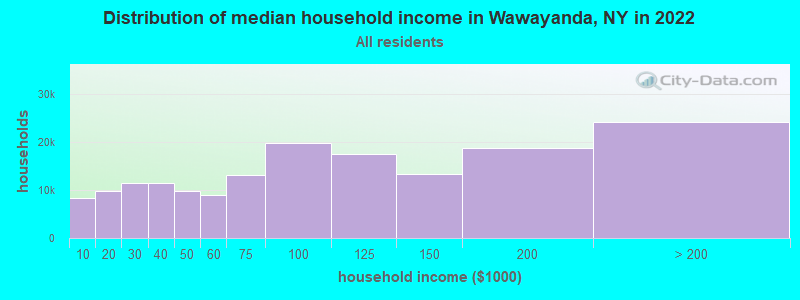
Wawayanda, NY household income distribution

- 8,229Less than $10,000
- 9,874$10,000 to $19,999
- 11,499$20,000 to $29,999
- 11,453$30,000 to $39,999
- 9,684$40,000 to $49,999
- 8,884$50,000 to $59,999
- 13,031$60,000 to $74,999
- 19,863$75,000 to $99,999
- 17,496$100,000 to $124,999
- 13,340$125,000 to $149,999
- 18,639$150,000 to $199,999
- 24,147$200,000 or more
Percentage of workers working in this county: 85.0%
Number of people working at home: 418 (11.9% of all workers)
Travel time to work (commute)
- Less than 5 minutes: 118
- 5 to 9 minutes: 225
- 10 to 14 minutes: 425
- 15 to 19 minutes: 539
- 20 to 24 minutes: 381
- 25 to 29 minutes: 96
- 30 to 34 minutes: 236
- 35 to 39 minutes: 89
- 40 to 44 minutes: 31
- 45 to 59 minutes: 234
- 60 to 89 minutes: 268
- 90 or more minutes: 159
Means of transportation to work:
- Drove a car alone: 2,488 (86.0%)
- Carpooled: 161 (5.6%)
- Bus or trolley bus: 65 (2.2%)
- Railroad: 5 (0.2%)
- Walked: 76 (2.6%)
- Other means: 6 (0.2%)
- Worked at home: 93 (3.2%)
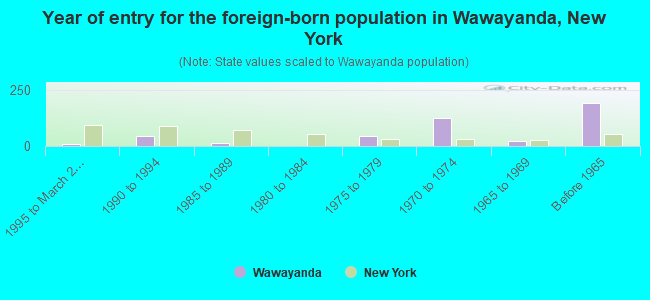
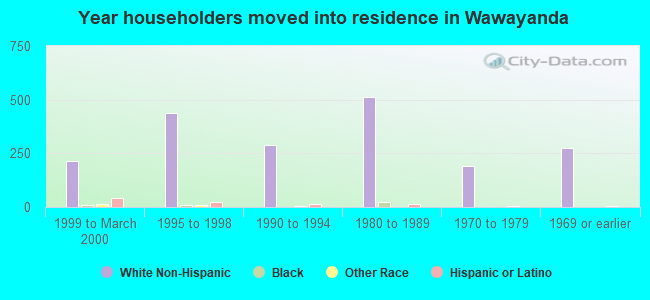
- Year of entry for the foreign-born population in Wawayanda, New York
- 91995 to March 2000
- 451990 to 1994
- 121985 to 1989
- 01980 to 1984
- 451975 to 1979
- 1241970 to 1974
- 231965 to 1969
- 191Before 1965
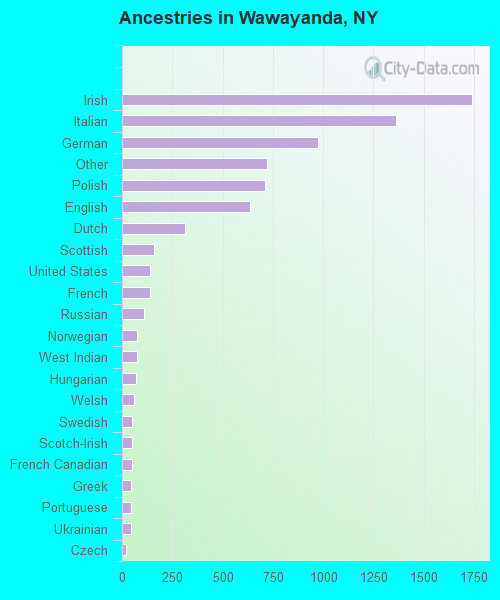
First ancestries reported:
- Irish: 1,738 (22.8%)
- Italian: 1,362 (17.9%)
- German: 973 (12.8%)
- Other: 722 (9.5%)
- Polish: 712 (9.3%)
- English: 637 (8.3%)
- Dutch: 314 (4.1%)
- Scottish: 157 (2.1%)
- United States: 141 (1.8%)
- French: 138 (1.8%)
- Russian: 107 (1.4%)
- Norwegian: 76 (1.0%)
- West Indian: 73 (1.0%)
- Hungarian: 68 (0.9%)
- Welsh: 61 (0.8%)
- Swedish: 50 (0.7%)
- Scotch-Irish: 49 (0.6%)
- French Canadian: 48 (0.6%)
- Greek: 45 (0.6%)
- Portuguese: 43 (0.6%)
- Ukrainian: 43 (0.6%)
- Czech: 21 (0.3%)
- Subsaharan African: 15 (0.2%)
- Lithuanian: 12 (0.2%)
- Swiss: 7 (0.09%)
- Arab: 6 (0.08%)
- Slovak: 6 (0.08%)
- Danish: 5 (0.07%)
Most common places of birth for foreign-born residents (%):
| Wawayanda: | 24.3% (109) |
| New York: | 3.8% (147,729) |
| Wawayanda: | 9.6% (43) |
| New York: | 1.8% (69,327) |
| Wawayanda: | 8.5% (38) |
| New York: | 0.2% (8,655) |
| Wawayanda: | 7.1% (32) |
| New York: | 0.2% (6,545) |
| Wawayanda: | 6.7% (30) |
| New York: | 4.2% (161,189) |
| Wawayanda: | 6.0% (27) |
| New York: | 3.0% (117,238) |
| Wawayanda: | 4.2% (19) |
| New York: | 1.4% (54,876) |
| Wawayanda: | 3.3% (15) |
| New York: | 0.3% (13,114) |
| Wawayanda: | 3.1% (14) |
| New York: | 1.1% (42,335) |
| Wawayanda: | 2.9% (13) |
| New York: | 0.5% (17,906) |
| Wawayanda: | 2.7% (12) |
| New York: | 2.4% (93,187) |
| Wawayanda: | 2.7% (12) |
| New York: | 0.2% (7,442) |
| Wawayanda: | 2.7% (12) |
| New York: | 5.9% (226,470) |
| Wawayanda: | 2.2% (10) |
| New York: | 0.8% (32,034) |
| Wawayanda: | 2.2% (10) |
| New York: | 1.9% (72,408) |
| Wawayanda: | 2.2% (10) |
| New York: | 1.1% (43,314) |
| Wawayanda: | 1.8% (8) |
| New York: | 0.5% (19,907) |
| Wawayanda: | 1.6% (7) |
| New York: | 0.3% (11,299) |
Place of birth for U.S.-born residents:
- This state: 4,916
- Other state: 842
- Northeast: 585
- Midwest: 79
- South: 160
- West: 18
66% of Wawayanda residents lived in the same house 5 years ago.
Out of people who lived in different houses, 68% lived in this county.
Out of people who lived in different counties, 84% lived in New York.
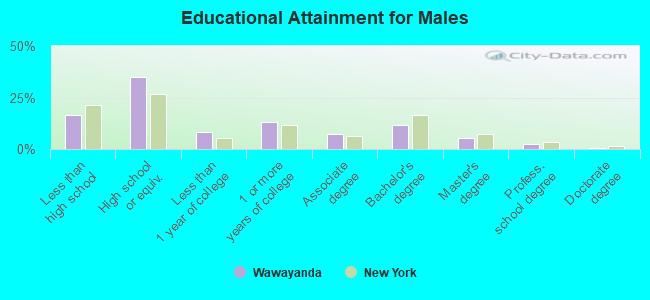
Education attainment for males 25 years and older:
- No schooling: 19
- Nursery to 4th grade: 0
- 5th and 6th grade: 13
- 7th and 8th grade: 35
- 9th grade: 41
- 10th grade: 53
- 11th grade: 72
- 12th grade, no diploma: 85
- High school graduate (or equivalency): 684
- Less than 1 year of college: 162
- Some college more than 1 year, no degree: 257
- Associate degree: 144
- Bachelor's degree: 231
- Master's degree: 102
- Professional school degree: 45
- Doctorate degree: 7
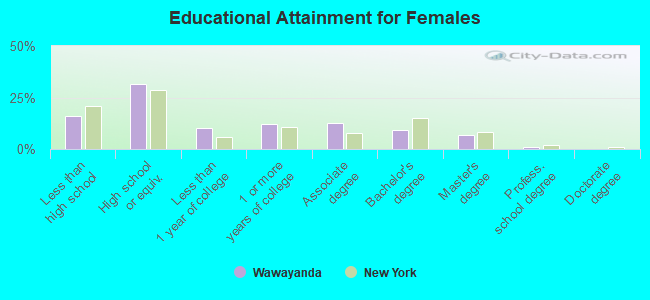
Education attainment for females 25 years and older:
- No schooling: 6
- Nursery to 4th grade: 0
- 5th and 6th grade: 20
- 7th and 8th grade: 60
- 9th grade: 46
- 10th grade: 101
- 11th grade: 56
- 12th grade, no diploma: 52
- High school graduate (or equivalency): 671
- Less than 1 year of college: 211
- Some college more than 1 year, no degree: 257
- Associate degree: 269
- Bachelor's degree: 199
- Master's degree: 140
- Professional school degree: 24
- Doctorate degree: 5
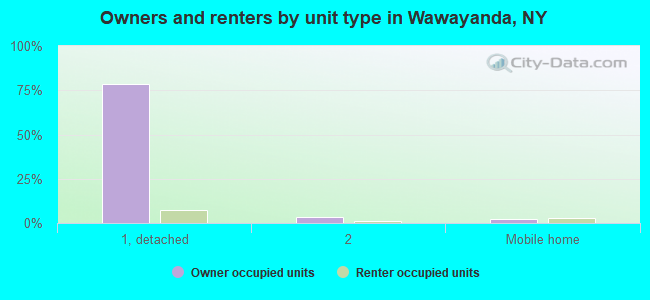
Housing units in structures:
- One, detached: 1,840
- One, attached: 40
- Two: 121
- 3 or 4: 33
- 5 to 9: 20
- Mobile homes: 120
Median worth of mobile homes: $148,679
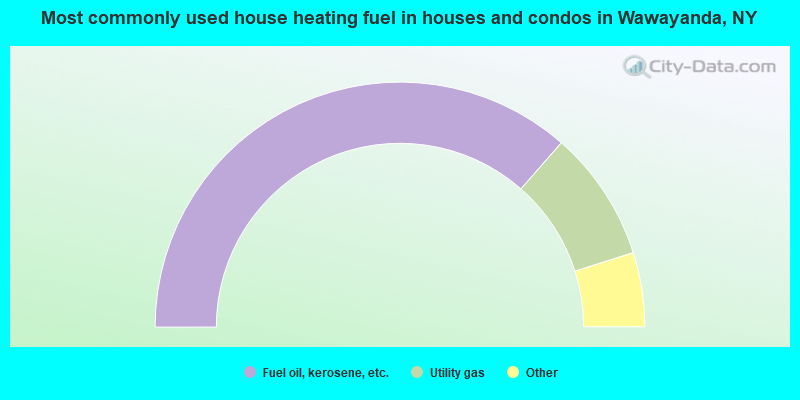
- 73.0%Fuel oil, kerosene, etc.
- 17.3%Utility gas
- 4.0%Electricity
- 3.2%Bottled, tank, or LP gas
- 2.2%Wood
- 0.3%Other fuel
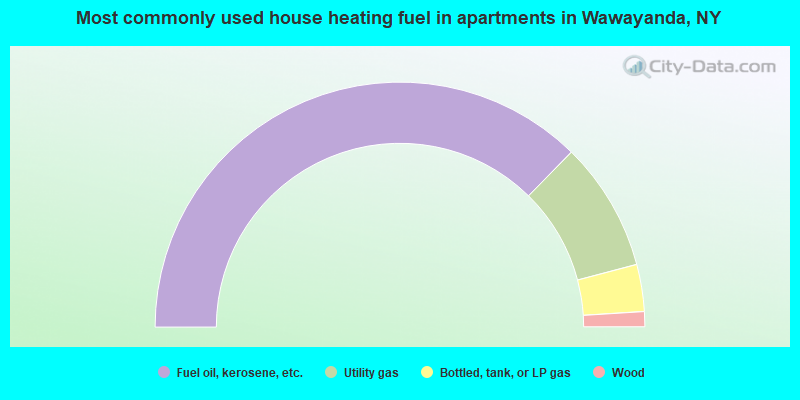
- 74.7%Fuel oil, kerosene, etc.
- 17.1%Utility gas
- 6.2%Bottled, tank, or LP gas
- 2.0%Wood
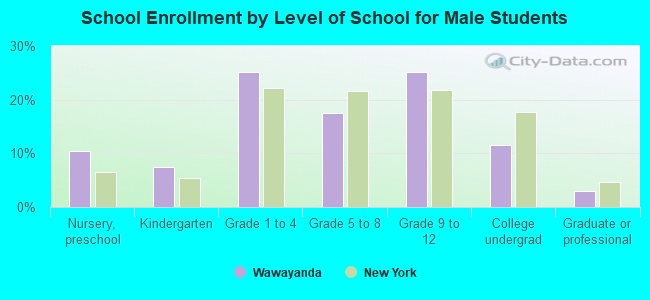
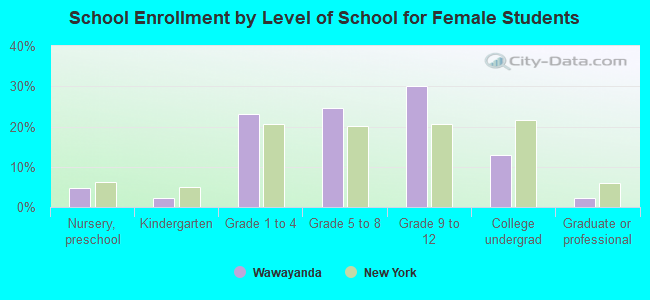
Private vs. public school enrollment:
| Here: | 9.7% |
| New York: | 14.0% |
| Here: | 2.5% |
| New York: | 13.2% |
| Here: | 28.3% |
| New York: | 38.2% |