West Islip, NY (New York) Houses and Residents
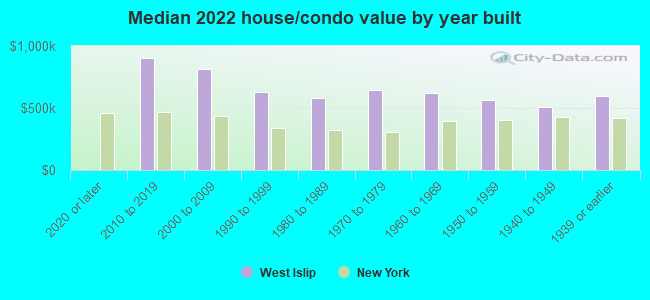
Estimated median house or condo value in 2022: $607,964 (it was $207,500 in 2000 )
West Islip:
$607,964New York:
$400,400
Lower value quartile - upper value quartile: $481,520 - $729,230Total population: 28,335 (All urban)
Houses: 8,829 (8,689 occupied: 8,406 owner occupied, 278 renter occupied )
% of renters here:
3%State:
46%
Housing density: 1,425 houses/condos per square mile
Median price asked for vacant for-sale houses and condos in 2022: $788,970.
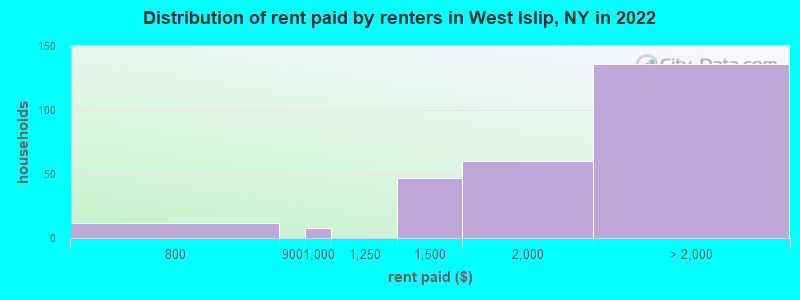
Median contract rent in 2022: $1,996 (lower quartile is $1,410, upper quartile is over $2,000)
Median rent asked for vacant for-rent units in 2022: $2,783
Median gross rent in West Islip, NY in 2022: over $2,000
Housing units in West Islip with a mortgage: 5,792 (758 second mortgage, 0 home equity loan, 683 both second mortgage and home equity loan )Houses without a mortgage: 436
Median household income for houses/condos with a mortgage: $172,056
Median household income for apartments without a mortgage: $122,344
Median monthly housing costs: $2,869
Data:
Median house or condo value ($)
Median house or condo value ($ change since 2000)
Median house or condo value ($) - White
Median house or condo value ($) - Black or African American
Median house or condo value ($) - Asian
Median house or condo value ($) - Hispanic or Latino
Median house or condo value ($) - American Indian and Alaska Native
Median house or condo value ($) - Multirace
Median house or condo value ($) - Other Race
Median price asked for mobile homes ($)
Household density (households per square mile)
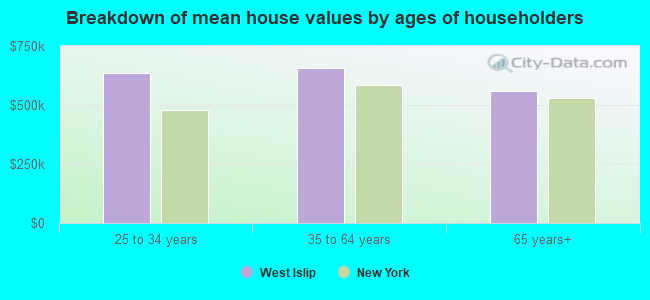
Mean house or condo value by units in structure - 1, detached ($)
Mean house or condo value by units in structure - 1, attached ($)
Mean house or condo value by units in structure - 2 ($)
Mean house or condo value by units in structure by units in structure - 3 or 4 ($)
Mean house or condo value by units in structure - 5 or more ($)
Mean house or condo value by units in structure - Boat, RV, van, etc. ($)
Mean house or condo value by units in structure - Mobile home ($)
Median contract rent ($)
Median contract rent - Lower quartile ($)
Median contract rent - Upper quartile ($)
Median gross rent ($)
Urban houses (%)
Rural houses (%)
Houses occupied (%)
Houses occupied (% change since 2000)
Houses owner occupied (%)
Houses owner occupied (% change since 2000)
Houses renter occupied (%)
Houses renter occupied (% change since 2000)
Vacant housing units - For rent (%)
Vacant housing units - For rent (% change since 2000)
Vacant housing units - For sale only (%)
Vacant housing units - For sale only (% change since 2000)
Vacant housing units - Rented or sold, not occupied (%)
Vacant housing units - Rented or sold, not occupied (% change since 2000)
Vacant housing units - For seasonal, recreational, or occasional use (%)
Vacant housing units - For seasonal, recreational, or occasional use (% change since 2000)
Vacant housing units - For migrant workers (%)
Vacant housing units - For migrant workers (% change since 2000)
Vacant housing units - Other vacant (%)
Vacant housing units - Other vacant (% change since 2000)
Median monthly housing costs ($)
Median household income for houses/condos with a mortgage ($)
Median household income for houses/condos without a mortgage ($)
Median household income ($)
Median household income ($) - White
Median household income ($) - Black or African American
Median household income ($) - Asian
Median household income ($) - Hispanic or Latino
Median household income ($) - American Indian and Alaska Native
Median household income ($) - Multirace
Median household income ($) - Other Race
Mortgage status - with mortgage (%)
Mortgage status - with second mortgage (%)
Mortgage status - with home equity loan (%)
Mortgage status - with both second mortgage and home equity loan (%)
Mortgage status - without a mortgage (%)
Median year house/condo built
Median year apartment built
Household type by relationship - Male householder living alone (%)
Household type by relationship - Male householder not living alone (%)
Household type by relationship - Female householder living alone (%)
Household type by relationship - Female householder not living alone (%)
Household type by relationship - Opposite-Sex spouse (%)
Household type by relationship - Same-Sex spouse (%)
Household type by relationship - Opposite-Sex unmarried partner (%)
Household type by relationship - Same-Sex unmarried partner (%)
Household type by relationship - In group quarters (%)
Size of family households - 2-person household (%)
Size of family households - 3-person household (%)
Size of family households - 4-person household (%)
Size of family households - 5-person household (%)
Size of family households - 6-person household (%)
Size of family households - 7-or-more-person household (%)
Size of nonfamily households - 1-person household (%)
Size of nonfamily households - 2-person household (%)
Size of nonfamily households - 3-person household (%)
Size of nonfamily households - 4-person household (%)
Size of nonfamily households - 5-person household (%)
Size of nonfamily households - 6-person household (%)
Size of nonfamily households - 7-or-moreperson household (%)
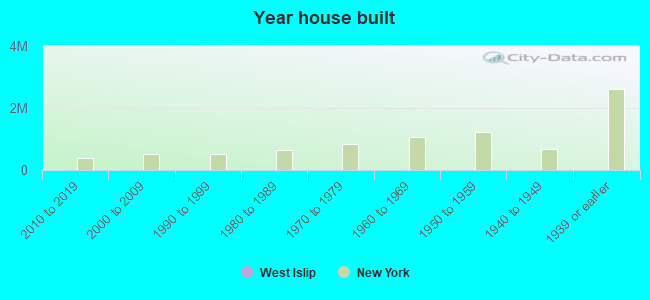
Year house built - Built 2010 or later (%)
Year house built - Built 2000 to 2009 (%)
Year house built - Built 1990 to 1999 (%)
Year house built - Built 1980 to 1989 (%)
Year house built - Built 1970 to 1979 (%)
Year house built - Built 1960 to 1969 (%)
Year house built - Built 1950 to 1959 (%)
Year house built - Built 1940 to 1949 (%)
Year house built - Built 1939 or earlier (%)
Median number of rooms in houses and condos
Median number of rooms in apartments
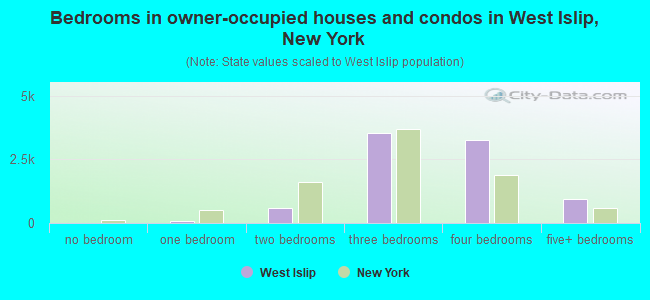
Median number of bedrooms in owner occupied houses
Mean number of bedrooms in owner occupied houses
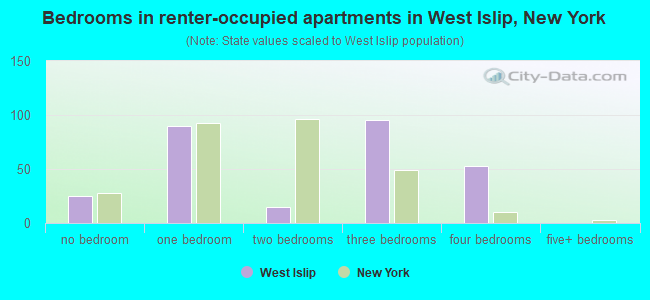
Median number of bedrooms in renter occupied houses
Mean number of bedrooms in renter occupied houses
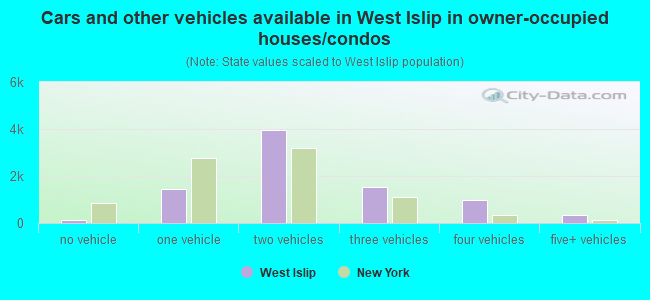
Median number of vehichles in owner occupied houses
Mean number of vehichles in owner occupied houses
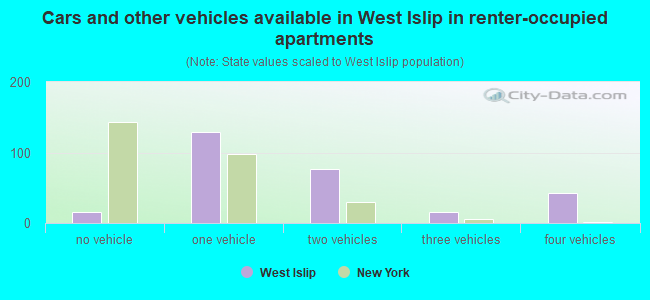
Median number of vehichles in renter occupied houses
Mean number of vehichles in renter occupied houses
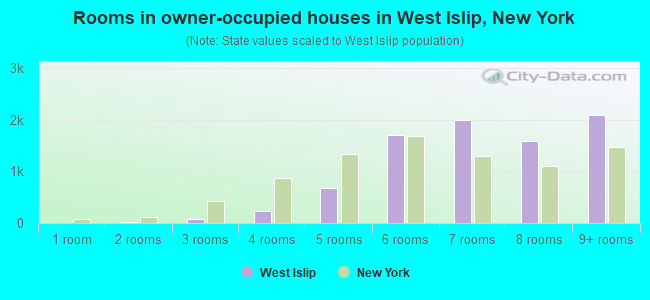
Rooms in owner-occupied houses - 1 room (%)
Rooms in owner-occupied houses - 2 rooms (%)
Rooms in owner-occupied houses - 3 rooms (%)
Rooms in owner-occupied houses - 4 rooms (%)
Rooms in owner-occupied houses - 5 rooms (%)
Rooms in owner-occupied houses - 6 rooms (%)
Rooms in owner-occupied houses - 7 rooms (%)
Rooms in owner-occupied houses - 8 rooms (%)
Rooms in owner-occupied houses - 9+ rooms (%)
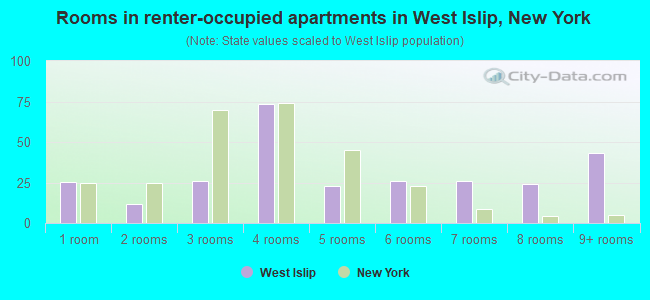
Rooms in renter-occupied houses - 1 room (%)
Rooms in renter-occupied houses - 2 rooms (%)
Rooms in renter-occupied houses - 3 rooms (%)
Rooms in renter-occupied houses - 4 rooms (%)
Rooms in renter-occupied houses - 5 rooms (%)
Rooms in renter-occupied houses - 6 rooms (%)
Rooms in renter-occupied houses - 7 rooms (%)
Rooms in renter-occupied houses - 8 rooms (%)
Rooms in renter-occupied houses - 9+ rooms (%)
Bedrooms in owner-occupied houses - no bedrooms (%)
Bedrooms in owner-occupied houses - 1 bedroom (%)
Bedrooms in owner-occupied houses - 2 bedrooms (%)
Bedrooms in owner-occupied houses - 3 bedrooms (%)
Bedrooms in owner-occupied houses - 4 bedrooms (%)
Bedrooms in owner-occupied houses - 5+ bedrooms (%)
Bedrooms in renter-occupied houses - no bedrooms (%)
Bedrooms in renter-occupied houses - 1 bedroom (%)
Bedrooms in renter-occupied houses - 2 bedrooms (%)
Bedrooms in renter-occupied houses - 3 bedrooms (%)
Bedrooms in renter-occupied houses - 4 bedrooms (%)
Bedrooms in renter-occupied houses - 5+ bedrooms (%)
Vehicles available in owner-occupied houses - no vehicle available (%)
Vehicles available in owner-occupied houses - 1 vehicle available(%)
Vehicles available in owner-occupied houses - 2 Vehicles available (%)
Vehicles available in owner-occupied houses - 3 Vehicles available (%)
Vehicles available in owner-occupied houses - 4 Vehicles available (%)
Vehicles available in owner-occupied houses - 5+ Vehicles available (%)
Vehicles available in renter-occupied houses - no vehicle available (%)
Vehicles available in renter-occupied houses - 1 vehicle available (%)
Vehicles available in renter-occupied houses - 2 Vehicles available (%)
Vehicles available in renter-occupied houses - 3 Vehicles available (%)
Vehicles available in renter-occupied houses - 4 Vehicles available (%)
Vehicles available in renter-occupied houses - 5+ Vehicles available (%)
Housing units in structures - 1, detached (%)
Housing units in structures - 1, attached (%)
Housing units in structures - 2 (%)
Housing units in structures - 3 or 4 (%)
Housing units in structures - 5 to 9 (%)
Housing units in structures - 10 to 19 (%)
Housing units in structures - 20 to 49 (%)
Housing units in structures - 50 or more (%)
Housing units in structures - Mobile home (%)
Housing units in structures - Boat, RV, van, etc. (%)
Housing units in structures - Owners - 1, detached (%)
Housing units in structures - Owners - 1, attached (%)
Housing units in structures - Owners - 2 (%)
Housing units in structures - Owners - 3 or 4 (%)
Housing units in structures - Owners - 5 to 9 (%)
Housing units in structures - Owners - 10 to 19 (%)
Housing units in structures - Owners - 20 to 49 (%)
Housing units in structures - Owners - 50 or more (%)
Housing units in structures - Owners - Mobile home (%)
Housing units in structures - Owners - Boat, RV, van, etc. (%)
Housing units in structures - Renters - 1, detached (%)
Housing units in structures - Renters - 1, attached (%)
Housing units in structures - Renters - 2 (%)
Housing units in structures - Renters - 3 or 4 (%)
Housing units in structures - Renters - 5 to 9 (%)
Housing units in structures - Renters - 10 to 19 (%)
Housing units in structures - Renters - 20 to 49 (%)
Housing units in structures - Renters - 50 or more (%)
Housing units in structures - Renters - Mobile home (%)
Housing units in structures - Renters - Boat, RV, van, etc. (%)
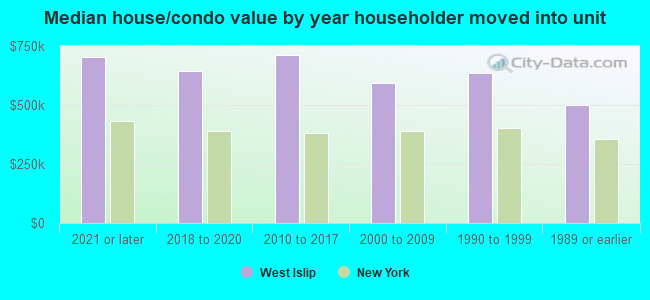
House/condo owner moved in on average (years ago)
Renter moved in on average (years ago)
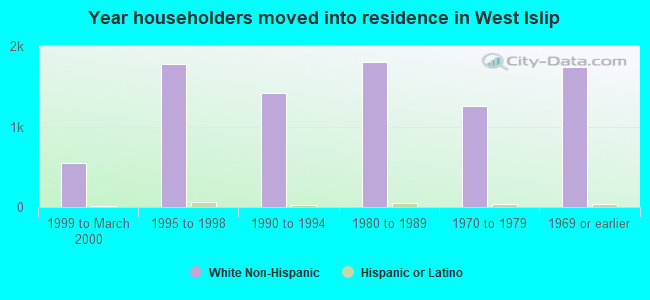
Year householder moved into unit - Moved in 1999 to March 2000 (%)
Year householder moved into unit - Moved in 1999 to March 2000 (%) - White
Year householder moved into unit - Moved in 1999 to March 2000 (%) - Black or African American
Year householder moved into unit - Moved in 1999 to March 2000 (%) - Asian
Year householder moved into unit - Moved in 1999 to March 2000 (%) - Hispanic or Latino
Year householder moved into unit - Moved in 1999 to March 2000 (%) - American Indian and Alaska Native
Year householder moved into unit - Moved in 1999 to March 2000 (%) - Multirace
Year householder moved into unit - Moved in 1999 to March 2000 (%) - Other Race
Year householder moved into unit - Moved in 1995 to 1998 (%)
Year householder moved into unit - Moved in 1995 to 1998 (%) - White
Year householder moved into unit - Moved in 1995 to 1998 (%) - Black or African American
Year householder moved into unit - Moved in 1995 to 1998 (%) - Asian
Year householder moved into unit - Moved in 1995 to 1998 (%) - Hispanic or Latino
Year householder moved into unit - Moved in 1995 to 1998 (%) - American Indian and Alaska Native
Year householder moved into unit - Moved in 1995 to 1998 (%) - Multirace
Year householder moved into unit - Moved in 1995 to 1998 (%) - Other Race
Year householder moved into unit - Moved in 1990 to 1994 (%)
Year householder moved into unit - Moved in 1990 to 1994 (%) - White
Year householder moved into unit - Moved in 1990 to 1994 (%) - Black or African American
Year householder moved into unit - Moved in 1990 to 1994 (%) - Asian
Year householder moved into unit - Moved in 1990 to 1994 (%) - Hispanic or Latino
Year householder moved into unit - Moved in 1990 to 1994 (%) - American Indian and Alaska Native
Year householder moved into unit - Moved in 1990 to 1994 (%) - Multirace
Year householder moved into unit - Moved in 1990 to 1994 (%) - Other Race
Year householder moved into unit - Moved in 1980 to 1989 (%)
Year householder moved into unit - Moved in 1980 to 1989 (%) - White
Year householder moved into unit - Moved in 1980 to 1989 (%) - Black or African American
Year householder moved into unit - Moved in 1980 to 1989 (%) - Asian
Year householder moved into unit - Moved in 1980 to 1989 (%) - Hispanic or Latino
Year householder moved into unit - Moved in 1980 to 1989 (%) - American Indian and Alaska Native
Year householder moved into unit - Moved in 1980 to 1989 (%) - Multirace
Year householder moved into unit - Moved in 1980 to 1989 (%) - Other Race
Year householder moved into unit - Moved in 1970 to 1979 (%)
Year householder moved into unit - Moved in 1970 to 1979 (%) - White
Year householder moved into unit - Moved in 1970 to 1979 (%) - Black or African American
Year householder moved into unit - Moved in 1970 to 1979 (%) - Asian
Year householder moved into unit - Moved in 1970 to 1979 (%) - Hispanic or Latino
Year householder moved into unit - Moved in 1970 to 1979 (%) - American Indian and Alaska Native
Year householder moved into unit - Moved in 1970 to 1979 (%) - Multirace
Year householder moved into unit - Moved in 1970 to 1979 (%) - Other Race
Year householder moved into unit - Moved in 1969 or earlier (%)
Year householder moved into unit - Moved in 1969 or earlier (%) - White
Year householder moved into unit - Moved in 1969 or earlier (%) - Black or African American
Year householder moved into unit - Moved in 1969 or earlier (%) - Asian
Year householder moved into unit - Moved in 1969 or earlier (%) - Hispanic or Latino
Year householder moved into unit - Moved in 1969 or earlier (%) - American Indian and Alaska Native
Year householder moved into unit - Moved in 1969 or earlier (%) - Multirace
Year householder moved into unit - Moved in 1969 or earlier (%) - Other Race
Housing units lacking complete plumbing facilities (%)
Housing units lacking complete kitchen facilities (%)
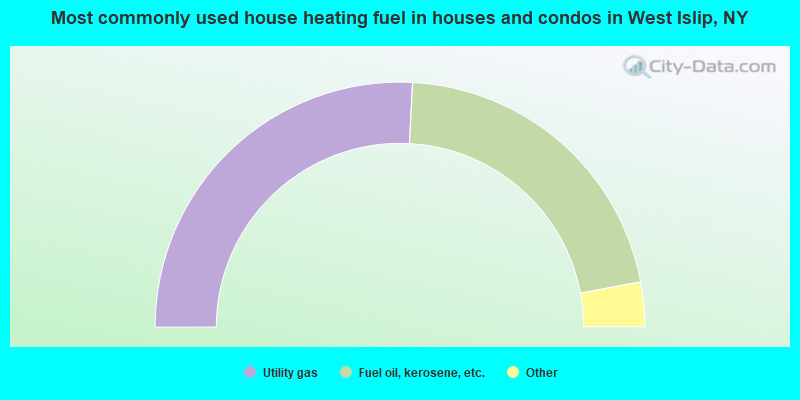
House heating fuel used in houses and condos - Utility gas (%)
House heating fuel used in houses and condos - Bottled, tank, or LP gas (%)
House heating fuel used in houses and condos - Electricity (%)
House heating fuel used in houses and condos - Fuel oil, kerosene, etc. (%)
House heating fuel used in houses and condos - Coal or coke (%)
House heating fuel used in houses and condos - Wood (%)
House heating fuel used in houses and condos - Solar energy (%)
House heating fuel used in houses and condos - Other fuel (%)
House heating fuel used in houses and condos - No fuel used (%)
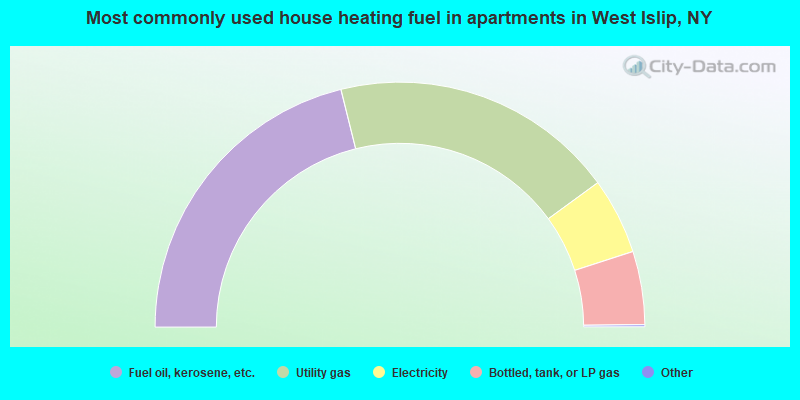
House heating fuel used in apartments - Utility gas (%)
House heating fuel used in apartments - Bottled, tank, or LP gas (%)
House heating fuel used in apartments - Electricity (%)
House heating fuel used in apartments - Fuel oil, kerosene, etc. (%)
House heating fuel used in apartments - Coal or coke (%)
House heating fuel used in apartments - Wood (%)
House heating fuel used in apartments - Solar energy (%)
House heating fuel used in apartments - Other fuel (%)
House heating fuel used in apartments - No fuel used (%)
Median year house/condo built: 1961Median year apartment built: 1959Household type by relationship:
Households: 27,209
Male householders: 4,527 (489 living alone ), Female householders: 4,141 (730 living alone )6,112 spouses (6,053 opposite-sex spouses ), 413 unmarried partners , (373 opposite-sex unmarried partners ), 9,737 children (9,580 natural , 88 adopted , 69 stepchildren ), 545 grandchildren , 118 brothers or sisters , 248 parents , 0 foster children , 331 other relatives , 755 non-relatives In group quarters: 278
Size of family households: 2,439 2-persons , 1,778 3-persons , 1,928 4-persons , 696 5-persons , 120 6-persons , 113 7-or-more-persons .
Size of nonfamily households: 1,229 1-person , 299 2-persons , 34 3-persons , 10 5-persons .
4,162 married couples with children. single-parent households (106 men , 549 women ).
87.8% of residents of West Islip speak English at home. of residents speak Spanish at home (85% speak English very well , 12% speak English well , 2% speak English not well , 2% don't speak English at all ).of residents speak other Indo-European language at home (77% speak English very well , 15% speak English well , 7% speak English not well , 1% don't speak English at all ).of residents speak Asian or Pacific Island language at home (48% speak English very well , 31% speak English well , 18% speak English not well , 3% don't speak English at all ).of residents speak other language at home (39% speak English very well , 61% speak English well ).
Foreign born population: 1,771 (6.5%)of them are naturalized citizens )
Median number of rooms in houses and condos:
Median number of rooms in apartments
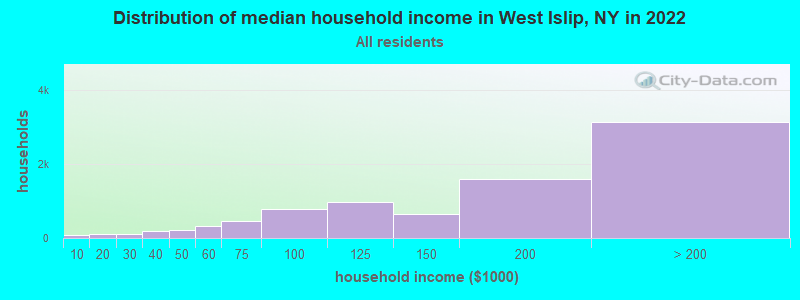
West Islip, NY household income distribution 68 Less than $10,000120 $10,000 to $19,999117 $20,000 to $29,999194 $30,000 to $39,999217 $40,000 to $49,999333 $50,000 to $59,999471 $60,000 to $74,999784 $75,000 to $99,999978 $100,000 to $124,999654 $125,000 to $149,9991,578 $150,000 to $199,9993,125 $200,000 or more
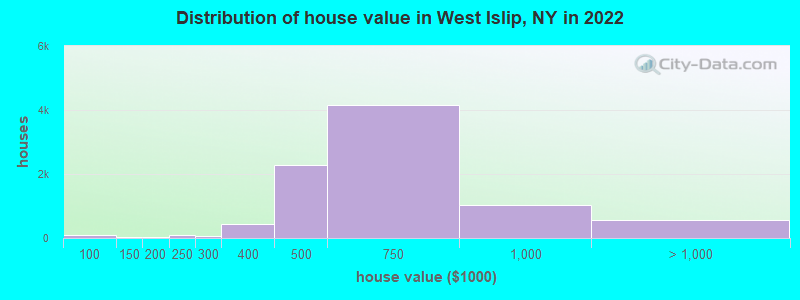
Home value of owner - occupied houses in 2022 in West Islip, NY 3 $25,000 to $29,99921 $40,000 to $49,99920 $50,000 to $59,99918 $60,000 to $69,99921 $80,000 to $89,99921 $90,000 to $99,99917 $100,000 to $124,99912 $150,000 to $174,99920 $175,000 to $199,999103 $200,000 to $249,99963 $250,000 to $299,999423 $300,000 to $399,9992,288 $400,000 to $499,9994,156 $500,000 to $749,9991,025 $750,000 to $999,999382 $1,000,000 to $1,499,99985 $1,500,000 to $1,999,99997 $2,000,000 or moreRent paid by renters in 2022 in West Islip, NY 11 $750 to $7998 $900 to $99947 $1,250 to $1,49959 $1,500 to $1,99935 $2,000 to $2,49955 $2,500 to $2,99935 $3,000 to $3,4999 No cash rent
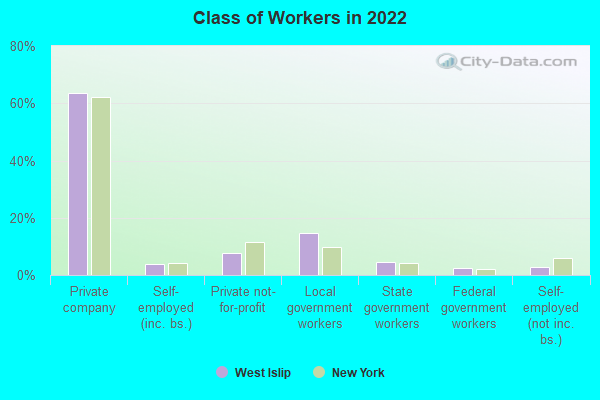
Percentage of workers working in this county: 74.2%Number of people working at home: 2,338 (15.2% of all workers )
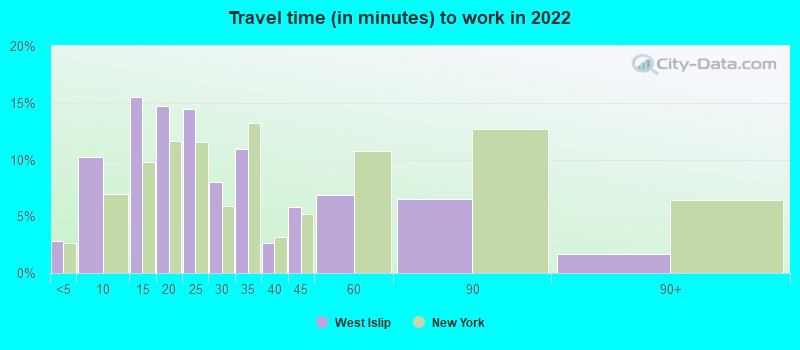
Travel time to work (commute)
Less than 5 minutes: 3075 to 9 minutes: 1,25810 to 14 minutes: 1,67615 to 19 minutes: 1,61320 to 24 minutes: 1,81025 to 29 minutes: 1,21030 to 34 minutes: 1,15935 to 39 minutes: 41540 to 44 minutes: 68845 to 59 minutes: 1,18460 to 89 minutes: 89590 or more minutes: 951
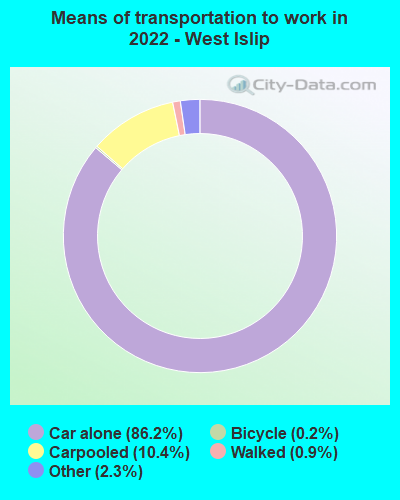
Means of transportation to work:
Drove a car alone: 8,241 (69.4%)Carpooled: 1,139 (9.6%)Taxi: 273 (2.3%)Bicycle: 15 (0.1%)Walked: 95 (0.8%)Worked at home: 2,338 (19.7%)
Unemployment by race in 2022
Unemployment rate for White non-Hispanic residents 4.3% Males2.2% FemalesUnemployment rate for other race residents 5.4% FemalesUnemployment rate for two or more race residents 5.1% FemalesUnemployment rate for Hispanic or Latino residents 3.2% Males1.4% Females
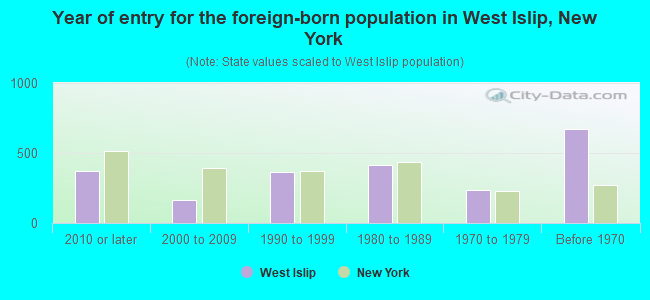
Year of entry for the foreign-born population in West Islip, New York
374 2010 or later 164 2000 to 2009 362 1990 to 1999 410 1980 to 1989 236 1970 to 1979 670 Before 1970
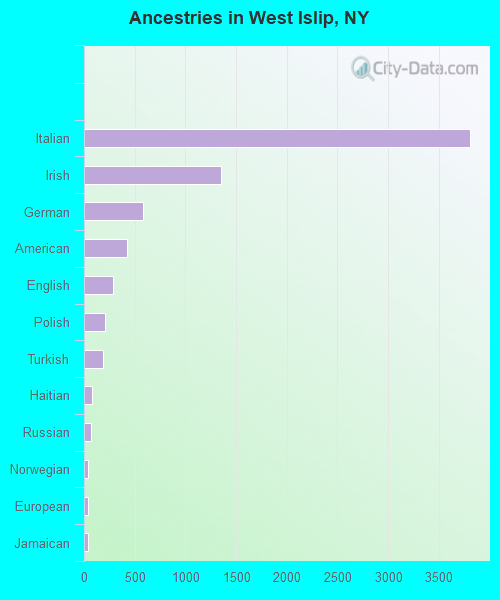
First ancestries reported:
Italian: 3,805 (40.5%)
Irish: 1,352 (14.4%)
German: 583 (6.2%)
American: 424 (4.5%)
English: 284 (3.0%)
Polish: 206 (2.2%)
Turkish: 184 (2.0%)
Haitian: 75 (0.8%)
Russian: 69 (0.7%)
Norwegian: 43 (0.5%)
European: 42 (0.4%)
Jamaican: 38 (0.4%)
Hungarian: 33 (0.4%)
Egyptian: 25 (0.3%)
Scottish: 25 (0.3%)
Greek: 24 (0.3%)
Portuguese: 23 (0.2%)
Guyanese: 22 (0.2%)
Brazilian: 21 (0.2%)
Maltese: 21 (0.2%)
Eastern European: 21 (0.2%)
Armenian: 19 (0.2%)
Czechoslovakian: 16 (0.2%)
French Canadian: 13 (0.1%)
Dutch: 12 (0.1%)
Ukrainian: 12 (0.1%)
Lithuanian: 10 (0.1%)
French: 9 (0.10%)
Bulgarian: 8 (0.09%)
Croatian: 8 (0.09%)
Latvian: 8 (0.09%)
Austrian: 7 (0.07%)
Estonian: 7 (0.07%)
Welsh: 5 (0.05%)
Czech: 4 (0.04%)
Northern European: 4 (0.04%)
Danish: 3 (0.03%)
Nigerian: 2 (0.02%) Most common places of birth for foreign-born residents (%): Italy West Islip:
8.5% (139)New York:
1.8% (81,374)
India West Islip:
8.3% (136)New York:
3.5% (158,432)
Philippines West Islip:
6.4% (105)New York:
2.0% (91,070)
Germany West Islip:
6.4% (104)New York:
0.9% (38,713)
Turkey West Islip:
5.2% (85)New York:
0.5% (21,009)
Poland West Islip:
5.1% (84)New York:
1.4% (65,102)
Peru West Islip:
5.0% (82)New York:
1.2% (54,759)
Russia West Islip:
4.1% (67)New York:
1.7% (75,802)
Japan West Islip:
3.7% (61)New York:
0.6% (28,472)
Colombia West Islip:
3.2% (53)New York:
2.5% (111,920)
Haiti West Islip:
3.1% (51)New York:
2.8% (126,936)
El Salvador West Islip:
3.0% (49)New York:
2.4% (108,067)
Argentina West Islip:
2.9% (47)New York:
0.5% (21,928)
Mexico West Islip:
2.3% (37)New York:
4.8% (214,559)
China, excluding Hong Kong and Taiwan West Islip:
2.3% (37)New York:
9.1% (410,910)
Pakistan West Islip:
1.9% (31)New York:
1.4% (62,442)
Korea West Islip:
1.8% (29)New York:
1.8% (82,786)
United Kingdom, excluding England and Scotland West Islip:
1.5% (25)New York:
0.8% (33,869)
Canada West Islip:
1.5% (25)New York:
1.3% (59,107)
Vietnam West Islip:
1.5% (25)New York:
0.6% (25,517)
Place of birth for U.S.-born residents:
This state: 23,469Other state: 1,546Northeast: 654Midwest: 244South: 398West: 246 94.1% of West Islip residents lived in the same house 1 years ago.
Out of people who lived in different houses, 34.8% lived in this county.
Out of people who lived in different counties, 91.3% lived in New York.
West Islip:
94.1%State average:
89.6%
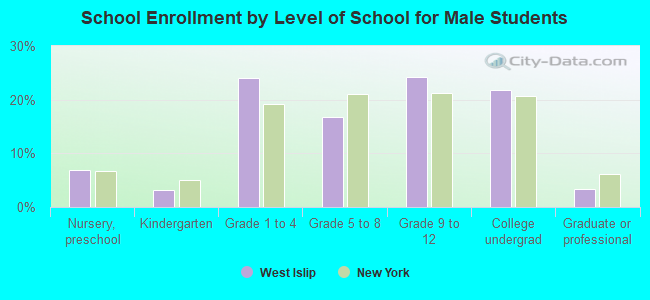
Education attainment for males 25 years and older:
No schooling: 62Nursery to 4th grade: 45th and 6th grade: 247th and 8th grade: 389th grade: 310th grade: 4011th grade: 012th grade, no diploma: 78High school graduate (or equivalency): 2,036Less than 1 year of college: 649Some college more than 1 year, no degree: 1,169Associate degree: 1,049Bachelor's degree: 2,588Master's degree: 1,711Professional school degree: 197Doctorate degree: 82
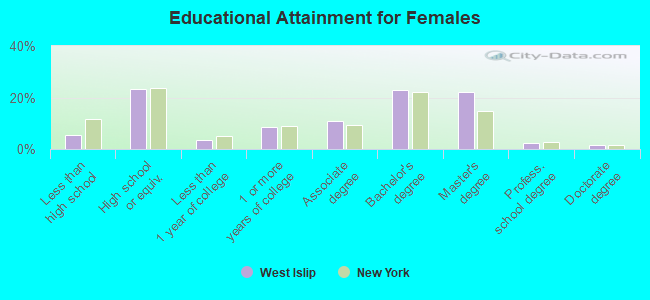
Education attainment for females 25 years and older:
No schooling: 145Nursery to 4th grade: 05th and 6th grade: 57th and 8th grade: 429th grade: 010th grade: 5011th grade: 7812th grade, no diploma: 169High school graduate (or equivalency): 2,138Less than 1 year of college: 337Some college more than 1 year, no degree: 786Associate degree: 992Bachelor's degree: 2,099Master's degree: 2,057Professional school degree: 201Doctorate degree: 125
Housing units in structures:
One, detached: 8,539One, attached: 160Two: 655 to 9: 810 to 19: 50Mobile homes: 6Housing units lacking complete plumbing facilities in 2022: 0.3%House/condo owner moved in on average 19 years ago
Renter moved in on average 8 years ago
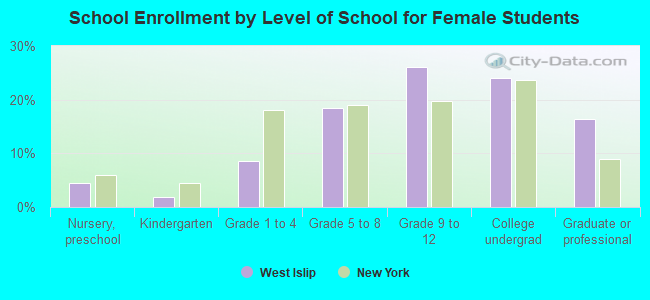
Private vs. public school enrollment:
Students in private schools in grades 1 to 8 (elementary and middle school): 127 Students in private schools in grades 9 to 12 (high school): 106 Students in private undergraduate colleges: 396