West Paterson, NJ (New Jersey) Houses and Residents
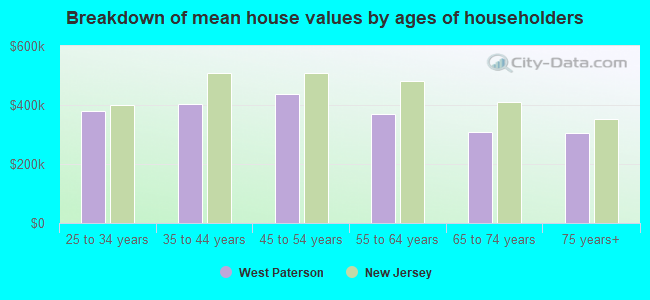
| West Paterson: | $479,397 |
| New Jersey: | $428,900 |
Total population: 10,903 (All urban)
Houses: 4,497 (4,397 occupied: 2,530 owner occupied, 1,867 renter occupied)
| % of renters here: | 42% |
| State: | 35% |
Housing density: 1,521 houses/condos per square mile
Median price asked for vacant for-sale houses and condos in 2022 in this county: $113,595.
Median contract rent in 2022: $1,574 (lower quartile is $1,364, upper quartile is $1,922)
Median rent asked for vacant for-rent units in 2022: $1,568
Median gross rent in West Paterson, NJ in 2022: $1,653
Housing units in West Paterson with a mortgage: 1,136 (79 second mortgage, 144 home equity loan, 0 both second mortgage and home equity loan)
Houses without a mortgage: 773
Compare current foreclosures near West Paterson, NJ:
| Photo | Address | Area | Beds / Baths | Price | Details |
|---|---|---|---|---|---|

|
#1
Forest Ave
Paramus, NJ 07652
|
2,428 sq. feet
|
3 baths 5 beds |
$749,900
|
show details |

|
#2
Jersey Ave
Fairview, NJ 07022
|
1,073 sq. feet
|
1 baths 3 beds |
$414,900
|
show details |

|
#3
Jersey Ave
Morristown, NJ 07960
|
2,406 sq. feet
|
2 baths 4 beds |
$665,000
|
show details |

|
#4
E 73rd St
New York, NY 10021
|
1,253 sq. feet
|
2 baths 2 beds |
$699,900
|
show details |

|
#5
7th St
Ridgefield Park, NJ 07660
|
1,382 sq. feet
|
1 baths 3 beds |
$539,900
|
show details |

|
#6
2nd Ave # 5c
New York, NY 10029
|
550 sq. feet
|
1 baths 1 beds |
$439,900
|
show details |

|
#7
N Broadway Apt A6
Yonkers, NY 10701
|
950 sq. feet
|
2 baths 2 beds |
$219,900
|
show details |

|
#8
S Orange Ave
Newark, NJ 07103
|
989 sq. feet
|
1 baths 2 beds |
$289,900
|
show details |

|
#9
Willow St
Bloomfield, NJ 07003
|
1,092 sq. feet
|
1 baths 3 beds |
$499,900
|
show details |

|
#10
Grand Concourse Apt 3c
Bronx, NY 10452
|
700 sq. feet
|
1 baths 1 beds |
$184,500
|
show details |
| Photo | Address | Area | Beds / Baths | Price | Details |
|---|---|---|---|---|---|

|
#11
Huntington Rd
Union, NJ 07083
|
1,532 sq. feet
|
2 baths 3 beds |
$539,900
|
show details |

|
#12
Bloomfield Ave
Caldwell, NJ 07006
|
1,216 sq. feet
|
2 baths 2 beds |
$400,000
|
show details |

|
#13
Martin Dr
Harrington Park, NJ 07640
|
1,746 sq. feet
|
3 baths 3 beds |
$950,000
|
show details |

|
#14
Ashland Ave
East Orange, NJ 07017
|
2,254 sq. feet
|
1 baths 5 beds |
$272,000
|
show details |

|
#15
Oakdale Mnr Apt A6d
Suffern, NY 10901
|
750 sq. feet
|
1 baths 1 beds |
$99,900
|
show details |

|
#16
Applegate Ave
Elizabeth, NJ 07202
|
808 sq. feet
|
1 baths 2 beds |
$355,000
|
show details |

|
#17
E 52nd St Apt 4f
New York, NY 10022
|
700 sq. feet
|
1 baths 1 beds |
$689,900
|
show details |

|
#18
E 81st St Apt 4c
New York, NY 10028
|
696 sq. feet
|
1 baths 1 beds |
$745,000
|
show details |

|
#19
Park Ave Apt 12
North Bergen, NJ 07047
|
835 sq. feet
|
1 baths 2 beds |
$379,900
|
show details |

|
#20
Fordham Hill Oval
Bronx, NY 10468
|
700 sq. feet
|
1 baths 1 beds |
$154,900
|
show details |
| Photo | Address | Area | Beds / Baths | Price | Details |
|---|---|---|---|---|---|

|
#21
E 36th St Apt 9f
New York, NY 10016
|
700 sq. feet
|
1 baths 1 beds |
$499,900
|
show details |

|
#22
Horizon Rd Apt 803
Fort Lee, NJ 07024
|
843 sq. feet
|
1 baths 1 beds |
$178,900
|
show details |

|
#23
Park Ave # 3w4c
New York, NY 10028
|
- sq. feet
|
4 baths 4 beds |
$8,499,900
|
show details |

|
#24
5th St
Fair Lawn, NJ 07410
|
- sq. feet
|
3 baths 3 beds |
$431,600
|
show details |

|
#25
W 110th St Apt 9-10
New York, NY 10025
|
- sq. feet
|
2 baths 2 beds |
$627,000
|
show details |

|
#26
N 19th St
East Orange, NJ 07017
|
- sq. feet
|
3 baths 6 beds |
$399,900
|
show details |

|
#27
W End Ave Apt 10d
New York, NY 10023
|
- sq. feet
|
1 baths 1 beds |
$429,900
|
show details |

|
#28
Blvd E, Apt 34b, Bldg 3
West New York, NJ 07093
|
- sq. feet
|
2 baths 2 beds |
$429,900
|
show details |

|
#29
E 56th St # 1700
New York, NY 10022
|
1,986 sq. feet
|
- baths 2 beds |
$995,000
|
show details |

|
#30
Glannon Rd
Livingston, NJ 07039
|
- sq. feet
|
1 baths 3 beds |
$535,600
|
show details |
| Photo | Address | Area | Beds / Baths | Price | Details |
|---|---|---|---|---|---|

|
#31
Arlington Ave Apt 11n
Bronx, NY 10471
|
500 sq. feet
|
- baths 1 beds |
$182,500
|
show details |

|
#32
Grand Ave
North Bergen, NJ 07047
|
1,180 sq. feet
|
2 baths 1 beds |
show details | |

|
#33
Lafayette Ave
Hawthorne, NJ 07506
|
1,676 sq. feet
|
1 baths 3 beds |
show details | |

|
#34
Highland Ave
Passaic, NJ 07055
|
2,018 sq. feet
|
2 baths 4 beds |
show details | |

|
#35
Lenox Ave
Paterson, NJ 07502
|
1,028 sq. feet
|
2 baths 3 beds |
show details | |

|
#36
Hille Pl
Ridgefield Park, NJ 07660
|
1,683 sq. feet
|
1 baths 1 beds |
show details | |

|
#37
Alder Ave
Wayne, NJ 07470
|
3,093 sq. feet
|
2 baths 4 beds |
show details | |

|
#38
Acme St
Elizabeth, NJ 07202
|
2,250 sq. feet
|
2 baths 6 beds |
show details | |

|
#39
293 Morris Ave
Newark, NJ 07103
|
3,386 sq. feet
|
6 baths 9 beds |
show details | |

|
#40
Coger St
Saddle Brook, NJ 07663
|
1,470 sq. feet
|
2 baths 5 beds |
show details |
| Photo | Address | Area | Beds / Baths | Price | Details |
|---|---|---|---|---|---|

|
#41
Union Ave
Garfield, NJ 07026
|
1,148 sq. feet
|
2 baths 4 beds |
show details | |

|
#42
Crestwood Ave
Nutley, NJ 07110
|
1,032 sq. feet
|
1 baths 3 beds |
show details | |

|
#43
Pomona Ave
Newark, NJ 07112
|
1,604 sq. feet
|
1 baths 4 beds |
show details | |

|
#44
Mohawk Trl
Wayne, NJ 07470
|
1,920 sq. feet
|
2 baths 3 beds |
show details | |

|
#45
New St
East Orange, NJ 07017
|
2,212 sq. feet
|
2 baths 5 beds |
show details | |

|
#46
Maple St
Bloomfield, NJ 07003
|
2,160 sq. feet
|
2 baths 4 beds |
show details | |

|
#47
Harmon Cove Tower # 3
Secaucus, NJ 07094
|
3,210 sq. feet
|
4 baths 4 beds |
show details | |

|
#48
46th St
North Bergen, NJ 07047
|
2,160 sq. feet
|
3 baths 6 beds |
show details | |

|
#49
E End Ave Apt Ph2
New York, NY 10028
|
3,008 sq. feet
|
3 baths 3 beds |
show details | |

|
Check over 1 million property listings on Foreclosure.com!
|
browse all offers | |||

 | Apartment complex or private home apartments? (7 replies) |
| Good schools+ affordable housing near Paterson? (17 replies) |
| Place in NJ with affordable rental apartments (15 replies) |
| Bruce Springsteen busted for DWI at Jersey Shore, official says (278 replies) |
| Desperately Seeking Lobster Rolls (113 replies) |
| HOLLOW RUN APARTMENTS, Fair Lawn, NJ (12 replies) |
Household type by relationship:
Households: 490,207- In family households: 433,190 (75,969 male householders, 44,871 female householders)
81,287 spouses, 163,062 children (155,233 natural, 2,777 adopted, 5,052 stepchildren), 12,822 grandchildren, 9,893 brothers or sisters, 9,550 parents, foster children, 13,805 other relatives, 16,122 non-relatives
- In nonfamily households: 57,017 (20,561 male householders (15,848 living alone)), 25,384 female householders (21,858 living alone)), 11,072 nonrelatives
- In group quarters: 11,019 (3,291 institutionalized population)
79,516 married couples with children.
30,640 single-parent households (6,238 men, 24,402 women).
69.6% of residents of West Paterson speak English at home.
8.6% of residents speak Spanish at home (61% speak English very well, 25% speak English well, 12% speak English not well, 1% don't speak English at all).
17.9% of residents speak other Indo-European language at home (64% speak English very well, 20% speak English well, 16% speak English not well, 1% don't speak English at all).
2.0% of residents speak Asian or Pacific Island language at home (43% speak English very well, 36% speak English well, 21% speak English not well).
1.9% of residents speak other language at home (56% speak English very well, 35% speak English well, 9% speak English not well).
Foreign born population: 2,890 (25.0%)
(81.7% of them are naturalized citizens)
| Here: | 6.5 |
| State: | 6.8 |
| Here: | 4.1 |
| State: | 3.9 |
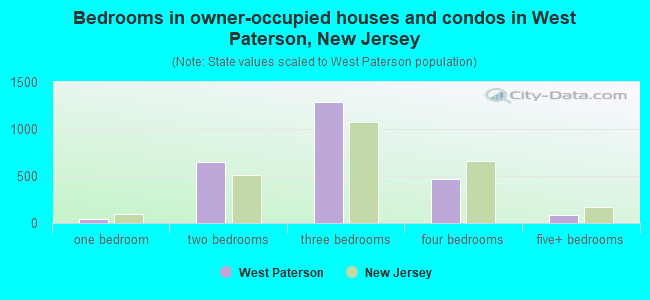
- Bedrooms in owner-occupied houses and condos in West Paterson, New Jersey
- 0no bedroom
- 461 bedroom
- 6502 bedrooms
- 1,2903 bedrooms
- 4644 bedrooms
- 805+ bedrooms
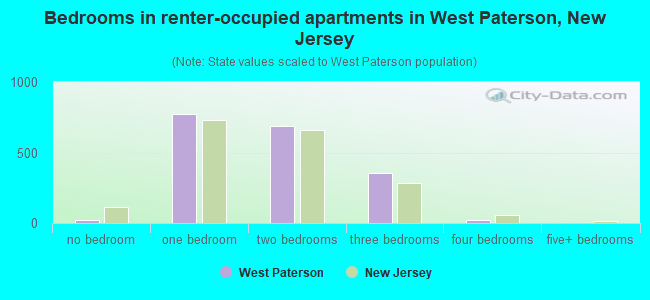
- Bedrooms in renter-occupied apartments in West Paterson, New Jersey
- 24no bedroom
- 7751 bedroom
- 6862 bedrooms
- 3583 bedrooms
- 244 bedrooms
- 05+ bedrooms
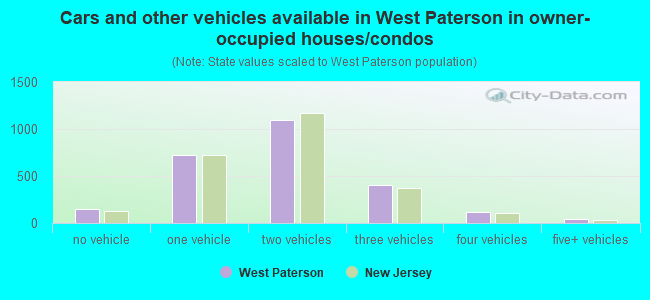
- Cars and other vehicles available in West Paterson in owner-occupied houses/condos
- 144no vehicle
- 7271 vehicle
- 1,1002 vehicles
- 4023 vehicles
- 1194 vehicles
- 385+ vehicles
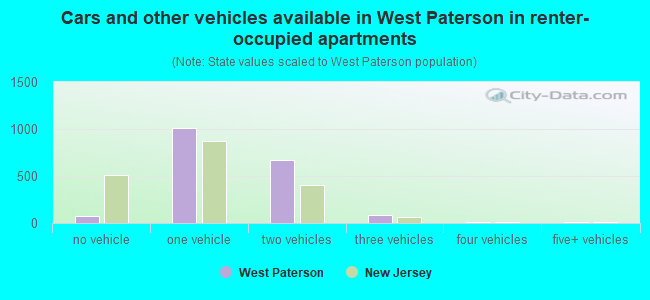
- Cars and other vehicles available in West Paterson in renter-occupied apartments
- 78no vehicle
- 1,0131 vehicle
- 6742 vehicles
- 813 vehicles
- 104 vehicles
- 115+ vehicles
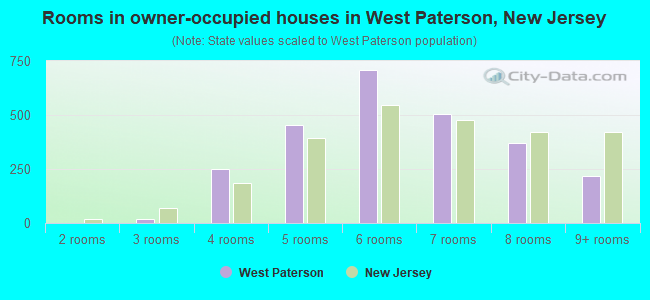
- Rooms in owner-occupied houses in West Paterson, New Jersey
- 01 room
- 02 rooms
- 203 rooms
- 2524 rooms
- 4535 rooms
- 7106 rooms
- 5047 rooms
- 3728 rooms
- 2199+ rooms
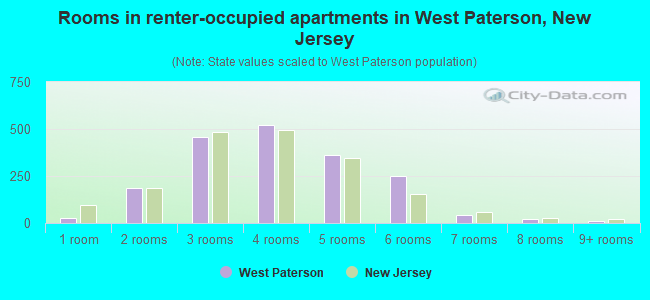
- Rooms in renter-occupied apartments in West Paterson, New Jersey
- 241 room
- 1842 rooms
- 4553 rooms
- 5234 rooms
- 3645 rooms
- 2496 rooms
- 407 rooms
- 198 rooms
- 99+ rooms
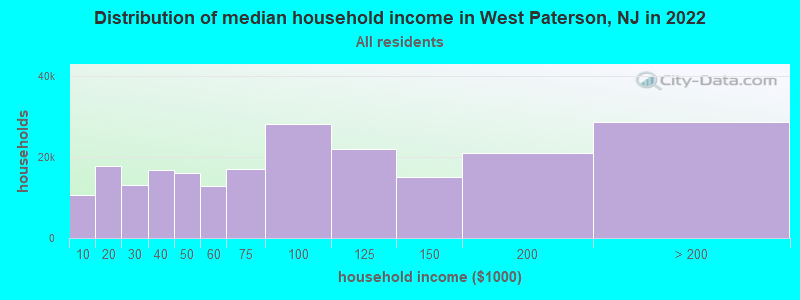
West Paterson, NJ household income distribution

- 10,739Less than $10,000
- 17,753$10,000 to $19,999
- 13,133$20,000 to $29,999
- 16,938$30,000 to $39,999
- 16,148$40,000 to $49,999
- 12,764$50,000 to $59,999
- 16,960$60,000 to $74,999
- 28,266$75,000 to $99,999
- 22,114$100,000 to $124,999
- 15,102$125,000 to $149,999
- 20,968$150,000 to $199,999
- 28,716$200,000 or more
Percentage of workers working in this county: 51.9%
Number of people working at home: 767 (11.3% of all workers)
Travel time to work (commute)
- Less than 5 minutes: 260
- 5 to 9 minutes: 535
- 10 to 14 minutes: 905
- 15 to 19 minutes: 925
- 20 to 24 minutes: 877
- 25 to 29 minutes: 375
- 30 to 34 minutes: 761
- 35 to 39 minutes: 123
- 40 to 44 minutes: 141
- 45 to 59 minutes: 338
- 60 to 89 minutes: 237
- 90 or more minutes: 89
Means of transportation to work:
- Drove a car alone: 4,885 (85.0%)
- Carpooled: 422 (7.3%)
- Bus or trolley bus: 130 (2.3%)
- Railroad: 17 (0.3%)
- Taxi: 6 (0.1%)
- Walked: 46 (0.8%)
- Other means: 60 (1.0%)
- Worked at home: 180 (3.1%)
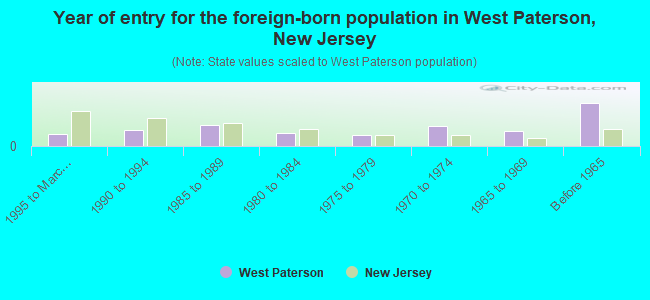
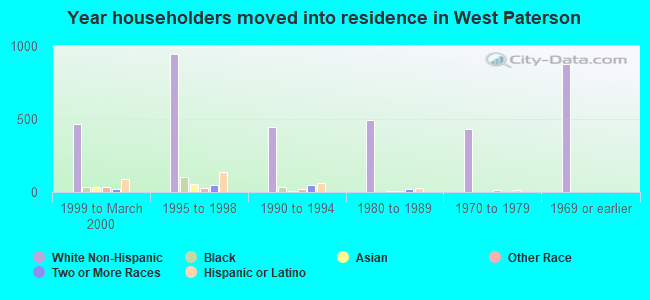
- Year of entry for the foreign-born population in West Paterson, New Jersey
- 1821995 to March 2000
- 2471990 to 1994
- 3281985 to 1989
- 2001980 to 1984
- 1721975 to 1979
- 3051970 to 1974
- 2241965 to 1969
- 654Before 1965
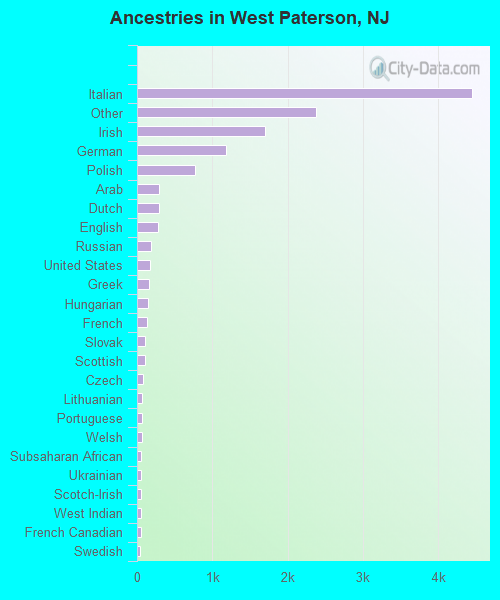
First ancestries reported:
- Italian: 4,452 (34.3%)
- Other: 2,372 (18.3%)
- Irish: 1,695 (13.1%)
- German: 1,183 (9.1%)
- Polish: 767 (5.9%)
- Arab: 298 (2.3%)
- Dutch: 292 (2.3%)
- English: 279 (2.2%)
- Russian: 185 (1.4%)
- United States: 167 (1.3%)
- Greek: 153 (1.2%)
- Hungarian: 144 (1.1%)
- French: 139 (1.1%)
- Slovak: 106 (0.8%)
- Scottish: 105 (0.8%)
- Czech: 80 (0.6%)
- Lithuanian: 70 (0.5%)
- Portuguese: 69 (0.5%)
- Welsh: 61 (0.5%)
- Subsaharan African: 58 (0.4%)
- Ukrainian: 58 (0.4%)
- Scotch-Irish: 54 (0.4%)
- West Indian: 54 (0.4%)
- French Canadian: 47 (0.4%)
- Swedish: 46 (0.4%)
- Swiss: 42 (0.3%)
Most common places of birth for foreign-born residents (%):
| West Paterson: | 32.4% (748) |
| New Jersey: | 4.0% (58,395) |
| West Paterson: | 4.8% (111) |
| New Jersey: | 4.7% (69,754) |
| West Paterson: | 4.4% (101) |
| New Jersey: | 3.1% (45,151) |
| West Paterson: | 4.3% (100) |
| New Jersey: | 6.2% (91,316) |
| West Paterson: | 3.4% (78) |
| New Jersey: | 1.1% (16,052) |
| West Paterson: | 3.2% (74) |
| New Jersey: | 0.4% (5,220) |
| West Paterson: | 2.9% (67) |
| New Jersey: | 3.8% (55,466) |
| West Paterson: | 2.8% (64) |
| New Jersey: | 0.3% (4,774) |
| West Paterson: | 2.8% (64) |
| New Jersey: | 1.2% (17,647) |
| West Paterson: | 2.7% (63) |
| New Jersey: | 2.3% (33,531) |
| West Paterson: | 2.7% (62) |
| New Jersey: | 2.7% (40,092) |
| West Paterson: | 2.6% (59) |
| New Jersey: | 0.3% (4,530) |
| West Paterson: | 2.1% (49) |
| New Jersey: | 4.7% (69,773) |
| West Paterson: | 2.0% (47) |
| New Jersey: | 3.5% (51,970) |
| West Paterson: | 2.0% (46) |
| New Jersey: | 0.7% (9,606) |
| West Paterson: | 1.9% (45) |
| New Jersey: | 0.8% (12,082) |
| West Paterson: | 1.8% (41) |
| New Jersey: | 0.4% (5,277) |
| West Paterson: | 1.8% (41) |
| New Jersey: | 0.8% (12,383) |
Place of birth for U.S.-born residents:
- This state: 6,838
- Other state: 1,726
- Northeast: 1,352
- Midwest: 134
- South: 217
- West: 23
65% of West Paterson residents lived in the same house 5 years ago.
Out of people who lived in different houses, 58% lived in this county.
Out of people who lived in different counties, 66% lived in New Jersey.
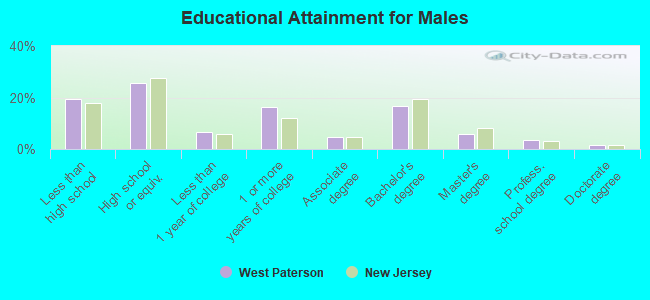
Education attainment for males 25 years and older:
- No schooling: 67
- Nursery to 4th grade: 41
- 5th and 6th grade: 88
- 7th and 8th grade: 174
- 9th grade: 28
- 10th grade: 119
- 11th grade: 95
- 12th grade, no diploma: 111
- High school graduate (or equivalency): 953
- Less than 1 year of college: 248
- Some college more than 1 year, no degree: 615
- Associate degree: 169
- Bachelor's degree: 631
- Master's degree: 217
- Professional school degree: 132
- Doctorate degree: 52
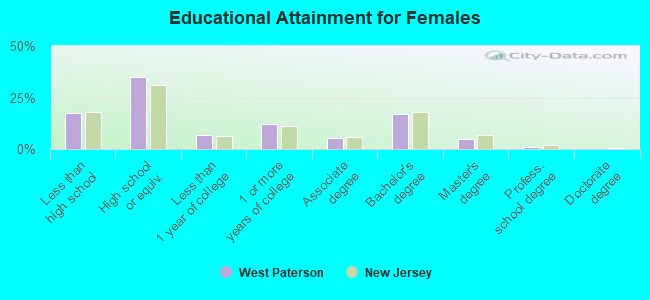
Education attainment for females 25 years and older:
- No schooling: 45
- Nursery to 4th grade: 49
- 5th and 6th grade: 102
- 7th and 8th grade: 176
- 9th grade: 86
- 10th grade: 103
- 11th grade: 57
- 12th grade, no diploma: 118
- High school graduate (or equivalency): 1,498
- Less than 1 year of college: 298
- Some college more than 1 year, no degree: 517
- Associate degree: 226
- Bachelor's degree: 730
- Master's degree: 209
- Professional school degree: 39
- Doctorate degree: 8
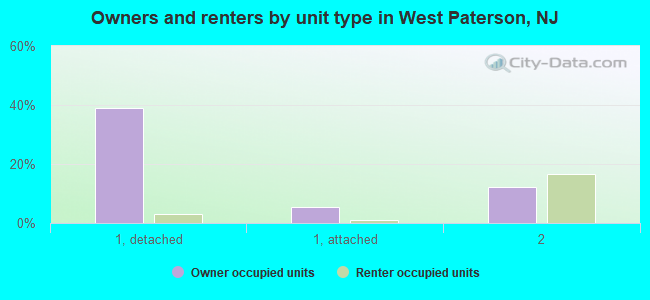
Housing units in structures:
- One, detached: 1,854
- One, attached: 301
- Two: 1,315
- 3 or 4: 212
- 5 to 9: 589
- 10 to 19: 105
- 50 or more: 113
- Mobile homes: 8
Housing units lacking complete kitchen facilities: 0.1%
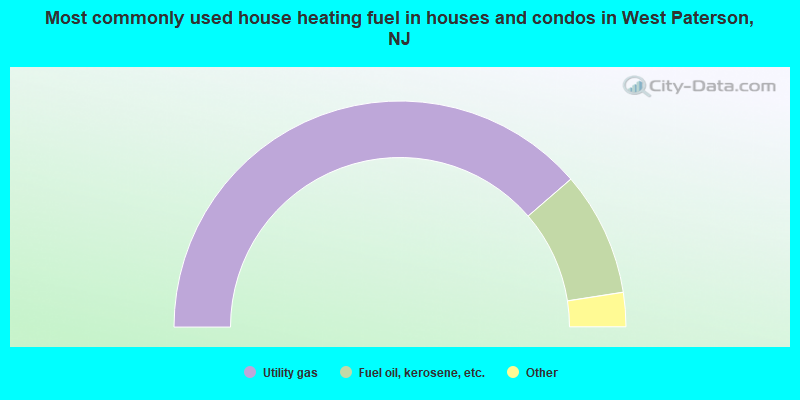
- 77.3%Utility gas
- 17.8%Fuel oil, kerosene, etc.
- 3.5%Electricity
- 1.1%Bottled, tank, or LP gas
- 0.4%Other fuel
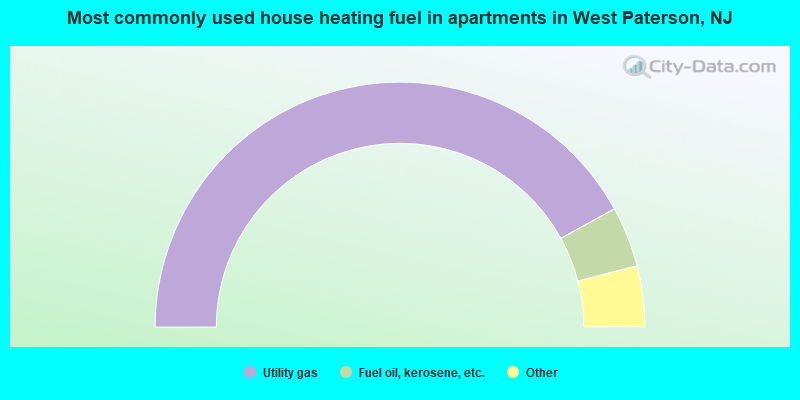
- 83.9%Utility gas
- 8.0%Fuel oil, kerosene, etc.
- 3.7%Electricity
- 1.6%Bottled, tank, or LP gas
- 1.4%Other fuel
- 1.3%No fuel used
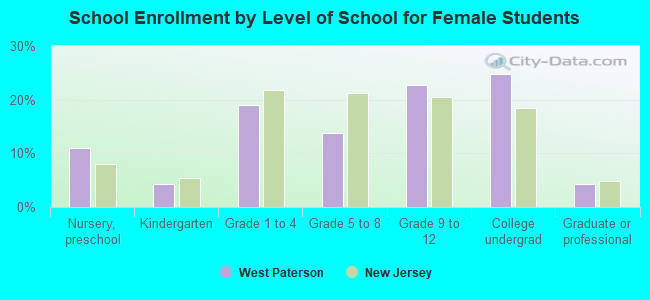
Private vs. public school enrollment:
| Here: | 11.8% |
| New Jersey: | 13.2% |
| Here: | 2.1% |
| New Jersey: | 13.0% |
| Here: | 25.9% |
| New Jersey: | 30.1% |