West St. Paul, MN (Minnesota) Houses and Residents
Estimated median house or condo value in 2022: $288,220 (it was $122,900 in 2000 )
West St. Paul:
$288,220Minnesota:
$314,600
Lower value quartile - upper value quartile: $226,386 - $377,270Mean price in 2022: Detached houses: $324,910 Here:
$324,910State:
$374,552
Townhouses or other attached units: $233,882 Here:
$233,882State:
$312,049
In 2-unit structures: $526,612 Here:
$526,612State:
$323,045
In 3-to-4-unit structures: $168,392 Here:
$168,392State:
$238,971
In 5-or-more-unit structures: $204,403 Here:
$204,403State:
$258,516
Total population: 19,806 (Urban population: 19,405, Rural population: 0)
Houses: 10,036 (9,578 occupied: 5,906 owner occupied, 3,710 renter occupied )
% of renters here:
39%State:
28%
Housing density: 2,004 houses/condos per square mile
Median price asked for vacant for-sale houses and condos in 2022: $201,615.
Median contract rent in 2022: $1,146 (lower quartile is $908, upper quartile is $1,404)
Median rent asked for vacant for-rent units in 2022: $1,221
Median gross rent in West St. Paul, MN in 2022: $1,244
Housing units in West St. Paul with a mortgage: 4,141 (436 second mortgage, 0 home equity loan, 377 both second mortgage and home equity loan )Houses without a mortgage: 94
Median household income for houses/condos with a mortgage: $99,218
Median household income for apartments without a mortgage: $72,083
Median monthly housing costs: $1,313
Data:
Median house or condo value ($)
Median house or condo value ($ change since 2000)
Median house or condo value ($) - White
Median house or condo value ($) - Black or African American
Median house or condo value ($) - Asian
Median house or condo value ($) - Hispanic or Latino
Median house or condo value ($) - American Indian and Alaska Native
Median house or condo value ($) - Multirace
Median house or condo value ($) - Other Race
Median price asked for mobile homes ($)
Household density (households per square mile)
Mean house or condo value by units in structure - 1, detached ($)
Mean house or condo value by units in structure - 1, attached ($)
Mean house or condo value by units in structure - 2 ($)
Mean house or condo value by units in structure by units in structure - 3 or 4 ($)
Mean house or condo value by units in structure - 5 or more ($)
Mean house or condo value by units in structure - Boat, RV, van, etc. ($)
Mean house or condo value by units in structure - Mobile home ($)
Median contract rent ($)
Median contract rent - Lower quartile ($)
Median contract rent - Upper quartile ($)
Median gross rent ($)
Urban houses (%)
Rural houses (%)
Houses occupied (%)
Houses occupied (% change since 2000)
Houses owner occupied (%)
Houses owner occupied (% change since 2000)
Houses renter occupied (%)
Houses renter occupied (% change since 2000)
Vacant housing units - For rent (%)
Vacant housing units - For rent (% change since 2000)
Vacant housing units - For sale only (%)
Vacant housing units - For sale only (% change since 2000)
Vacant housing units - Rented or sold, not occupied (%)
Vacant housing units - Rented or sold, not occupied (% change since 2000)
Vacant housing units - For seasonal, recreational, or occasional use (%)
Vacant housing units - For seasonal, recreational, or occasional use (% change since 2000)
Vacant housing units - For migrant workers (%)
Vacant housing units - For migrant workers (% change since 2000)
Vacant housing units - Other vacant (%)
Vacant housing units - Other vacant (% change since 2000)
Median monthly housing costs ($)
Median household income for houses/condos with a mortgage ($)
Median household income for houses/condos without a mortgage ($)
Median household income ($)
Median household income ($) - White
Median household income ($) - Black or African American
Median household income ($) - Asian
Median household income ($) - Hispanic or Latino
Median household income ($) - American Indian and Alaska Native
Median household income ($) - Multirace
Median household income ($) - Other Race
Mortgage status - with mortgage (%)
Mortgage status - with second mortgage (%)
Mortgage status - with home equity loan (%)
Mortgage status - with both second mortgage and home equity loan (%)
Mortgage status - without a mortgage (%)
Median year house/condo built
Median year apartment built
Household type by relationship - Male householder living alone (%)
Household type by relationship - Male householder not living alone (%)
Household type by relationship - Female householder living alone (%)
Household type by relationship - Female householder not living alone (%)
Household type by relationship - Opposite-Sex spouse (%)
Household type by relationship - Same-Sex spouse (%)
Household type by relationship - Opposite-Sex unmarried partner (%)
Household type by relationship - Same-Sex unmarried partner (%)
Household type by relationship - In group quarters (%)
Size of family households - 2-person household (%)
Size of family households - 3-person household (%)
Size of family households - 4-person household (%)
Size of family households - 5-person household (%)
Size of family households - 6-person household (%)
Size of family households - 7-or-more-person household (%)
Size of nonfamily households - 1-person household (%)
Size of nonfamily households - 2-person household (%)
Size of nonfamily households - 3-person household (%)
Size of nonfamily households - 4-person household (%)
Size of nonfamily households - 5-person household (%)
Size of nonfamily households - 6-person household (%)
Size of nonfamily households - 7-or-moreperson household (%)
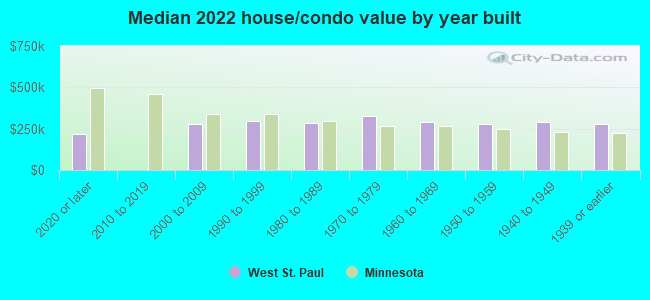
Year house built - Built 2010 or later (%)
Year house built - Built 2000 to 2009 (%)
Year house built - Built 1990 to 1999 (%)
Year house built - Built 1980 to 1989 (%)
Year house built - Built 1970 to 1979 (%)
Year house built - Built 1960 to 1969 (%)
Year house built - Built 1950 to 1959 (%)
Year house built - Built 1940 to 1949 (%)
Year house built - Built 1939 or earlier (%)
Median number of rooms in houses and condos
Median number of rooms in apartments
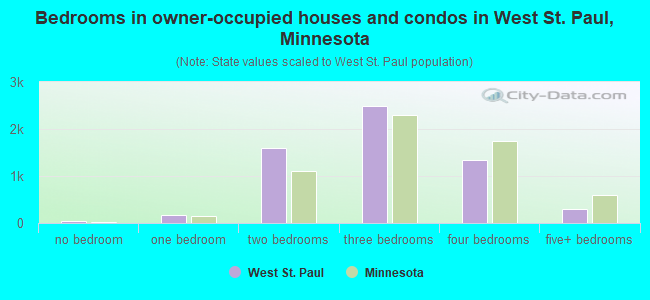
Median number of bedrooms in owner occupied houses
Mean number of bedrooms in owner occupied houses
Median number of bedrooms in renter occupied houses
Mean number of bedrooms in renter occupied houses
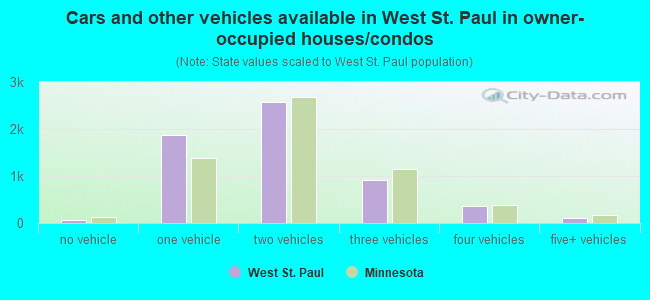
Median number of vehichles in owner occupied houses
Mean number of vehichles in owner occupied houses
Median number of vehichles in renter occupied houses
Mean number of vehichles in renter occupied houses
Rooms in owner-occupied houses - 1 room (%)
Rooms in owner-occupied houses - 2 rooms (%)
Rooms in owner-occupied houses - 3 rooms (%)
Rooms in owner-occupied houses - 4 rooms (%)
Rooms in owner-occupied houses - 5 rooms (%)
Rooms in owner-occupied houses - 6 rooms (%)
Rooms in owner-occupied houses - 7 rooms (%)
Rooms in owner-occupied houses - 8 rooms (%)
Rooms in owner-occupied houses - 9+ rooms (%)
Rooms in renter-occupied houses - 1 room (%)
Rooms in renter-occupied houses - 2 rooms (%)
Rooms in renter-occupied houses - 3 rooms (%)
Rooms in renter-occupied houses - 4 rooms (%)
Rooms in renter-occupied houses - 5 rooms (%)
Rooms in renter-occupied houses - 6 rooms (%)
Rooms in renter-occupied houses - 7 rooms (%)
Rooms in renter-occupied houses - 8 rooms (%)
Rooms in renter-occupied houses - 9+ rooms (%)
Bedrooms in owner-occupied houses - no bedrooms (%)
Bedrooms in owner-occupied houses - 1 bedroom (%)
Bedrooms in owner-occupied houses - 2 bedrooms (%)
Bedrooms in owner-occupied houses - 3 bedrooms (%)
Bedrooms in owner-occupied houses - 4 bedrooms (%)
Bedrooms in owner-occupied houses - 5+ bedrooms (%)
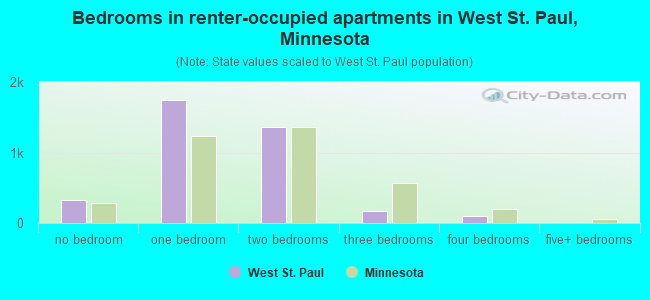
Bedrooms in renter-occupied houses - no bedrooms (%)
Bedrooms in renter-occupied houses - 1 bedroom (%)
Bedrooms in renter-occupied houses - 2 bedrooms (%)
Bedrooms in renter-occupied houses - 3 bedrooms (%)
Bedrooms in renter-occupied houses - 4 bedrooms (%)
Bedrooms in renter-occupied houses - 5+ bedrooms (%)
Vehicles available in owner-occupied houses - no vehicle available (%)
Vehicles available in owner-occupied houses - 1 vehicle available(%)
Vehicles available in owner-occupied houses - 2 Vehicles available (%)
Vehicles available in owner-occupied houses - 3 Vehicles available (%)
Vehicles available in owner-occupied houses - 4 Vehicles available (%)
Vehicles available in owner-occupied houses - 5+ Vehicles available (%)
Vehicles available in renter-occupied houses - no vehicle available (%)
Vehicles available in renter-occupied houses - 1 vehicle available (%)
Vehicles available in renter-occupied houses - 2 Vehicles available (%)
Vehicles available in renter-occupied houses - 3 Vehicles available (%)
Vehicles available in renter-occupied houses - 4 Vehicles available (%)
Vehicles available in renter-occupied houses - 5+ Vehicles available (%)
Housing units in structures - 1, detached (%)
Housing units in structures - 1, attached (%)
Housing units in structures - 2 (%)
Housing units in structures - 3 or 4 (%)
Housing units in structures - 5 to 9 (%)
Housing units in structures - 10 to 19 (%)
Housing units in structures - 20 to 49 (%)
Housing units in structures - 50 or more (%)
Housing units in structures - Mobile home (%)
Housing units in structures - Boat, RV, van, etc. (%)
Housing units in structures - Owners - 1, detached (%)
Housing units in structures - Owners - 1, attached (%)
Housing units in structures - Owners - 2 (%)
Housing units in structures - Owners - 3 or 4 (%)
Housing units in structures - Owners - 5 to 9 (%)
Housing units in structures - Owners - 10 to 19 (%)
Housing units in structures - Owners - 20 to 49 (%)
Housing units in structures - Owners - 50 or more (%)
Housing units in structures - Owners - Mobile home (%)
Housing units in structures - Owners - Boat, RV, van, etc. (%)
Housing units in structures - Renters - 1, detached (%)
Housing units in structures - Renters - 1, attached (%)
Housing units in structures - Renters - 2 (%)
Housing units in structures - Renters - 3 or 4 (%)
Housing units in structures - Renters - 5 to 9 (%)
Housing units in structures - Renters - 10 to 19 (%)
Housing units in structures - Renters - 20 to 49 (%)
Housing units in structures - Renters - 50 or more (%)
Housing units in structures - Renters - Mobile home (%)
Housing units in structures - Renters - Boat, RV, van, etc. (%)
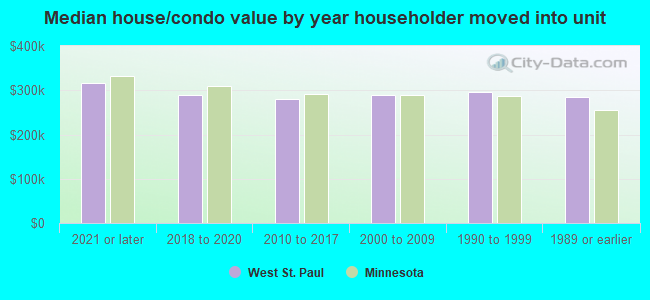
House/condo owner moved in on average (years ago)
Renter moved in on average (years ago)
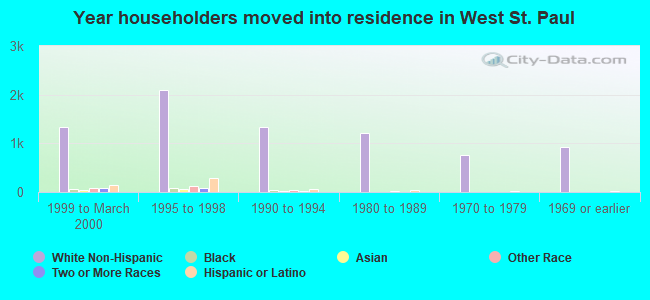
Year householder moved into unit - Moved in 1999 to March 2000 (%)
Year householder moved into unit - Moved in 1999 to March 2000 (%) - White
Year householder moved into unit - Moved in 1999 to March 2000 (%) - Black or African American
Year householder moved into unit - Moved in 1999 to March 2000 (%) - Asian
Year householder moved into unit - Moved in 1999 to March 2000 (%) - Hispanic or Latino
Year householder moved into unit - Moved in 1999 to March 2000 (%) - American Indian and Alaska Native
Year householder moved into unit - Moved in 1999 to March 2000 (%) - Multirace
Year householder moved into unit - Moved in 1999 to March 2000 (%) - Other Race
Year householder moved into unit - Moved in 1995 to 1998 (%)
Year householder moved into unit - Moved in 1995 to 1998 (%) - White
Year householder moved into unit - Moved in 1995 to 1998 (%) - Black or African American
Year householder moved into unit - Moved in 1995 to 1998 (%) - Asian
Year householder moved into unit - Moved in 1995 to 1998 (%) - Hispanic or Latino
Year householder moved into unit - Moved in 1995 to 1998 (%) - American Indian and Alaska Native
Year householder moved into unit - Moved in 1995 to 1998 (%) - Multirace
Year householder moved into unit - Moved in 1995 to 1998 (%) - Other Race
Year householder moved into unit - Moved in 1990 to 1994 (%)
Year householder moved into unit - Moved in 1990 to 1994 (%) - White
Year householder moved into unit - Moved in 1990 to 1994 (%) - Black or African American
Year householder moved into unit - Moved in 1990 to 1994 (%) - Asian
Year householder moved into unit - Moved in 1990 to 1994 (%) - Hispanic or Latino
Year householder moved into unit - Moved in 1990 to 1994 (%) - American Indian and Alaska Native
Year householder moved into unit - Moved in 1990 to 1994 (%) - Multirace
Year householder moved into unit - Moved in 1990 to 1994 (%) - Other Race
Year householder moved into unit - Moved in 1980 to 1989 (%)
Year householder moved into unit - Moved in 1980 to 1989 (%) - White
Year householder moved into unit - Moved in 1980 to 1989 (%) - Black or African American
Year householder moved into unit - Moved in 1980 to 1989 (%) - Asian
Year householder moved into unit - Moved in 1980 to 1989 (%) - Hispanic or Latino
Year householder moved into unit - Moved in 1980 to 1989 (%) - American Indian and Alaska Native
Year householder moved into unit - Moved in 1980 to 1989 (%) - Multirace
Year householder moved into unit - Moved in 1980 to 1989 (%) - Other Race
Year householder moved into unit - Moved in 1970 to 1979 (%)
Year householder moved into unit - Moved in 1970 to 1979 (%) - White
Year householder moved into unit - Moved in 1970 to 1979 (%) - Black or African American
Year householder moved into unit - Moved in 1970 to 1979 (%) - Asian
Year householder moved into unit - Moved in 1970 to 1979 (%) - Hispanic or Latino
Year householder moved into unit - Moved in 1970 to 1979 (%) - American Indian and Alaska Native
Year householder moved into unit - Moved in 1970 to 1979 (%) - Multirace
Year householder moved into unit - Moved in 1970 to 1979 (%) - Other Race
Year householder moved into unit - Moved in 1969 or earlier (%)
Year householder moved into unit - Moved in 1969 or earlier (%) - White
Year householder moved into unit - Moved in 1969 or earlier (%) - Black or African American
Year householder moved into unit - Moved in 1969 or earlier (%) - Asian
Year householder moved into unit - Moved in 1969 or earlier (%) - Hispanic or Latino
Year householder moved into unit - Moved in 1969 or earlier (%) - American Indian and Alaska Native
Year householder moved into unit - Moved in 1969 or earlier (%) - Multirace
Year householder moved into unit - Moved in 1969 or earlier (%) - Other Race
Housing units lacking complete plumbing facilities (%)
Housing units lacking complete kitchen facilities (%)
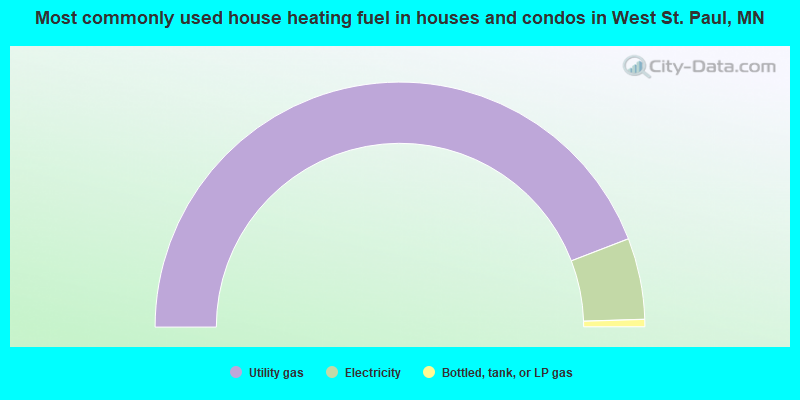
House heating fuel used in houses and condos - Utility gas (%)
House heating fuel used in houses and condos - Bottled, tank, or LP gas (%)
House heating fuel used in houses and condos - Electricity (%)
House heating fuel used in houses and condos - Fuel oil, kerosene, etc. (%)
House heating fuel used in houses and condos - Coal or coke (%)
House heating fuel used in houses and condos - Wood (%)
House heating fuel used in houses and condos - Solar energy (%)
House heating fuel used in houses and condos - Other fuel (%)
House heating fuel used in houses and condos - No fuel used (%)
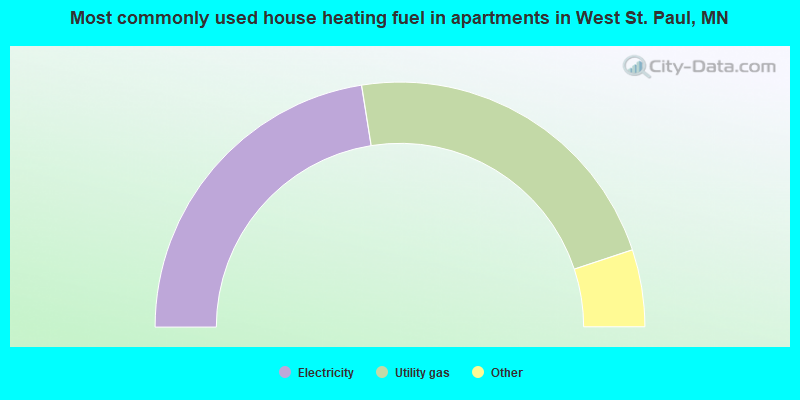
House heating fuel used in apartments - Utility gas (%)
House heating fuel used in apartments - Bottled, tank, or LP gas (%)
House heating fuel used in apartments - Electricity (%)
House heating fuel used in apartments - Fuel oil, kerosene, etc. (%)
House heating fuel used in apartments - Coal or coke (%)
House heating fuel used in apartments - Wood (%)
House heating fuel used in apartments - Solar energy (%)
House heating fuel used in apartments - Other fuel (%)
House heating fuel used in apartments - No fuel used (%)
Median year house/condo built: 1960Median year apartment built: 1978Household type by relationship:
Households: 21,017
Male householders: 4,135 (1,222 living alone ), Female householders: 5,254 (2,505 living alone )3,308 spouses (3,255 opposite-sex spouses ), 617 unmarried partners , (561 opposite-sex unmarried partners ), 5,230 children (4,942 natural , 128 adopted , 159 stepchildren ), 521 grandchildren , 316 brothers or sisters , 214 parents , 7 foster children , 413 other relatives , 637 non-relatives In group quarters: 359
Size of family households: 2,201 2-persons , 1,223 3-persons , 1,079 4-persons , 237 5-persons , 118 6-persons , 149 7-or-more-persons .
Size of nonfamily households: 3,745 1-person , 777 2-persons , 90 3-persons , 21 4-persons .
2,792 married couples with children. single-parent households (311 men , 314 women ).
85.2% of residents of West St. Paul speak English at home. of residents speak Spanish at home (44% speak English very well , 17% speak English well , 28% speak English not well , 10% don't speak English at all ).of residents speak other Indo-European language at home (100% speak English very well ).of residents speak Asian or Pacific Island language at home (63% speak English very well , 31% speak English well , 4% speak English not well , 2% don't speak English at all ).of residents speak other language at home (89% speak English very well , 2% speak English well , 9% speak English not well ).
Foreign born population: 1,891 (9.0%)of them are naturalized citizens )
Median number of rooms in houses and condos:
Median number of rooms in apartments
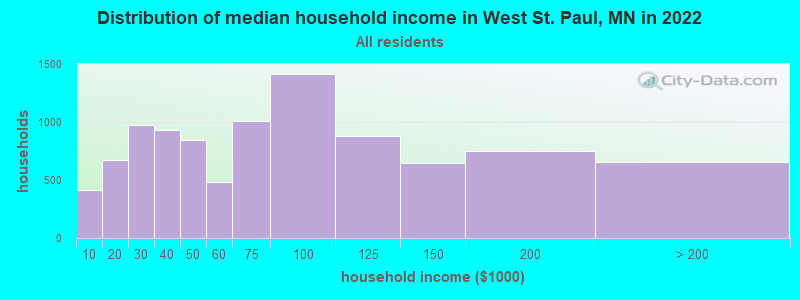
West St. Paul, MN household income distribution 416 Less than $10,000671 $10,000 to $19,999973 $20,000 to $29,999934 $30,000 to $39,999844 $40,000 to $49,999481 $50,000 to $59,9991,007 $60,000 to $74,9991,412 $75,000 to $99,999877 $100,000 to $124,999647 $125,000 to $149,999747 $150,000 to $199,999657 $200,000 or more
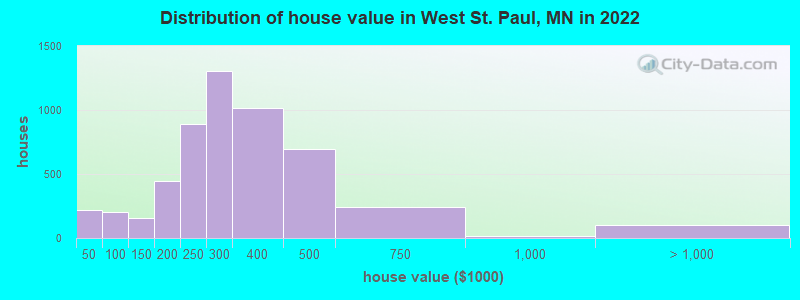
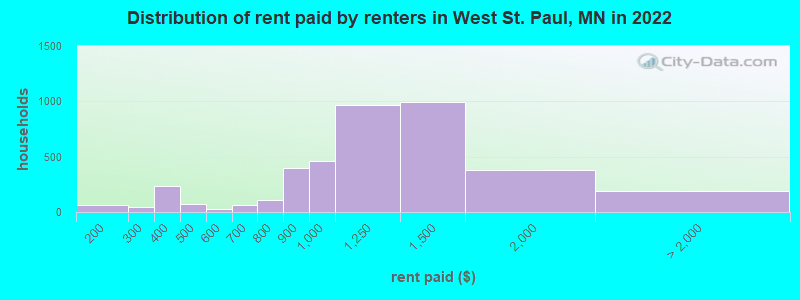
Home value of owner - occupied houses in 2022 in West St. Paul, MN 19 Less than $10,0008 $15,000 to $19,99994 $20,000 to $24,99960 $30,000 to $34,99913 $35,000 to $39,99919 $40,000 to $49,99934 $50,000 to $59,99910 $70,000 to $79,999107 $80,000 to $89,99932 $90,000 to $99,999107 $100,000 to $124,99945 $125,000 to $149,999221 $150,000 to $174,999221 $175,000 to $199,999893 $200,000 to $249,9991,302 $250,000 to $299,9991,011 $300,000 to $399,999694 $400,000 to $499,999244 $500,000 to $749,99919 $750,000 to $999,99983 $1,000,000 to $1,499,99917 $1,500,000 to $1,999,999Rent paid by renters in 2022 in West St. Paul, MN 65 $150 to $19948 $200 to $249103 $300 to $349131 $350 to $39971 $400 to $44925 $500 to $54935 $600 to $64925 $650 to $69934 $700 to $74973 $750 to $799395 $800 to $899461 $900 to $999965 $1,000 to $1,249996 $1,250 to $1,499382 $1,500 to $1,99952 $2,000 to $2,49952 $2,500 to $2,99985 No cash rent
Percentage of workers working in this county: 49.0%Number of people working at home: 2,220 (20.5% of all workers )
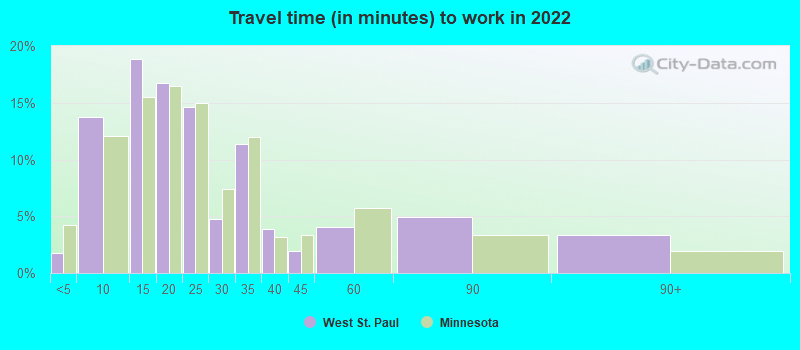
Travel time to work (commute)
Less than 5 minutes: 2675 to 9 minutes: 82410 to 14 minutes: 1,00515 to 19 minutes: 1,91220 to 24 minutes: 1,39825 to 29 minutes: 70730 to 34 minutes: 1,32835 to 39 minutes: 24740 to 44 minutes: 30245 to 59 minutes: 17760 to 89 minutes: 29090 or more minutes: 138
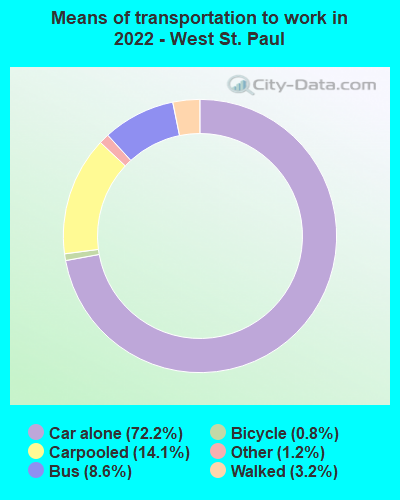
Means of transportation to work:
Drove a car alone: 5,044 (53.7%)Carpooled: 1,142 (12.2%)Bus : 556 (5.9%)Taxi: 145 (1.5%)Bicycle: 45 (0.5%)Walked: 213 (2.3%)Worked at home: 2,220 (23.7%)
Unemployment by race in 2022
Unemployment rate for White non-Hispanic residents 5.6% Males1.7% FemalesUnemployment rate for American Indian and Alaska Native residents 3.1% MalesUnemployment rate for Asian residents 8.7% FemalesUnemployment rate for other race residents 18.3% MalesUnemployment rate for two or more race residents 6.4% Males1.8% FemalesUnemployment rate for Hispanic or Latino residents 18.5% Males2.0% Females
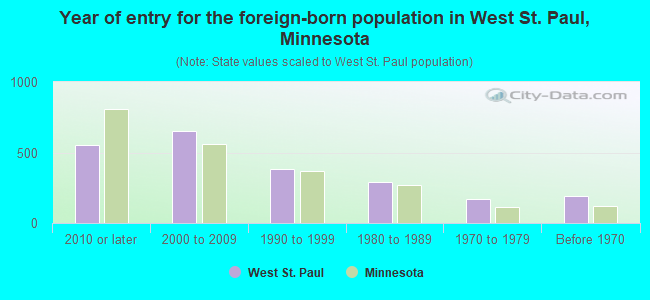
Year of entry for the foreign-born population in West St. Paul, Minnesota
550 2010 or later 655 2000 to 2009 383 1990 to 1999 293 1980 to 1989 169 1970 to 1979 189 Before 1970
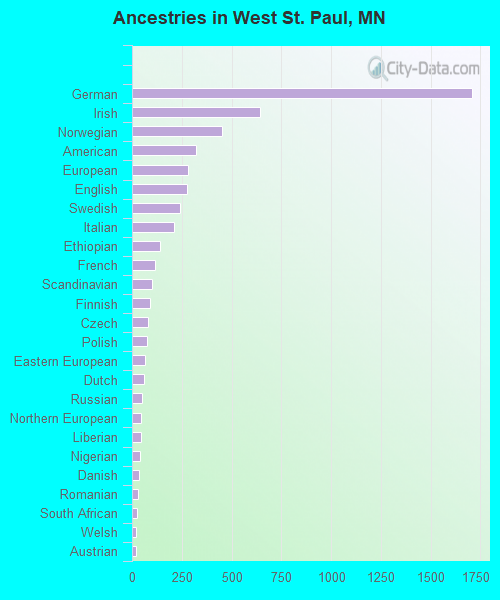
First ancestries reported:
German: 1,708 (18.5%)
Irish: 643 (7.0%)
Norwegian: 450 (4.9%)
American: 320 (3.5%)
European: 283 (3.1%)
English: 275 (3.0%)
Swedish: 242 (2.6%)
Italian: 209 (2.3%)
Ethiopian: 140 (1.5%)
French: 116 (1.3%)
Scandinavian: 101 (1.1%)
Finnish: 89 (1.0%)
Czech: 79 (0.9%)
Polish: 75 (0.8%)
Eastern European: 64 (0.7%)
Dutch: 58 (0.6%)
Russian: 48 (0.5%)
Northern European: 46 (0.5%)
Liberian: 44 (0.5%)
Nigerian: 41 (0.4%)
Danish: 36 (0.4%)
Romanian: 31 (0.3%)
South African: 25 (0.3%)
Welsh: 20 (0.2%)
Austrian: 19 (0.2%)
French Canadian: 19 (0.2%)
African: 18 (0.2%)
British: 16 (0.2%)
Afghan: 12 (0.1%)
Haitian: 12 (0.1%)
Slavic: 10 (0.1%)
Lithuanian: 8 (0.09%)
Brazilian: 7 (0.08%)
German Russian: 6 (0.07%)
Luxembourger: 5 (0.05%)
Hungarian: 5 (0.05%) Most common places of birth for foreign-born residents (%): Mexico West St. Paul:
35.4% (652)Minnesota:
12.1% (58,312)
Ethiopia West St. Paul:
10.0% (185)Minnesota:
5.1% (24,630)
Honduras West St. Paul:
6.1% (113)Minnesota:
0.8% (4,085)
Philippines West St. Paul:
6.0% (110)Minnesota:
2.0% (9,850)
United Kingdom, excluding England and Scotland West St. Paul:
5.7% (105)Minnesota:
0.5% (2,552)
Cambodia West St. Paul:
5.0% (92)Minnesota:
0.9% (4,264)
Russia West St. Paul:
3.1% (57)Minnesota:
1.3% (6,329)
India West St. Paul:
2.9% (53)Minnesota:
6.7% (32,141)
Ireland West St. Paul:
2.4% (44)Minnesota:
0.2% (807)
Cuba West St. Paul:
2.4% (44)Minnesota:
0.3% (1,621)
Germany West St. Paul:
2.2% (41)Minnesota:
1.4% (6,670)
Peru West St. Paul:
2.1% (38)Minnesota:
0.4% (1,963)
Colombia West St. Paul:
1.8% (34)Minnesota:
0.8% (3,651)
Romania West St. Paul:
1.6% (30)Minnesota:
0.2% (967)
Place of birth for U.S.-born residents:
This state: 13,681Other state: 5,085Northeast: 414Midwest: 2,568South: 1,080West: 1,039 84.0% of West St. Paul residents lived in the same house 1 years ago.
Out of people who lived in different houses, 16.0% lived in this county.
Out of people who lived in different counties, 81.8% lived in Minnesota.
West St. Paul:
84.0%State average:
87.4%
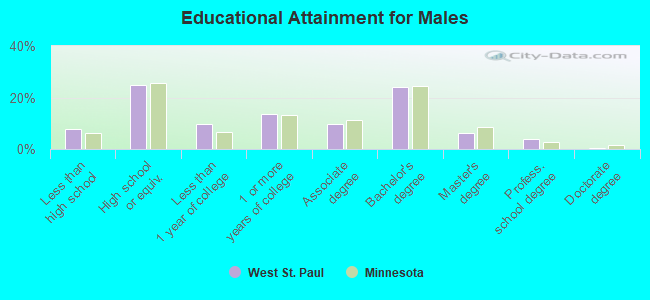
Education attainment for males 25 years and older:
No schooling: 11Nursery to 4th grade: 485th and 6th grade: 997th and 8th grade: 779th grade: 12310th grade: 2211th grade: 6512th grade, no diploma: 88High school graduate (or equivalency): 1,704Less than 1 year of college: 651Some college more than 1 year, no degree: 917Associate degree: 655Bachelor's degree: 1,654Master's degree: 431Professional school degree: 254Doctorate degree: 38
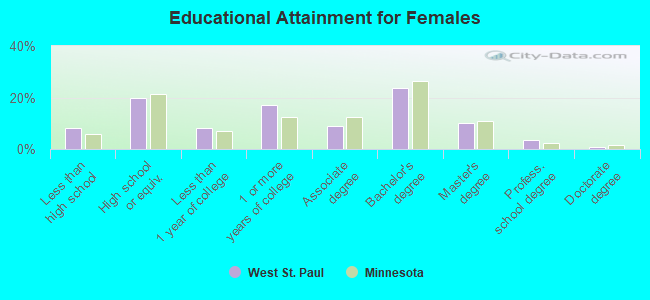
Education attainment for females 25 years and older:
No schooling: 25Nursery to 4th grade: 35th and 6th grade: 87th and 8th grade: 529th grade: 3410th grade: 12711th grade: 37012th grade, no diploma: 80High school graduate (or equivalency): 1,662Less than 1 year of college: 703Some college more than 1 year, no degree: 1,461Associate degree: 747Bachelor's degree: 2,008Master's degree: 843Professional school degree: 282Doctorate degree: 67
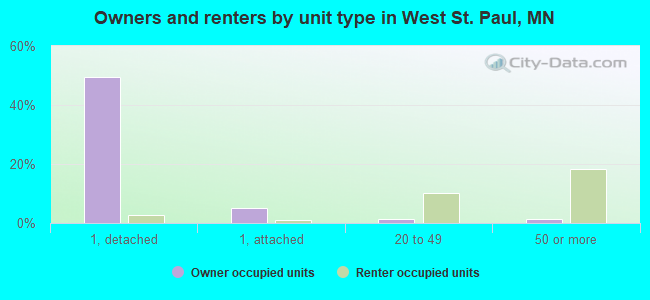
Housing units in structures:
One, detached: 5,153One, attached: 603Two: 1103 or 4: 2485 to 9: 14310 to 19: 81620 to 49: 1,04050 or more: 1,920Housing units lacking complete plumbing facilities in 2022: 0.9%Housing units lacking complete kitchen facilities in 2022: 2.9%House/condo owner moved in on average 10 years ago
Renter moved in on average 4 years ago
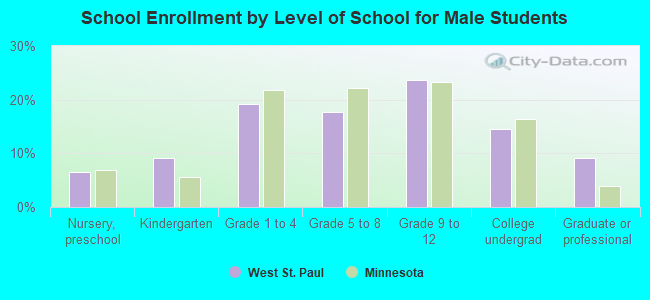
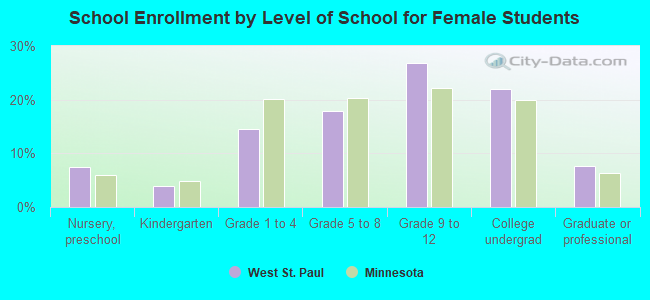
Private vs. public school enrollment:
Students in private schools in grades 1 to 8 (elementary and middle school): 218 Here:
14.9%Minnesota:
12.9%
Students in private schools in grades 9 to 12 (high school): 193 Students in private undergraduate colleges: 141 Here:
18.5%Minnesota:
26.2%