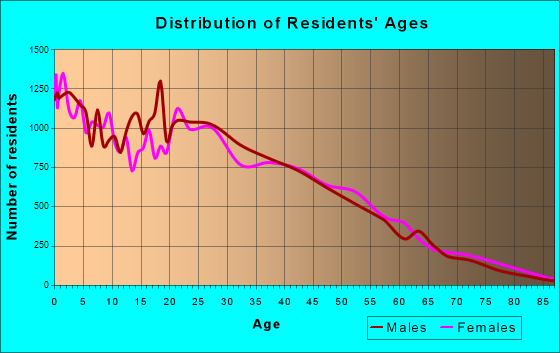
West Valley City, UT (Utah) Houses and Residents
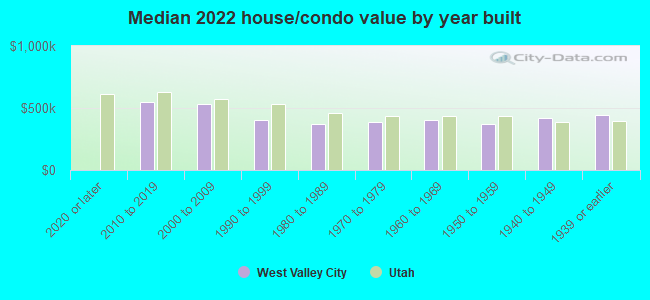
| West Valley City: | $414,700 |
| Utah: | $499,500 |
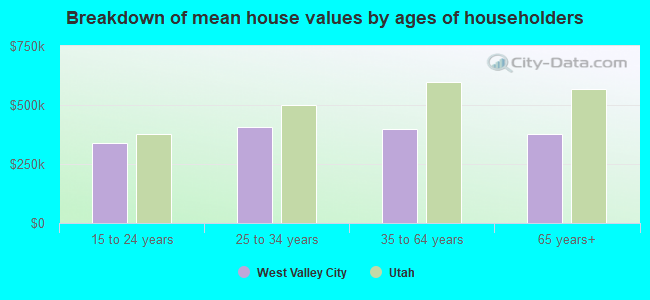
Mean price in 2022:
Detached houses: $459,781
Here: $459,781 State: $607,750 Townhouses or other attached units: $363,159
Here: $363,159 State: $444,505 In 2-unit structures: $375,545
Here: $375,545 State: $433,540 In 3-to-4-unit structures: $185,090
Here: $185,090 State: $362,850 In 5-or-more-unit structures: $333,420
Here: $333,420 State: $412,810 Mobile homes: $81,305
Here: $81,305 State: $113,475
Total population: 134,495 (Urban population: 108,629, Rural population: 194 (all nonfarm))
Houses: 40,307 (38,400 occupied: 27,831 owner occupied, 10,569 renter occupied)
| % of renters here: | 28% |
| State: | 29% |
Housing density: 1,139 houses/condos per square mile
Median price asked for vacant for-sale houses and condos in 2022: $584,596.
Median contract rent in 2022: $1,228 (lower quartile is $950, upper quartile is $1,604)
Median rent asked for vacant for-rent units in 2022: $1,369
Median gross rent in West Valley City, UT in 2022: $1,345
Housing units in West Valley City with a mortgage: 19,261 (2,091 second mortgage, 44 home equity loan, 1,260 both second mortgage and home equity loan)
Houses without a mortgage: 378
Median household income for houses/condos with a mortgage: $106,917
Median household income for apartments without a mortgage: $64,505
Median monthly housing costs: $1,340
Compare current foreclosures near West Valley City, UT:
| Photo | Address | Area | Beds / Baths | Price | Details |
|---|---|---|---|---|---|

|
#1
S 3425 W
West Valley City, UT 84119
|
1,064 sq. feet
|
1 baths 2 beds |
show details | |

|
#2
S Holladay Cir
Salt Lake City, UT 84117
|
2,440 sq. feet
|
2 baths 4 beds |
$799,900
|
show details |

|
#3
E Downington Ave
Salt Lake City, UT 84108
|
2,580 sq. feet
|
2 baths 1 beds |
$949,900
|
show details |

|
#4
W Mason Way
Magna, UT 84044
|
932 sq. feet
|
2 baths 4 beds |
show details | |

|
#5
W 3800 S
Salt Lake City, UT 84119
|
2,050 sq. feet
|
2 baths 3 beds |
show details | |

|
#6
N Fairway Dr
North Salt Lake, UT 84054
|
2,929 sq. feet
|
3 baths 4 beds |
show details | |

|
#7
W 6785 S
West Jordan, UT 84084
|
1,516 sq. feet
|
3 baths 4 beds |
show details | |

|
#8
E Wilson Ave
Salt Lake City, UT 84105
|
950 sq. feet
|
1 baths 3 beds |
show details | |

|
#9
Mankato St
Herriman, UT 84096
|
1,468 sq. feet
|
2 baths 3 beds |
show details | |

|
#10
W 5780 S
Salt Lake City, UT 84129
|
1,100 sq. feet
|
1 baths 1 beds |
show details |
| Photo | Address | Area | Beds / Baths | Price | Details |
|---|---|---|---|---|---|

|
#11
W 3500 S Ste 5040w
Salt Lake City, UT 84119
|
736 sq. feet
|
2 baths 3 beds |
show details | |

|
#12
S Cascade Way
Salt Lake City, UT 84109
|
1,185 sq. feet
|
1 baths 5 beds |
show details | |

|
#13
W Heath Ave
Salt Lake City, UT 84118
|
979 sq. feet
|
1 baths 5 beds |
show details | |

|
#14
S Interlochin Ln
West Jordan, UT 84084
|
2,054 sq. feet
|
2 baths 3 beds |
show details | |

|
#15
W Aspen Springs Dr
Herriman, UT 84096
|
1,334 sq. feet
|
2 baths 2 beds |
show details | |

|
#16
S Solano Cir
Salt Lake City, UT 84120
|
1,009 sq. feet
|
2 baths 5 beds |
show details | |

|
#17
S 4340 W
Salt Lake City, UT 84118
|
1,176 sq. feet
|
2 baths 3 beds |
show details | |

|
#18
W 300 S
Salt Lake City, UT 84104
|
1,313 sq. feet
|
1 baths 3 beds |
show details | |

|
#19
W Alta View Way
Sandy, UT 84070
|
1,440 sq. feet
|
2 baths 3 beds |
show details | |

|
#20
S Meadowlark Ln
West Jordan, UT 84088
|
1,748 sq. feet
|
2 baths 3 beds |
show details |
| Photo | Address | Area | Beds / Baths | Price | Details |
|---|---|---|---|---|---|

|
#21
Ashley Ridge Rd
Sandy, UT 84092
|
2,661 sq. feet
|
2 baths 6 beds |
show details | |

|
#22
W Patriot Cir
Magna, UT 84044
|
912 sq. feet
|
1 baths 2 beds |
show details | |

|
#23
S Spencer Ave
Magna, UT 84044
|
448 sq. feet
|
1 baths 1 beds |
show details | |

|
#24
S Inauguration Rd
Draper, UT 84020
|
796 sq. feet
|
1 baths 3 beds |
show details | |

|
#25
S Timp View Dr
Riverton, UT 84065
|
1,914 sq. feet
|
2 baths 4 beds |
show details | |

|
#26
W Beverlee Ann Dr
Draper, UT 84020
|
1,262 sq. feet
|
2 baths 3 beds |
show details | |

|
#27
W Athleen Dr
West Jordan, UT 84084
|
1,350 sq. feet
|
1 baths 4 beds |
show details | |

|
#28
W Wimbledon Ridge Ln
West Jordan, UT 84084
|
2,297 sq. feet
|
3 baths 4 beds |
show details | |

|
#29
S 2870 W
West Jordan, UT 84088
|
1,310 sq. feet
|
2 baths 4 beds |
show details | |

|
#30
S Spencer Ave
Magna, UT 84044
|
972 sq. feet
|
1 baths 3 beds |
show details |
| Photo | Address | Area | Beds / Baths | Price | Details |
|---|---|---|---|---|---|

|
#31
Westfield Cir
West Jordan, UT 84084
|
1,032 sq. feet
|
1 baths 3 beds |
show details | |

|
#32
W 6300 S
Salt Lake City, UT 84123
|
2,288 sq. feet
|
3 baths 5 beds |
show details | |

|
#33
S Sandy Creek Dr
Sandy, UT 84094
|
1,780 sq. feet
|
2 baths 4 beds |
show details | |

|
#34
S 2400 W
West Jordan, UT 84084
|
1,894 sq. feet
|
2 baths 4 beds |
show details | |

|
#35
S 8900 W
Magna, UT 84044
|
948 sq. feet
|
1 baths 4 beds |
show details | |

|
#36
S Bay Meadows Dr
Sandy, UT 84092
|
2,382 sq. feet
|
3 baths 5 beds |
show details | |

|
#37
S 9000 W
Magna, UT 84044
|
1,356 sq. feet
|
1 baths 3 beds |
show details | |

|
#38
S 150 E
Draper, UT 84020
|
2,820 sq. feet
|
4 baths 5 beds |
show details | |

|
#39
E Southgate Ave
Salt Lake City, UT 84115
|
1,168 sq. feet
|
1 baths 3 beds |
show details | |

|
#40
S 400 E
Salt Lake City, UT 84107
|
945 sq. feet
|
1 baths 2 beds |
show details |
| Photo | Address | Area | Beds / Baths | Price | Details |
|---|---|---|---|---|---|

|
#41
W Haven Maple Dr
West Jordan, UT 84081
|
1,285 sq. feet
|
2 baths 3 beds |
show details | |

|
#42
S Countrywood Dr
Sandy, UT 84092
|
1,800 sq. feet
|
2 baths 4 beds |
show details | |

|
#43
S Sandy Dunes Dr
Sandy, UT 84094
|
2,266 sq. feet
|
2 baths 4 beds |
show details | |

|
#44
S Sunset Maple Dr
West Jordan, UT 84081
|
1,847 sq. feet
|
2 baths 4 beds |
show details | |

|
#45
E Snow Mountain Dr
Sandy, UT 84093
|
2,790 sq. feet
|
4 baths 6 beds |
show details | |

|
#46
W 7055 S
West Jordan, UT 84084
|
1,440 sq. feet
|
1 baths 2 beds |
show details | |

|
#47
S 3970 W
South Jordan, UT 84095
|
2,370 sq. feet
|
2 baths 4 beds |
show details | |

|
#48
E 3360 S
Salt Lake City, UT 84115
|
1,642 sq. feet
|
2 baths 3 beds |
show details | |

|
#49
W Ranches Loop Rd
West Jordan, UT 84081
|
1,301 sq. feet
|
2 baths 3 beds |
show details | |

|
Check over 1 million property listings on Foreclosure.com!
|
browse all offers | |||


 | Best apartments in SLC metro for $1000 or less? (3 replies) |
| Best apartments in SLC (14 replies) |
| Somerset Village Apartments on Redwood Road (3 replies) |
| Moving to Salt Lake. West Valley City? (6 replies) |
| Using public transportation from West Valley City? (7 replies) |
| Son Has Moved to Utah, Salt Lake City (8 replies) |
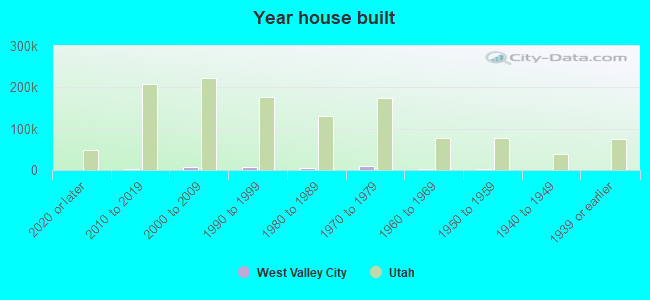
Median year apartment built: 1985
Household type by relationship:
Households: 136,639- Male householders: 18,330 (3,326 living alone), Female householders: 20,070 (3,601 living alone)
21,070 spouses (20,743 opposite-sex spouses), 3,076 unmarried partners, (3,008 opposite-sex unmarried partners), 52,846 children (50,149 natural, 421 adopted, 2,276 stepchildren), 4,047 grandchildren, 3,545 brothers or sisters, 3,677 parents, 51 foster children, 4,380 other relatives, 5,263 non-relatives
- In group quarters: 284
Size of family households: 7,241 2-persons, 6,403 3-persons, 5,756 4-persons, 3,603 5-persons, 2,041 6-persons, 3,925 7-or-more-persons.
Size of nonfamily households: 6,927 1-person, 1,849 2-persons, 593 3-persons, 62 4-persons.
31,009 married couples with children.
7,884 single-parent households (3,304 men, 4,580 women).
58.3% of residents of West Valley City speak English at home.
31.8% of residents speak Spanish at home (58% speak English very well, 18% speak English well, 18% speak English not well, 7% don't speak English at all).
2.2% of residents speak other Indo-European language at home (54% speak English very well, 22% speak English well, 23% speak English not well, 1% don't speak English at all).
6.7% of residents speak Asian or Pacific Island language at home (61% speak English very well, 18% speak English well, 16% speak English not well, 4% don't speak English at all).
1.8% of residents speak other language at home (75% speak English very well, 10% speak English well, 13% speak English not well, 2% don't speak English at all).
Foreign born population: 32,020 (23.4%)
(40.6% of them are naturalized citizens)
| Here: | 6.9 |
| State: | 7.6 |
| Here: | 4.4 |
| State: | 4.3 |
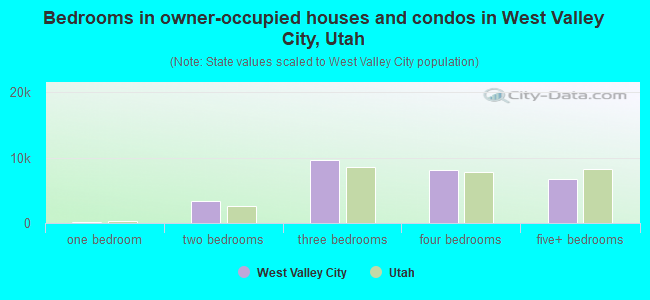
- Bedrooms in owner-occupied houses and condos in West Valley City, Utah
- 0no bedroom
- 871 bedroom
- 3,3192 bedrooms
- 9,5963 bedrooms
- 8,1644 bedrooms
- 6,6655+ bedrooms
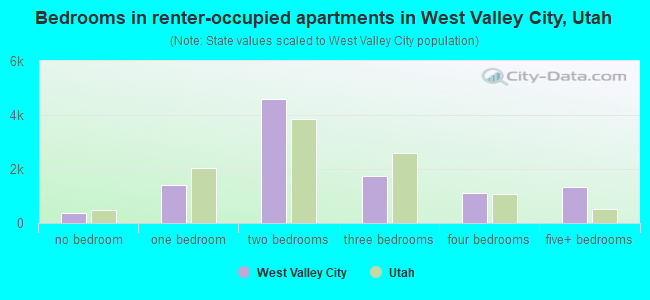
- Bedrooms in renter-occupied apartments in West Valley City, Utah
- 352no bedroom
- 1,4131 bedroom
- 4,6102 bedrooms
- 1,7543 bedrooms
- 1,1214 bedrooms
- 1,3195+ bedrooms
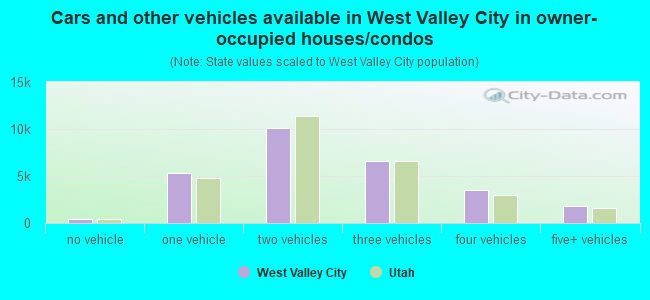
- Cars and other vehicles available in West Valley City in owner-occupied houses/condos
- 441no vehicle
- 5,3511 vehicle
- 10,1252 vehicles
- 6,5903 vehicles
- 3,5354 vehicles
- 1,7895+ vehicles
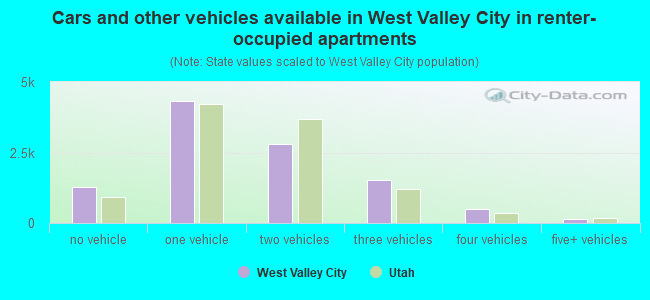
- Cars and other vehicles available in West Valley City in renter-occupied apartments
- 1,271no vehicle
- 4,3421 vehicle
- 2,8012 vehicles
- 1,5143 vehicles
- 5064 vehicles
- 1355+ vehicles
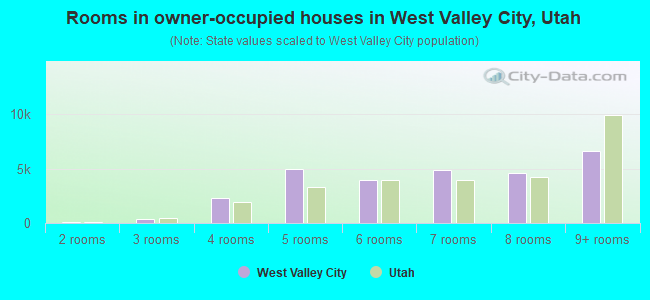
- Rooms in owner-occupied houses in West Valley City, Utah
- 01 room
- 502 rooms
- 3913 rooms
- 2,3434 rooms
- 5,0065 rooms
- 3,9486 rooms
- 4,8937 rooms
- 4,5638 rooms
- 6,6379+ rooms
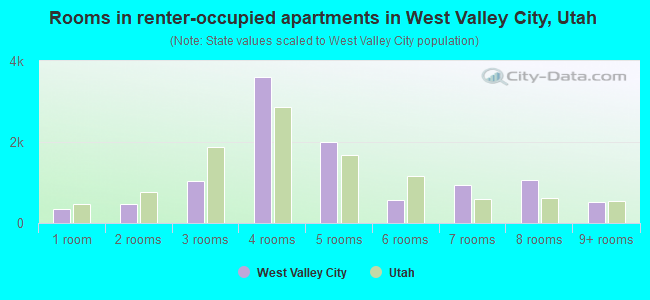
- Rooms in renter-occupied apartments in West Valley City, Utah
- 3521 room
- 4722 rooms
- 1,0473 rooms
- 3,6124 rooms
- 2,0055 rooms
- 5596 rooms
- 9377 rooms
- 1,0588 rooms
- 5279+ rooms
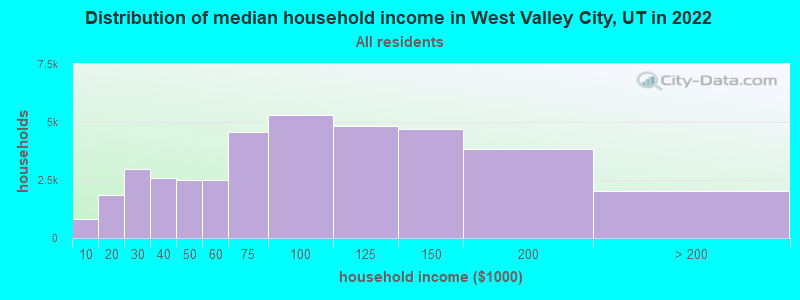
West Valley City, UT household income distribution

- 812Less than $10,000
- 1,845$10,000 to $19,999
- 2,965$20,000 to $29,999
- 2,568$30,000 to $39,999
- 2,516$40,000 to $49,999
- 2,500$50,000 to $59,999
- 4,562$60,000 to $74,999
- 5,289$75,000 to $99,999
- 4,811$100,000 to $124,999
- 4,706$125,000 to $149,999
- 3,816$150,000 to $199,999
- 2,010$200,000 or more
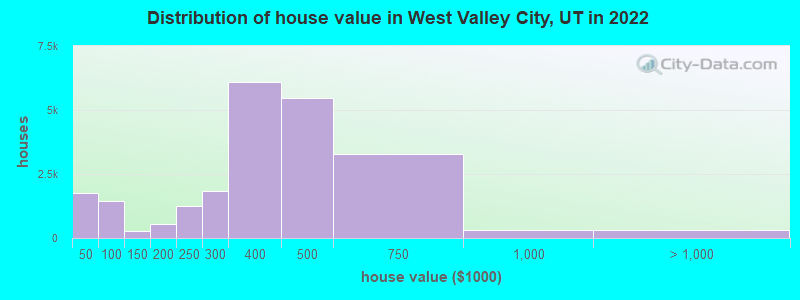
Home value of owner - occupied houses in 2022 in West Valley City, UT
-
- 426Less than $10,000
- 141$10,000 to $14,999
- 111$15,000 to $19,999
- 75$20,000 to $24,999
- 301$25,000 to $29,999
- 85$30,000 to $34,999
- 302$35,000 to $39,999
- 305$40,000 to $49,999
- 755$50,000 to $59,999
- 143$60,000 to $69,999
- 80$70,000 to $79,999
- 18$80,000 to $89,999
- 155$90,000 to $99,999
- 117$100,000 to $124,999
- 151$125,000 to $149,999
- 213$150,000 to $174,999
- 349$175,000 to $199,999
- 1,254$200,000 to $249,999
- 1,837$250,000 to $299,999
- 6,097$300,000 to $399,999
- 5,485$400,000 to $499,999
- 3,282$500,000 to $749,999
- 323$750,000 to $999,999
- 142$1,000,000 to $1,499,999
- 67$1,500,000 to $1,999,999
- 100$2,000,000 or more
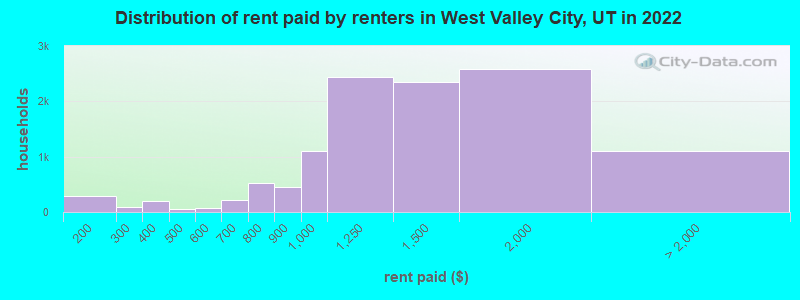
Rent paid by renters in 2022 in West Valley City, UT
-
- 206$100 to $149
- 84$150 to $199
- 53$200 to $249
- 44$250 to $299
- 192$300 to $349
- 10$350 to $399
- 28$400 to $449
- 23$450 to $499
- 66$500 to $549
- 5$550 to $599
- 152$600 to $649
- 61$650 to $699
- 120$700 to $749
- 409$750 to $799
- 447$800 to $899
- 1,108$900 to $999
- 2,440$1,000 to $1,249
- 2,355$1,250 to $1,499
- 2,581$1,500 to $1,999
- 755$2,000 to $2,499
- 47$2,500 to $2,999
- 2$3,000 to $3,499
- 295No cash rent
Percentage of workers working in this county: 95.4%
Number of people working at home: 7,152 (10.8% of all workers)
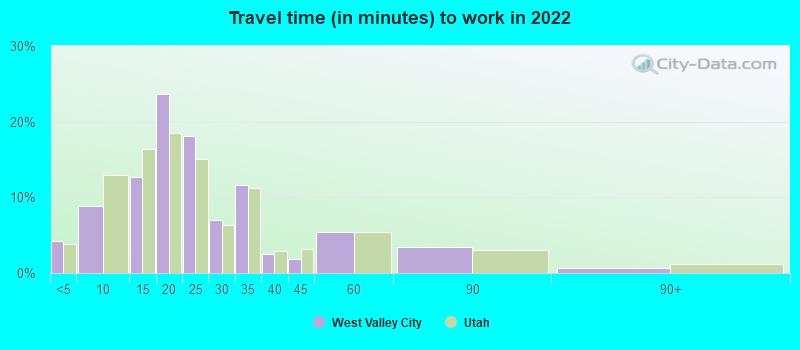
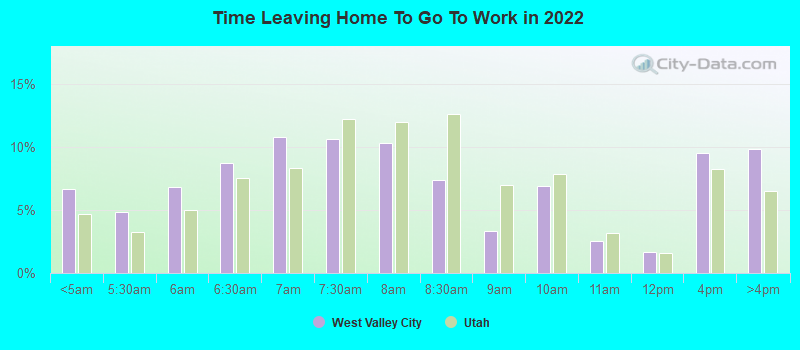
Travel time to work (commute)
- Less than 5 minutes: 2,189
- 5 to 9 minutes: 4,188
- 10 to 14 minutes: 7,266
- 15 to 19 minutes: 14,187
- 20 to 24 minutes: 12,423
- 25 to 29 minutes: 3,739
- 30 to 34 minutes: 8,927
- 35 to 39 minutes: 1,226
- 40 to 44 minutes: 1,042
- 45 to 59 minutes: 1,931
- 60 to 89 minutes: 1,455
- 90 or more minutes: 501
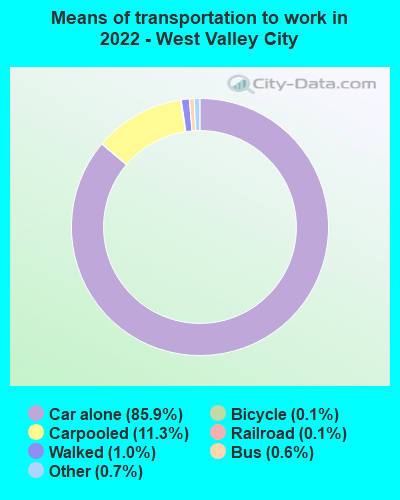
Means of transportation to work:
- Drove a car alone: 45,964 (74.6%)
- Carpooled: 6,518 (10.6%)
- Bus: 247 (0.4%)
- Long-distance train or commuter rail: 28 (0.0%)
- Light rail, streetcar or trolley: 57 (0.1%)
- Ferryboat: 5 (0.0%)
- Taxi: 411 (0.7%)
- Bicycle: 69 (0.1%)
- Walked: 537 (0.9%)
- Worked at home: 7,331 (11.9%)
- Unemployment by race in 2022
- Unemployment rate for White non-Hispanic residents
- 2.3%Males
- 1.0%Females
- Unemployment rate for Black residents
- 2.1%Males
- 14.2%Females
- Unemployment rate for American Indian and Alaska Native residents
- 11.8%Males
- 10.6%Females
- Unemployment rate for Asian residents
- 0.9%Males
- 0.6%Females
- Unemployment rate for other race residents
- 2.0%Males
- 5.2%Females
- Unemployment rate for two or more race residents
- 4.2%Males
- 3.8%Females
- Unemployment rate for Hispanic or Latino residents
- 1.2%Males
- 3.9%Females
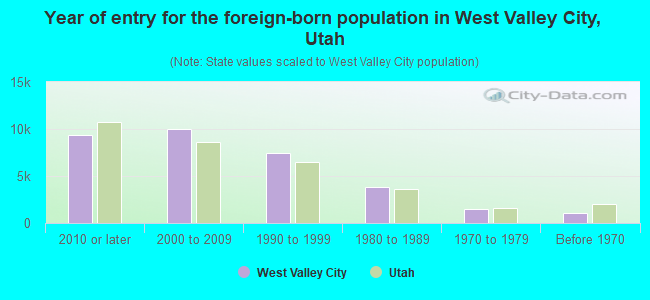
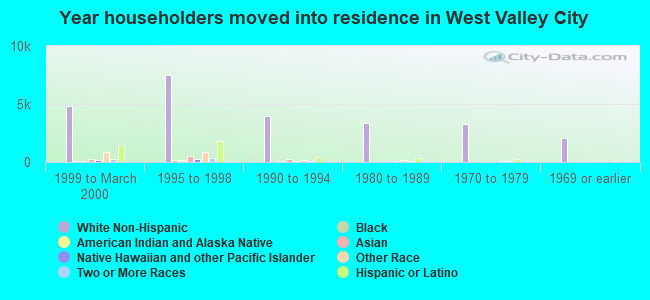
- Year of entry for the foreign-born population in West Valley City, Utah
- 9,3292010 or later
- 10,0422000 to 2009
- 7,4731990 to 1999
- 3,8311980 to 1989
- 1,4411970 to 1979
- 1,064Before 1970
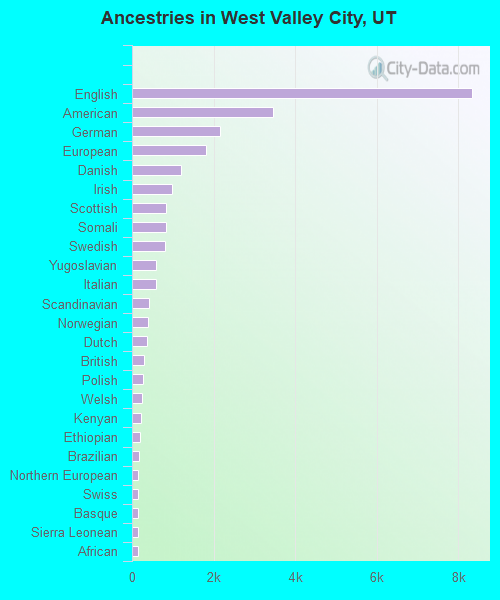
First ancestries reported:
- English: 8,331 (9.9%)
- American: 3,444 (4.1%)
- German: 2,165 (2.6%)
- European: 1,821 (2.2%)
- Danish: 1,203 (1.4%)
- Irish: 980 (1.2%)
- Scottish: 830 (1.0%)
- Somali: 830 (1.0%)
- Swedish: 799 (1.0%)
- Yugoslavian: 592 (0.7%)
- Italian: 591 (0.7%)
- Scandinavian: 416 (0.5%)
- Norwegian: 391 (0.5%)
- Dutch: 371 (0.4%)
- British: 282 (0.3%)
- Polish: 280 (0.3%)
- Welsh: 249 (0.3%)
- Kenyan: 217 (0.3%)
- Ethiopian: 191 (0.2%)
- Brazilian: 176 (0.2%)
- Northern European: 148 (0.2%)
- Swiss: 144 (0.2%)
- Basque: 140 (0.2%)
- Sierra Leonean: 140 (0.2%)
- African: 137 (0.2%)
- French: 107 (0.1%)
- Iranian: 105 (0.1%)
- Belizean: 99 (0.1%)
- Scotch-Irish: 96 (0.1%)
- Sudanese: 93 (0.1%)
- Greek: 93 (0.1%)
- Egyptian: 88 (0.1%)
- Serbian: 79 (0.09%)
- Russian: 78 (0.09%)
- Haitian: 73 (0.09%)
- Slavic: 56 (0.07%)
- Liberian: 55 (0.07%)
- Portuguese: 52 (0.06%)
- Eastern European: 38 (0.05%)
- Romanian: 28 (0.03%)
- Canadian: 28 (0.03%)
- Hungarian: 25 (0.03%)
- French Canadian: 24 (0.03%)
- Ghanaian: 19 (0.02%)
- Iraqi: 18 (0.02%)
- Armenian: 17 (0.02%)
- Croatian: 16 (0.02%)
- Slovene: 15 (0.02%)
- Finnish: 14 (0.02%)
- Ukrainian: 12 (0.01%)
- Czech: 9 (0.01%)
- Luxembourger: 9 (0.01%)
- Belgian: 8 (0.01%)
- Maltese: 7 (0.01%)
- Senegalese: 7 (0.01%)
- Lebanese: 6 (0.01%)
Most common places of birth for foreign-born residents (%):
| West Valley City: | 53.0% (17,179) |
| Utah: | 36.1% (99,740) |
| West Valley City: | 6.6% (2,132) |
| Utah: | 2.7% (7,472) |
| West Valley City: | 6.3% (2,043) |
| Utah: | 2.6% (7,211) |
| West Valley City: | 3.3% (1,069) |
| Utah: | 2.1% (5,902) |
| West Valley City: | 3.1% (1,013) |
| Utah: | 3.2% (8,804) |
| West Valley City: | 2.1% (666) |
| Utah: | 2.9% (7,901) |
| West Valley City: | 1.6% (530) |
| Utah: | 2.0% (5,555) |
| West Valley City: | 1.6% (527) |
| Utah: | 2.3% (6,468) |
| West Valley City: | 1.5% (488) |
| Utah: | 3.0% (8,294) |
Place of birth for U.S.-born residents:
- This state: 81,856
- Other state: 21,137
- Northeast: 1,273
- Midwest: 2,743
- South: 2,108
- West: 15,013
86.9% of West Valley City residents lived in the same house 1 years ago.
Out of people who lived in different houses, 43.1% lived in this county.
Out of people who lived in different counties, 54.3% lived in Utah.
| West Valley City: | 86.9% |
| State average: | 85.7% |
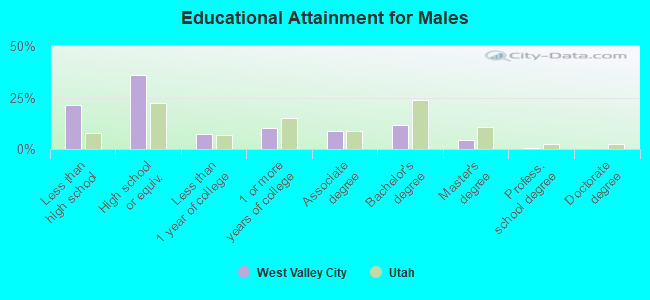
Education attainment for males 25 years and older:
- No schooling: 2,481
- Nursery to 4th grade: 138
- 5th and 6th grade: 1,503
- 7th and 8th grade: 210
- 9th grade: 644
- 10th grade: 856
- 11th grade: 902
- 12th grade, no diploma: 1,185
- High school graduate (or equivalency): 13,364
- Less than 1 year of college: 2,715
- Some college more than 1 year, no degree: 3,730
- Associate degree: 3,273
- Bachelor's degree: 4,340
- Master's degree: 1,703
- Professional school degree: 183
- Doctorate degree: 87
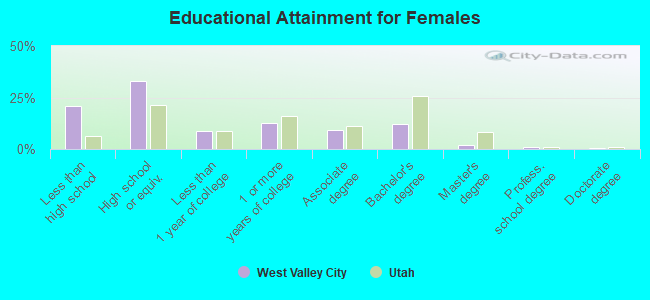
Education attainment for females 25 years and older:
- No schooling: 2,197
- Nursery to 4th grade: 285
- 5th and 6th grade: 890
- 7th and 8th grade: 946
- 9th grade: 937
- 10th grade: 244
- 11th grade: 1,185
- 12th grade, no diploma: 1,650
- High school graduate (or equivalency): 13,063
- Less than 1 year of college: 3,576
- Some college more than 1 year, no degree: 5,049
- Associate degree: 3,637
- Bachelor's degree: 4,880
- Master's degree: 777
- Professional school degree: 338
- Doctorate degree: 154
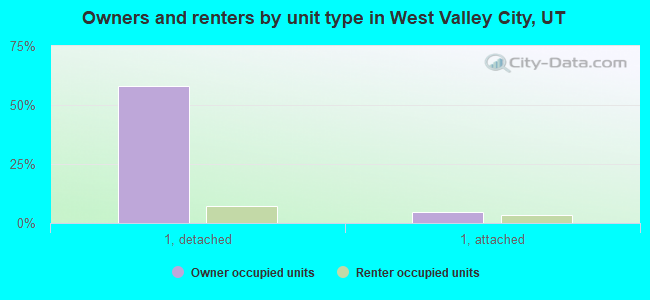
Housing units in structures:
- One, detached: 26,950
- One, attached: 2,787
- Two: 757
- 3 or 4: 2,818
- 5 to 9: 846
- 10 to 19: 1,305
- 20 to 49: 1,167
- 50 or more: 380
- Mobile homes: 3,297
Median worth of mobile homes: $56,900
Housing units lacking complete kitchen facilities in 2022: 1.2%
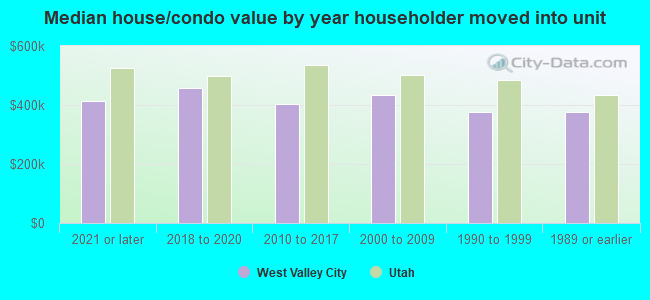
House/condo owner moved in on average 11 years ago
Renter moved in on average 3 years ago
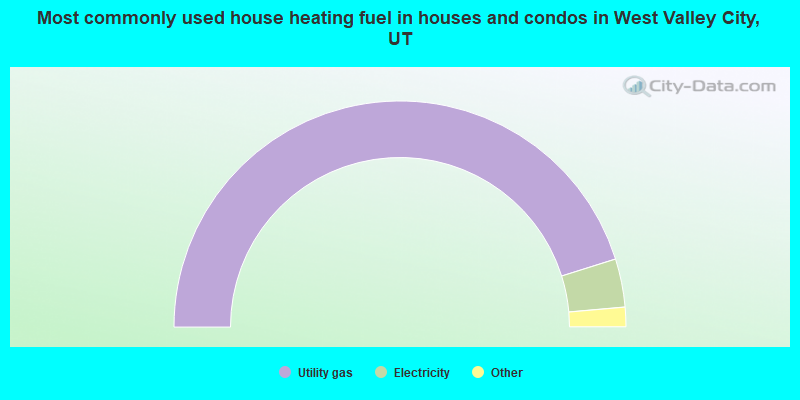
- 90.3%Utility gas
- 6.9%Electricity
- 1.3%Bottled, tank, or LP gas
- 0.8%No fuel used
- 0.3%Other fuel
- 0.2%Solar energy
- 0.1%Wood
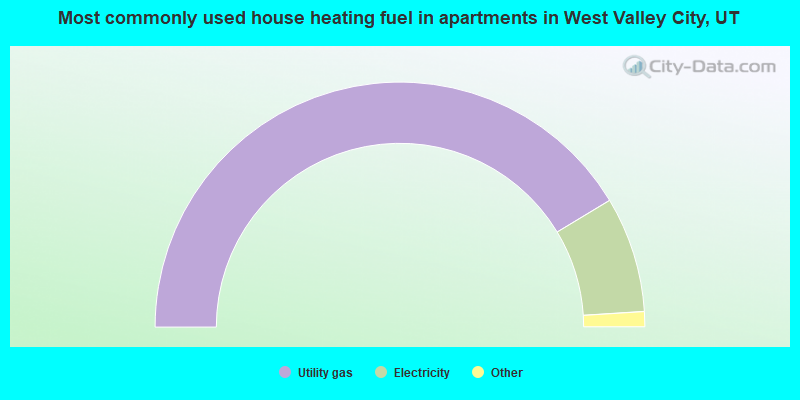
- 82.7%Utility gas
- 15.3%Electricity
- 1.7%Bottled, tank, or LP gas
- 0.2%No fuel used
- 0.1%Other fuel
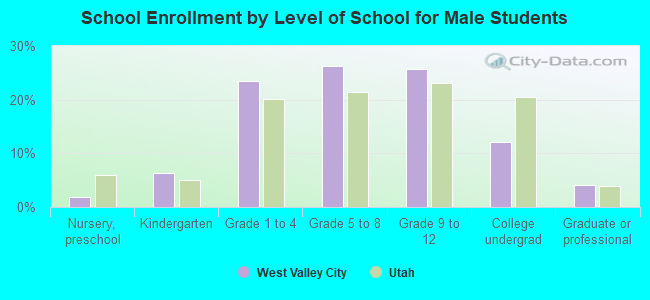
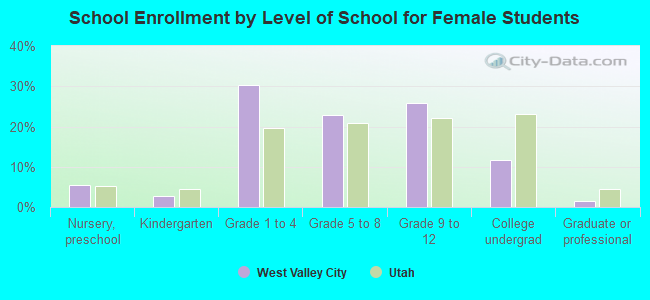
Private vs. public school enrollment:
| Here: | 2.0% |
| Utah: | 7.2% |
| Here: | 1.2% |
| Utah: | 5.3% |
| Here: | 15.1% |
| Utah: | 26.7% |