West Valley, WA (Washington) Houses and Residents
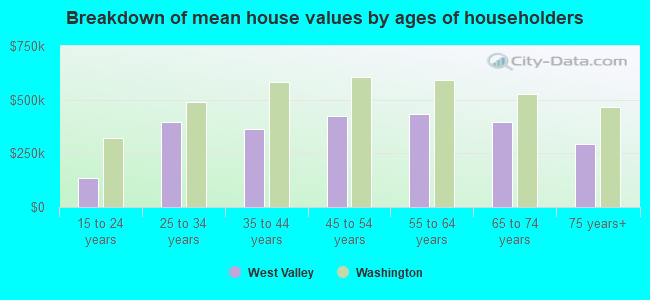
| West Valley: | $407,463 |
| Washington: | $569,500 |
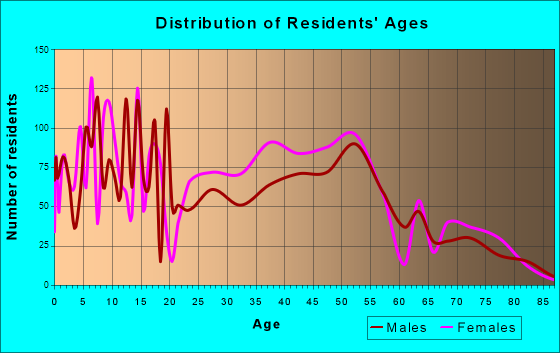
Total population: 10,882 (Urban population: 9,732, Rural population: 328 (all nonfarm))
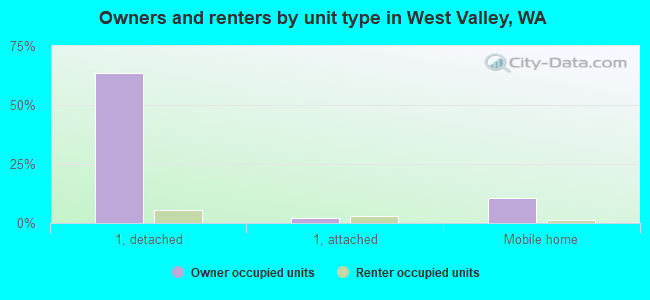
Houses: 3,933 (3,799 occupied: 2,950 owner occupied, 849 renter occupied)
| % of renters here: | 22% |
| State: | 36% |
Housing density: 546 houses/condos per square mile
Median price asked for vacant for-sale houses and condos in 2022 in this county: $337,394.
Median contract rent in 2022: $1,259 (lower quartile is $1,089, upper quartile is $1,426)
Median rent asked for vacant for-rent units in 2022: $1,325
Median gross rent in West Valley, WA in 2022: $1,415
Housing units in West Valley with a mortgage: 1,947 (206 second mortgage, 252 home equity loan, 0 both second mortgage and home equity loan)
Houses without a mortgage: 471
Compare current foreclosures near West Valley, WA:
| Photo | Address | Area | Beds / Baths | Price | Details |
|---|---|---|---|---|---|

|
#1
Hillcrest Dr
Yakima, WA 98901
|
2,035 sq. feet
|
2 baths 4 beds |
show details | |

|
#2
Riverside Ln
Naches, WA 98937
|
1,624 sq. feet
|
2 baths 3 beds |
show details | |

|
#3
1st St
Yakima, WA 98903
|
952 sq. feet
|
1 baths 3 beds |
show details | |

|
#4
N 25th Ave
Yakima, WA 98902
|
1,494 sq. feet
|
1 baths 3 beds |
show details | |

|
#5
Gun Club Rd Unit 38
Yakima, WA 98901
|
1,424 sq. feet
|
2 baths 2 beds |
show details | |

|
#6
Whites Pl
Selah, WA 98942
|
1,196 sq. feet
|
1 baths 3 beds |
show details | |

|
#7
S 25th Ave Vacant Land 224 S 25th Ave
Yakima, WA 98902
|
1,683 sq. feet
|
1 baths 4 beds |
show details | |

|
#8
S 27th Ave
Yakima, WA 98902
|
- sq. feet
|
1 baths 2 beds |
show details | |

|
#9
Richey Rd
Yakima, WA 98908
|
2,294 sq. feet
|
4 baths 3 beds |
show details | |

|
#10
Saint Johns St
Yakima, WA 98902
|
1,838 sq. feet
|
1 baths 2 beds |
show details |
| Photo | Address | Area | Beds / Baths | Price | Details |
|---|---|---|---|---|---|

|
#11
Birchfield Rd
Yakima, WA 98901
|
4,908 sq. feet
|
4 baths 4 beds |
show details | |

|
#12
Bridle Way
Yakima, WA 98901
|
1,550 sq. feet
|
1 baths 3 beds |
show details | |

|
#13
W Chestnut Ave
Yakima, WA 98908
|
1,640 sq. feet
|
2 baths 3 beds |
show details | |

|
#14
Klockhamer Rd
Naches, WA 98937
|
1,594 sq. feet
|
1 baths 3 beds |
show details | |

|
#15
N 20th Ave
Yakima, WA 98902
|
1,274 sq. feet
|
1 baths 3 beds |
show details | |

|
#16
Citra Ave
Moxee, WA 98936
|
2,711 sq. feet
|
2 baths 5 beds |
show details | |

|
#17
Young Grade Rd
Yakima, WA 98908
|
1,818 sq. feet
|
2 baths 3 beds |
show details | |

|
#18
W Yakima Ave
Yakima, WA 98902
|
1,269 sq. feet
|
2 baths 3 beds |
show details | |

|
#19
Gregory Ave
Yakima, WA 98902
|
1,358 sq. feet
|
1 baths 3 beds |
show details | |

|
#20
W Wapato Rd
Wapato, WA 98951
|
1,116 sq. feet
|
1 baths 3 beds |
show details |
| Photo | Address | Area | Beds / Baths | Price | Details |
|---|---|---|---|---|---|

|
#21
S 12th Ave
Yakima, WA 98902
|
- sq. feet
|
1 baths 3 beds |
show details | |

|
#22
S 21st Ave
Yakima, WA 98902
|
- sq. feet
|
1 baths 2 beds |
show details | |

|
#23
Yakima Valley Hwy
Wapato, WA 98951
|
1,374 sq. feet
|
1 baths 3 beds |
show details | |

|
#24
Tieton Dr
Yakima, WA 98908
|
2,208 sq. feet
|
2 baths 4 beds |
show details | |

|
#25
S 4th Ave
Yakima, WA 98902
|
2,454 sq. feet
|
3 baths 4 beds |
show details | |

|
#26
W Mead Ave
Yakima, WA 98902
|
1,973 sq. feet
|
1 baths 3 beds |
show details | |

|
#27
Wide Hollow Rd
Yakima, WA 98908
|
1,710 sq. feet
|
1 baths 2 beds |
show details | |

|
#28
Scogin Ln
Yakima, WA 98908
|
2,284 sq. feet
|
2 baths 2 beds |
show details | |

|
#29
Cornell Ave
Yakima, WA 98902
|
1,760 sq. feet
|
1 baths 4 beds |
show details | |

|
#30
S 5th Ave
Yakima, WA 98902
|
1,056 sq. feet
|
1 baths 2 beds |
show details |
| Photo | Address | Area | Beds / Baths | Price | Details |
|---|---|---|---|---|---|

|
#31
S 3rd Ave
Yakima, WA 98902
|
2,260 sq. feet
|
1 baths 4 beds |
show details | |

|
#32
S 3rd Ave
Yakima, WA 98902
|
2,260 sq. feet
|
1 baths 4 beds |
show details | |

|
#33
Cedar Ln
Selah, WA 98942
|
2,096 sq. feet
|
2 baths 3 beds |
show details | |

|
#34
S 7th Ave
Yakima, WA 98902
|
1,081 sq. feet
|
1 baths 2 beds |
show details | |

|
#35
Cornell Ave
Yakima, WA 98902
|
925 sq. feet
|
1 baths 3 beds |
show details | |

|
#36
S 1st Ave
Yakima, WA 98902
|
1,185 sq. feet
|
1 baths 3 beds |
show details | |

|
#37
W Mead Ave
Yakima, WA 98902
|
2,074 sq. feet
|
2 baths 4 beds |
show details | |

|
#38
N 68th Pl
Yakima, WA 98908
|
2,544 sq. feet
|
3 baths 4 beds |
show details | |

|
#39
S 6th Ave
Yakima, WA 98902
|
1,425 sq. feet
|
1 baths 3 beds |
show details | |

|
#40
Swan Ave
Yakima, WA 98902
|
840 sq. feet
|
1 baths 2 beds |
show details |
| Photo | Address | Area | Beds / Baths | Price | Details |
|---|---|---|---|---|---|

|
#41
Roosevelt Ave
Yakima, WA 98902
|
1,418 sq. feet
|
1 baths 3 beds |
show details | |

|
#42
N 15th Ave
Yakima, WA 98902
|
670 sq. feet
|
1 baths 2 beds |
show details | |

|
#43
Loren Ave
Yakima, WA 98902
|
1,040 sq. feet
|
1 baths 2 beds |
show details | |

|
#44
Mapleway Rd
Yakima, WA 98908
|
2,912 sq. feet
|
2 baths 3 beds |
show details | |

|
#45
Fairbanks Ave
Yakima, WA 98902
|
1,456 sq. feet
|
1 baths 3 beds |
show details | |

|
#46
Wide Hollow Rd
Yakima, WA 98908
|
1,512 sq. feet
|
2 baths 3 beds |
show details | |

|
#47
S 15th Ave
Yakima, WA 98902
|
1,620 sq. feet
|
2 baths 4 beds |
show details | |

|
#48
S 15th Ave
Yakima, WA 98902
|
700 sq. feet
|
1 baths 2 beds |
show details | |

|
#49
S 11th Ave
Yakima, WA 98902
|
1,404 sq. feet
|
2 baths 3 beds |
show details | |

|
Check over 1 million property listings on Foreclosure.com!
|
browse all offers | |||

 | West Valley vs. Terrace Heights vs. Selah (4 replies) |
| yakima; where not to live (85 replies) |
| Seattle or Salt Lake City (16 replies) |
| Yakima Bad! LMAO (24 replies) |
| Florida to Washington (10 replies) |
| Unbiased review on yakima, wa. Just visited 9/3/2015 (3 replies) |
Household type by relationship:
Households: 239,746- In family households: 212,086 (40,296 male householders, 18,494 female householders)
41,426 spouses, 81,860 children (76,456 natural, 1,715 adopted, 3,689 stepchildren), 7,772 grandchildren, 3,380 brothers or sisters, 2,349 parents, foster children, 5,388 other relatives, 8,861 non-relatives
- In nonfamily households: 27,660 (10,578 male householders (7,947 living alone)), 11,224 female householders (9,478 living alone)), 5,858 nonrelatives
- In group quarters: 3,485 (2,533 institutionalized population)
44,742 married couples with children.
16,953 single-parent households (4,329 men, 12,624 women).
93.0% of residents of West Valley speak English at home.
4.6% of residents speak Spanish at home (88% speak English very well, 7% speak English well, 5% speak English not well).
1.1% of residents speak other Indo-European language at home (82% speak English very well, 18% speak English well).
1.2% of residents speak Asian or Pacific Island language at home (52% speak English very well, 22% speak English well, 26% speak English not well).
0.1% of residents speak other language at home (100% speak English very well).
Foreign born population: 539 (4.6%)
(64.2% of them are naturalized citizens)
| Here: | 7.4 |
| State: | 6.5 |
| Here: | 6.0 |
| State: | 3.9 |
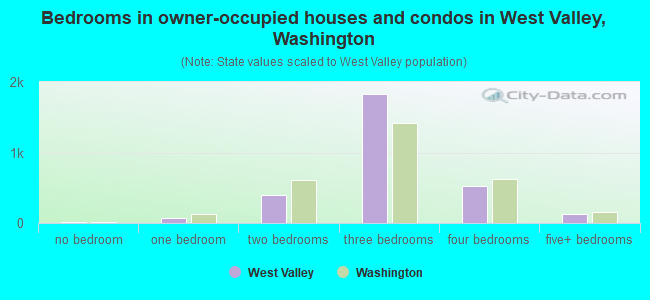
- Bedrooms in owner-occupied houses and condos in West Valley, Washington
- 18no bedroom
- 721 bedroom
- 3942 bedrooms
- 1,8233 bedrooms
- 5224 bedrooms
- 1215+ bedrooms
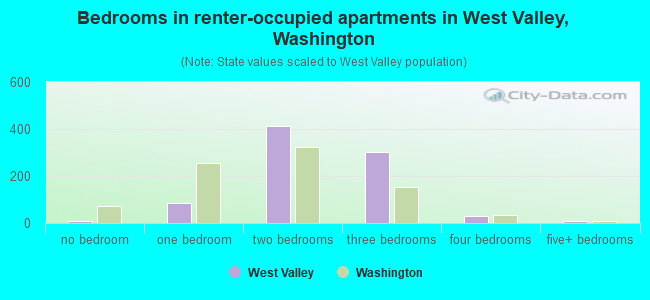
- Bedrooms in renter-occupied apartments in West Valley, Washington
- 8no bedroom
- 861 bedroom
- 4142 bedrooms
- 3023 bedrooms
- 294 bedrooms
- 105+ bedrooms
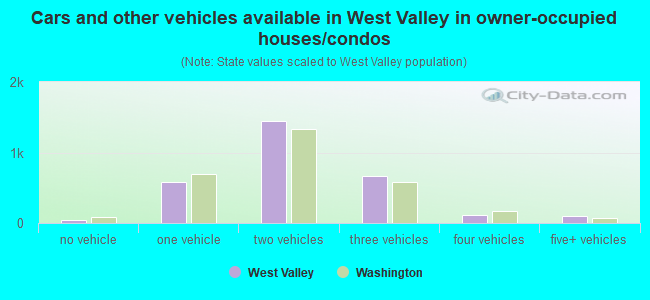
- Cars and other vehicles available in West Valley in owner-occupied houses/condos
- 38no vehicle
- 5751 vehicle
- 1,4502 vehicles
- 6713 vehicles
- 1154 vehicles
- 1015+ vehicles
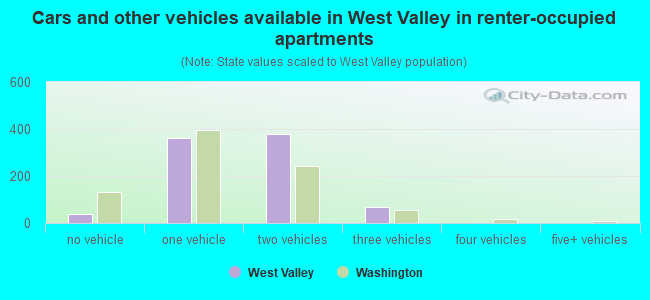
- Cars and other vehicles available in West Valley in renter-occupied apartments
- 37no vehicle
- 3621 vehicle
- 3802 vehicles
- 703 vehicles
- 04 vehicles
- 05+ vehicles
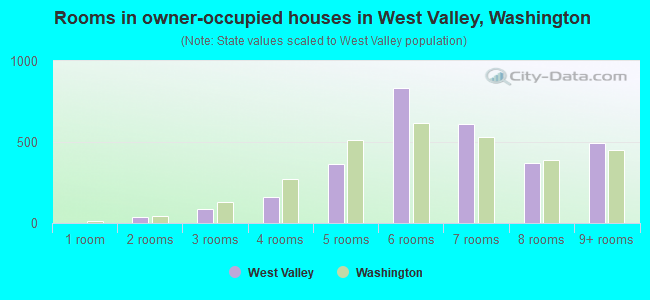
- Rooms in owner-occupied houses in West Valley, Washington
- 01 room
- 362 rooms
- 843 rooms
- 1604 rooms
- 3625 rooms
- 8316 rooms
- 6107 rooms
- 3738 rooms
- 4949+ rooms
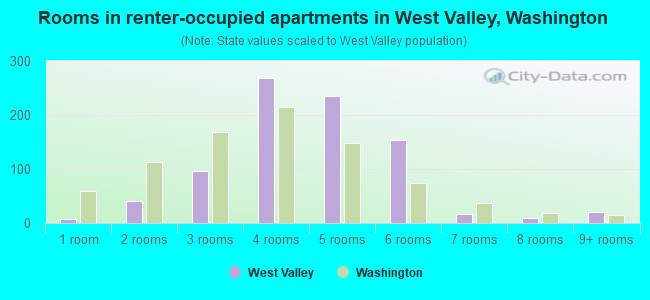
- Rooms in renter-occupied apartments in West Valley, Washington
- 81 room
- 402 rooms
- 973 rooms
- 2694 rooms
- 2365 rooms
- 1536 rooms
- 167 rooms
- 98 rooms
- 219+ rooms
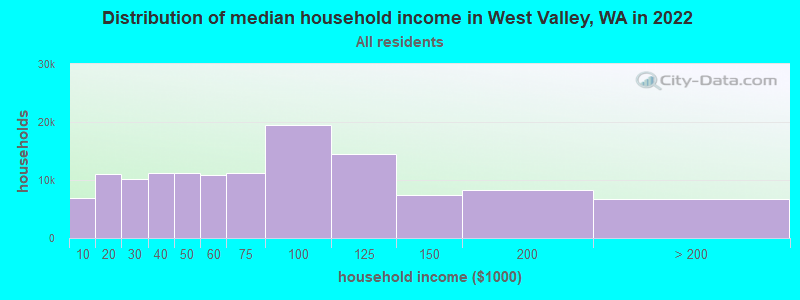
West Valley, WA household income distribution

- 6,852Less than $10,000
- 10,961$10,000 to $19,999
- 10,163$20,000 to $29,999
- 11,213$30,000 to $39,999
- 11,223$40,000 to $49,999
- 10,907$50,000 to $59,999
- 11,160$60,000 to $74,999
- 19,550$75,000 to $99,999
- 14,414$100,000 to $124,999
- 7,340$125,000 to $149,999
- 8,361$150,000 to $199,999
- 6,663$200,000 or more
Percentage of workers working in this county: 98.0%
Number of people working at home: 486 (7.6% of all workers)
Travel time to work (commute)
- Less than 5 minutes: 169
- 5 to 9 minutes: 619
- 10 to 14 minutes: 1,179
- 15 to 19 minutes: 1,474
- 20 to 24 minutes: 829
- 25 to 29 minutes: 180
- 30 to 34 minutes: 160
- 35 to 39 minutes: 32
- 40 to 44 minutes: 64
- 45 to 59 minutes: 121
- 60 to 89 minutes: 94
- 90 or more minutes: 52
Means of transportation to work:
- Drove a car alone: 4,451 (86.9%)
- Carpooled: 484 (9.4%)
- Bicycle: 8 (0.2%)
- Walked: 30 (0.6%)
- Worked at home: 149 (2.9%)
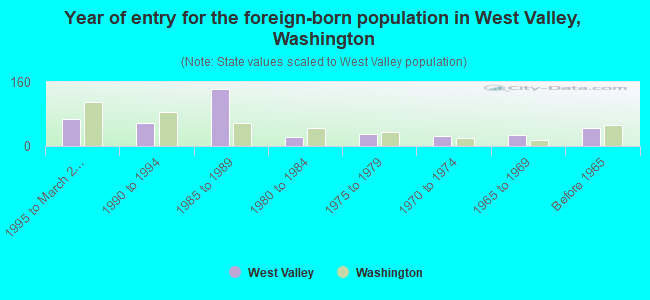
- Year of entry for the foreign-born population in West Valley, Washington
- 671995 to March 2000
- 581990 to 1994
- 1431985 to 1989
- 231980 to 1984
- 301975 to 1979
- 251970 to 1974
- 271965 to 1969
- 46Before 1965
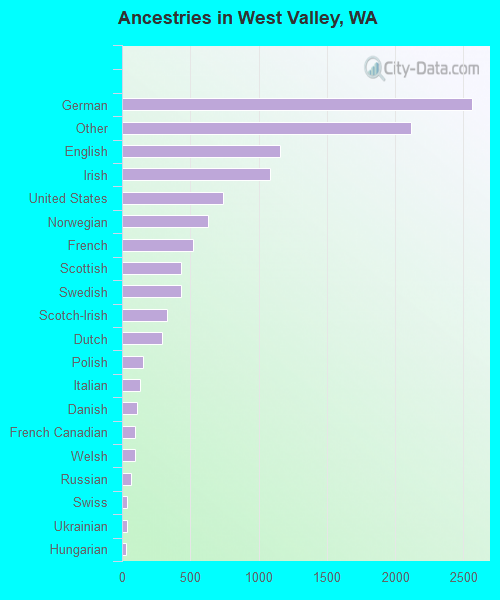
First ancestries reported:
- German: 2,559 (23.0%)
- Other: 2,115 (19.0%)
- English: 1,156 (10.4%)
- Irish: 1,080 (9.7%)
- United States: 739 (6.7%)
- Norwegian: 628 (5.7%)
- French: 522 (4.7%)
- Scottish: 433 (3.9%)
- Swedish: 429 (3.9%)
- Scotch-Irish: 326 (2.9%)
- Dutch: 296 (2.7%)
- Polish: 154 (1.4%)
- Italian: 132 (1.2%)
- Danish: 111 (1.0%)
- French Canadian: 92 (0.8%)
- Welsh: 92 (0.8%)
- Russian: 63 (0.6%)
- Swiss: 39 (0.4%)
- Ukrainian: 37 (0.3%)
- Hungarian: 26 (0.2%)
- Greek: 23 (0.2%)
- Arab: 21 (0.2%)
- Czech: 17 (0.2%)
- Slovak: 10 (0.09%)
- Portuguese: 8 (0.07%)
- Subsaharan African: 4 (0.04%)
Most common places of birth for foreign-born residents (%):
| West Valley: | 24.3% (102) |
| Washington: | 24.1% (148,115) |
| West Valley: | 14.8% (62) |
| Washington: | 7.7% (47,568) |
| West Valley: | 10.5% (44) |
| Washington: | 6.2% (38,172) |
| West Valley: | 10.3% (43) |
| Washington: | 3.3% (20,321) |
| West Valley: | 7.4% (31) |
| Washington: | 3.3% (20,530) |
| West Valley: | 6.9% (29) |
| Washington: | 7.6% (46,733) |
| West Valley: | 4.5% (19) |
| Washington: | 2.4% (14,714) |
| West Valley: | 3.8% (16) |
| Washington: | 3.4% (21,167) |
| West Valley: | 3.3% (14) |
| Washington: | 0.5% (2,889) |
| West Valley: | 2.6% (11) |
| Washington: | 0.3% (1,975) |
| West Valley: | 2.1% (9) |
| Washington: | 2.8% (16,936) |
| West Valley: | 2.1% (9) |
| Washington: | 0.2% (1,259) |
| West Valley: | 1.9% (8) |
| Washington: | 0.4% (2,213) |
| West Valley: | 1.9% (8) |
| Washington: | 0.3% (1,804) |
| West Valley: | 1.7% (7) |
| Washington: | 1.0% (6,393) |
| West Valley: | 1.7% (7) |
| Washington: | 1.0% (6,263) |
Place of birth for U.S.-born residents:
- This state: 6,120
- Other state: 3,339
- Northeast: 219
- Midwest: 983
- South: 625
- West: 1,512
54% of West Valley residents lived in the same house 5 years ago.
Out of people who lived in different houses, 69% lived in this county.
Out of people who lived in different counties, 52% lived in Washington.
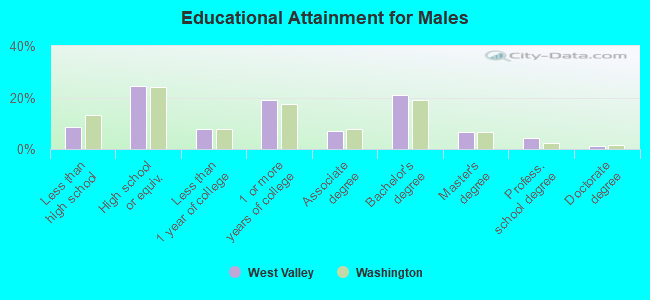
Education attainment for males 25 years and older:
- No schooling: 6
- Nursery to 4th grade: 0
- 5th and 6th grade: 15
- 7th and 8th grade: 36
- 9th grade: 6
- 10th grade: 81
- 11th grade: 39
- 12th grade, no diploma: 73
- High school graduate (or equivalency): 744
- Less than 1 year of college: 230
- Some college more than 1 year, no degree: 575
- Associate degree: 206
- Bachelor's degree: 632
- Master's degree: 204
- Professional school degree: 131
- Doctorate degree: 40
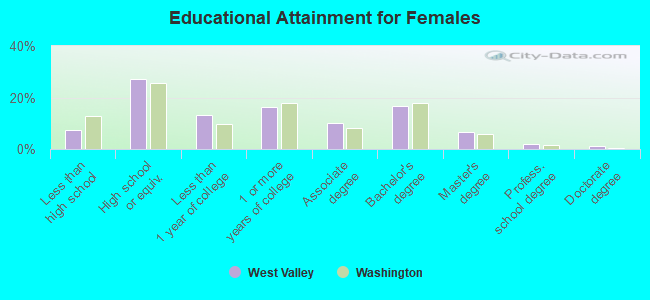
Education attainment for females 25 years and older:
- No schooling: 0
- Nursery to 4th grade: 0
- 5th and 6th grade: 17
- 7th and 8th grade: 34
- 9th grade: 0
- 10th grade: 59
- 11th grade: 65
- 12th grade, no diploma: 84
- High school graduate (or equivalency): 956
- Less than 1 year of college: 462
- Some college more than 1 year, no degree: 570
- Associate degree: 353
- Bachelor's degree: 582
- Master's degree: 234
- Professional school degree: 62
- Doctorate degree: 35
Housing units in structures:
- One, detached: 2,657
- One, attached: 204
- Two: 216
- 3 or 4: 171
- 5 to 9: 78
- 10 to 19: 17
- 50 or more: 79
- Mobile homes: 511
Median worth of mobile homes: $49,745
Housing units lacking complete kitchen facilities: 0.2%
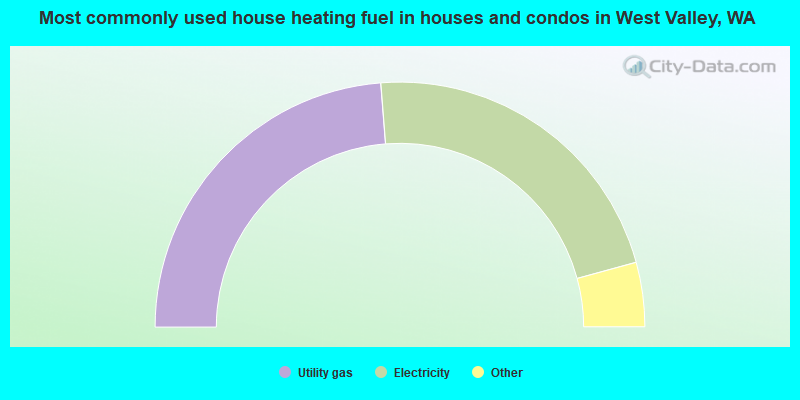
- 47.5%Utility gas
- 44.0%Electricity
- 3.0%Fuel oil, kerosene, etc.
- 2.4%Wood
- 2.0%Bottled, tank, or LP gas
- 0.7%Other fuel
- 0.4%No fuel used
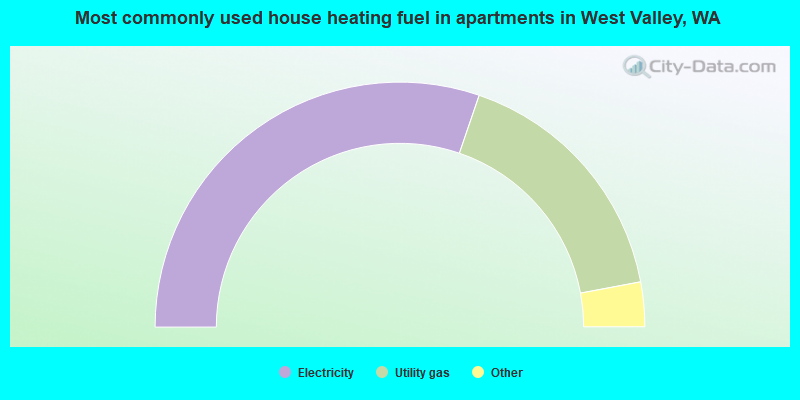
- 60.5%Electricity
- 33.6%Utility gas
- 3.1%Bottled, tank, or LP gas
- 2.2%Wood
- 0.6%Fuel oil, kerosene, etc.
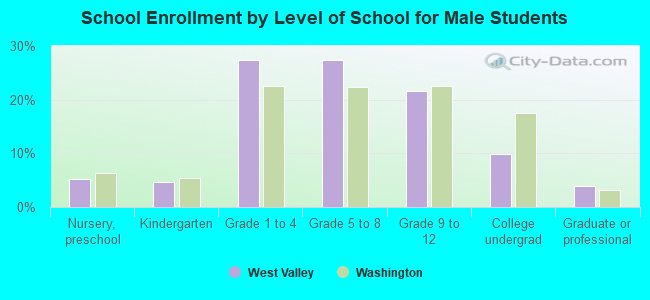
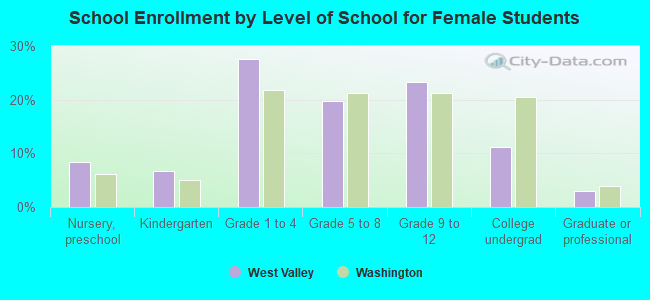
Private vs. public school enrollment:
| Here: | 7.3% |
| Washington: | 9.2% |
| Here: | 6.2% |
| Washington: | 7.0% |
| Here: | 3.1% |
| Washington: | 15.7% |