Westworth Village, TX (Texas) Houses and Residents
| Westworth Village: | $195,026 |
| Texas: | $275,400 |
Total population: 2,496 (Urban population: 2,133, Rural population: 0)
Houses: 855 (782 occupied: 463 owner occupied, 319 renter occupied)
| % of renters here: | 41% |
| State: | 38% |
Housing density: 432 houses/condos per square mile
Median price asked for vacant for-sale houses and condos in 2022 in this county: $307,354.
Median contract rent in 2022: $1,365 (lower quartile is $954, upper quartile is $1,840)
Median rent asked for vacant for-rent units in 2022: $1,529
Median gross rent in Westworth Village, TX in 2022: $1,663
Housing units in Westworth Village with a mortgage: 220 (10 second mortgage, 6 home equity loan, 2 both second mortgage and home equity loan)
Houses without a mortgage: 231
Compare current foreclosures near Westworth Village, TX:
| Photo | Address | Area | Beds / Baths | Price | Details |
|---|---|---|---|---|---|

|
#1
Squaw Creek Rd
Weatherford, TX 76087
|
3,044 sq. feet
|
3 baths 4 beds |
$551,950
|
show details |

|
#2
Bay Club Dr
Arlington, TX 76013
|
4,020 sq. feet
|
4 baths 4 beds |
$780,000
|
show details |

|
#3
Villa Milano Dr
Fort Worth, TX 76126
|
- sq. feet
|
4 baths 4 beds |
$999,900
|
show details |

|
#4
Cassidy Ln
Keller, TX 76244
|
2,817 sq. feet
|
3 baths 4 beds |
show details | |

|
#5
W 7th St Apt 2512
Fort Worth, TX 76107
|
1,263 sq. feet
|
2 baths 1 beds |
show details | |

|
#6
Apalachee Trl
Fort Worth, TX 76179
|
2,564 sq. feet
|
2 baths 3 beds |
show details | |

|
#7
Plainfield Dr
Fort Worth, TX 76108
|
1,071 sq. feet
|
2 baths 3 beds |
show details | |

|
#8
Nottingham Blvd
Fort Worth, TX 76112
|
1,658 sq. feet
|
2 baths 3 beds |
show details | |

|
#9
Evergreen Dr
Keller, TX 76244
|
2,144 sq. feet
|
2 baths 3 beds |
show details | |

|
#10
Montclair Dr
Fort Worth, TX 76103
|
1,428 sq. feet
|
3 baths 4 beds |
show details |
| Photo | Address | Area | Beds / Baths | Price | Details |
|---|---|---|---|---|---|

|
#11
Montreal Cir
Haltom City, TX 76117
|
1,487 sq. feet
|
1 baths 3 beds |
show details | |

|
#12
N Park Dr
Fort Worth, TX 76148
|
1,513 sq. feet
|
2 baths 3 beds |
show details | |

|
#13
Bursey Rd
North Richland Hills, TX 76182
|
2,696 sq. feet
|
3 baths 4 beds |
show details | |

|
#14
Buck Mountain Pass
Fort Worth, TX 76179
|
1,316 sq. feet
|
2 baths 3 beds |
show details | |

|
#15
Sarah Brooks Dr
Keller, TX 76248
|
2,360 sq. feet
|
2 baths 4 beds |
show details | |

|
#16
Springdale Ct
Fort Worth, TX 76148
|
2,002 sq. feet
|
2 baths 3 beds |
show details | |

|
#17
S Dover Ter
Fort Worth, TX 76132
|
2,497 sq. feet
|
2 baths 3 beds |
show details | |

|
#18
Melbourn St
Haltom City, TX 76117
|
968 sq. feet
|
1 baths 2 beds |
show details | |

|
#19
Shady Bend Dr
Kennedale, TX 76060
|
3,520 sq. feet
|
3 baths 4 beds |
show details | |

|
#20
Chimney Hill Dr
Arlington, TX 76012
|
3,206 sq. feet
|
3 baths 4 beds |
show details |
| Photo | Address | Area | Beds / Baths | Price | Details |
|---|---|---|---|---|---|

|
#21
Big Horn Way
Fort Worth, TX 76137
|
3,237 sq. feet
|
3 baths 5 beds |
show details | |

|
#22
Chippewa Trl
Fort Worth, TX 76135
|
1,176 sq. feet
|
1 baths 2 beds |
show details | |

|
#23
Leather Strap Dr
Haslet, TX 76052
|
3,021 sq. feet
|
2 baths 4 beds |
show details | |

|
#24
Saddle Trl
Fort Worth, TX 76116
|
1,797 sq. feet
|
2 baths 3 beds |
show details | |

|
#25
Mystic River Trl
Fort Worth, TX 76131
|
1,810 sq. feet
|
2 baths 4 beds |
show details | |

|
#26
Andalusia Trl
Arlington, TX 76017
|
1,988 sq. feet
|
2 baths 3 beds |
show details | |

|
#27
Shallow Creek Dr
Fort Worth, TX 76179
|
1,736 sq. feet
|
2 baths 3 beds |
show details | |

|
#28
Sunday St
Haltom City, TX 76117
|
1,160 sq. feet
|
1 baths 3 beds |
show details | |

|
#29
Haywood Dr
Fort Worth, TX 76126
|
1,911 sq. feet
|
2 baths 4 beds |
show details | |

|
#30
Norris Valley Dr
Fort Worth, TX 76135
|
1,032 sq. feet
|
2 baths 3 beds |
show details |
| Photo | Address | Area | Beds / Baths | Price | Details |
|---|---|---|---|---|---|

|
#31
Greenacres Dr
North Richland Hills, TX 76182
|
1,900 sq. feet
|
2 baths 3 beds |
show details | |

|
#32
Lilac St
Fort Worth, TX 76110
|
2,000 sq. feet
|
3 baths 3 beds |
show details | |

|
#33
Stone Lake Dr
Fort Worth, TX 76179
|
1,370 sq. feet
|
2 baths 3 beds |
show details | |

|
#34
Bridal Trl
Fort Worth, TX 76179
|
2,600 sq. feet
|
2 baths 4 beds |
show details | |

|
#35
Gold Seeker Way
Haslet, TX 76052
|
1,932 sq. feet
|
2 baths 4 beds |
show details | |

|
#36
Smilax Ave
Fort Worth, TX 76111
|
1,230 sq. feet
|
1 baths 3 beds |
show details | |

|
#37
Lowe St
Fort Worth, TX 76110
|
1,348 sq. feet
|
2 baths 3 beds |
show details | |

|
#38
Ridge Dr
Arlington, TX 76016
|
1,698 sq. feet
|
2 baths 3 beds |
show details | |

|
#39
Barkridge Trl
Burleson, TX 76028
|
2,032 sq. feet
|
2 baths 3 beds |
show details | |

|
#40
Darla Dr
Fort Worth, TX 76132
|
1,192 sq. feet
|
2 baths 3 beds |
show details |
| Photo | Address | Area | Beds / Baths | Price | Details |
|---|---|---|---|---|---|

|
#41
New Harbor Ln
Fort Worth, TX 76179
|
1,264 sq. feet
|
2 baths 3 beds |
show details | |

|
#42
Nighthawk Rd
Fort Worth, TX 76108
|
2,686 sq. feet
|
2 baths 4 beds |
show details | |

|
#43
Mayberry Ln
Fort Worth, TX 76123
|
3,468 sq. feet
|
3 baths 5 beds |
show details | |

|
#44
Dillon Cir
Fort Worth, TX 76137
|
3,485 sq. feet
|
2 baths 4 beds |
show details | |

|
#45
Chimney Ct
Arlington, TX 76016
|
2,033 sq. feet
|
2 baths 3 beds |
show details | |

|
#46
Gill St
Fort Worth, TX 76131
|
1,120 sq. feet
|
1 baths 3 beds |
show details | |

|
#47
Ridgehill Ct
Burleson, TX 76028
|
2,044 sq. feet
|
2 baths 3 beds |
show details | |

|
#48
S Lake St
Fort Worth, TX 76104
|
1,421 sq. feet
|
1 baths 2 beds |
show details | |

|
#49
Bootes Drive
Haslet, TX 76052
|
- sq. feet
|
2 baths 4 beds |
show details | |

|
Check over 1 million property listings on Foreclosure.com!
|
browse all offers | |||


 | Apartments in modern safe areas (8 replies) |
| Is South Lake worth the price premium? (97 replies) |
| Purchasing second home in Fort Worth...where to start??? (6 replies) |
| Apartments in Fort Worth (9 replies) |
| How to spend $250K in Fort Worth (west side?) (15 replies) |
| Any areas of FW that you'd recommend? That you'd avoid? (48 replies) |

Household type by relationship:
Households: 1,788,400- In family households: 1,536,808 (312,748 male householders, 142,285 female householders)
329,737 spouses, 579,348 children (536,537 natural, 11,643 adopted, 31,168 stepchildren), 46,562 grandchildren, 22,396 brothers or sisters, 18,327 parents, foster children, 30,603 other relatives, 40,309 non-relatives
- In nonfamily households: 251,592 (98,137 male householders (75,854 living alone)), 103,964 female householders (87,705 living alone)), 49,491 nonrelatives
- In group quarters: 20,634 (12,393 institutionalized population)
275,554 married couples with children.
88,485 single-parent households (18,988 men, 69,497 women).
86.7% of residents of Westworth Village speak English at home.
11.7% of residents speak Spanish at home (69% speak English very well, 16% speak English well, 9% speak English not well, 6% don't speak English at all).
1.2% of residents speak other Indo-European language at home (75% speak English very well, 12% speak English well, 12% speak English not well).
0.4% of residents speak Asian or Pacific Island language at home (57% speak English very well, 43% speak English well).
0.1% of residents speak other language at home (100% speak English very well).
Foreign born population: 233 (7.3%)
(72.1% of them are naturalized citizens)
| Here: | 5.3 |
| State: | 6.3 |
| Here: | 6.7 |
| State: | 4.0 |

- Bedrooms in owner-occupied houses and condos in Westworth Village, Texas
- 0no bedroom
- 31 bedroom
- 862 bedrooms
- 3333 bedrooms
- 394 bedrooms
- 25+ bedrooms

- Bedrooms in renter-occupied apartments in Westworth Village, Texas
- 8no bedroom
- 271 bedroom
- 992 bedrooms
- 1663 bedrooms
- 194 bedrooms
- 05+ bedrooms

- Cars and other vehicles available in Westworth Village in owner-occupied houses/condos
- 19no vehicle
- 1681 vehicle
- 1902 vehicles
- 613 vehicles
- 184 vehicles
- 75+ vehicles

- Cars and other vehicles available in Westworth Village in renter-occupied apartments
- 7no vehicle
- 1271 vehicle
- 1642 vehicles
- 173 vehicles
- 44 vehicles
- 05+ vehicles

- Rooms in owner-occupied houses in Westworth Village, Texas
- 01 room
- 02 rooms
- 33 rooms
- 314 rooms
- 1595 rooms
- 1476 rooms
- 837 rooms
- 328 rooms
- 89+ rooms

- Rooms in renter-occupied apartments in Westworth Village, Texas
- 01 room
- 142 rooms
- 253 rooms
- 484 rooms
- 755 rooms
- 996 rooms
- 467 rooms
- 58 rooms
- 79+ rooms


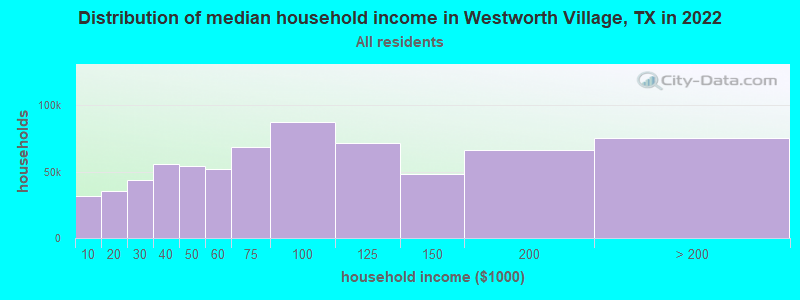
Westworth Village, TX household income distribution

- 31,873Less than $10,000
- 35,288$10,000 to $19,999
- 43,407$20,000 to $29,999
- 55,872$30,000 to $39,999
- 54,074$40,000 to $49,999
- 51,814$50,000 to $59,999
- 68,771$60,000 to $74,999
- 87,523$75,000 to $99,999
- 71,469$100,000 to $124,999
- 48,125$125,000 to $149,999
- 66,644$150,000 to $199,999
- 75,308$200,000 or more
Percentage of workers working in this county: 95.6%
Number of people working at home: 237 (15.7% of all workers)
Travel time to work (commute)
- Less than 5 minutes: 19
- 5 to 9 minutes: 132
- 10 to 14 minutes: 191
- 15 to 19 minutes: 161
- 20 to 24 minutes: 134
- 25 to 29 minutes: 42
- 30 to 34 minutes: 113
- 35 to 39 minutes: 13
- 40 to 44 minutes: 34
- 45 to 59 minutes: 72
- 60 to 89 minutes: 17
- 90 or more minutes: 22
Means of transportation to work:
- Drove a car alone: 825 (84.9%)
- Carpooled: 105 (10.8%)
- Bicycle: 1 (0.1%)
- Walked: 7 (0.7%)
- Other means: 12 (1.2%)
- Worked at home: 22 (2.3%)


- Year of entry for the foreign-born population in Westworth Village, Texas
- 321995 to March 2000
- 171990 to 1994
- 101985 to 1989
- 131980 to 1984
- 61975 to 1979
- 121970 to 1974
- 01965 to 1969
- 32Before 1965

First ancestries reported:
- Other: 715 (33.2%)
- English: 290 (13.5%)
- German: 278 (12.9%)
- Irish: 266 (12.3%)
- United States: 206 (9.6%)
- French: 74 (3.4%)
- Italian: 57 (2.6%)
- Scotch-Irish: 52 (2.4%)
- Polish: 38 (1.8%)
- Scottish: 38 (1.8%)
- Dutch: 29 (1.3%)
- French Canadian: 20 (0.9%)
- Slovak: 18 (0.8%)
- West Indian: 10 (0.5%)
- Norwegian: 9 (0.4%)
- Swedish: 9 (0.4%)
- Welsh: 8 (0.4%)
- Danish: 7 (0.3%)
- Russian: 7 (0.3%)
- Czech: 4 (0.2%)
- Greek: 4 (0.2%)
- Hungarian: 4 (0.2%)
- Subsaharan African: 4 (0.2%)
- Ukrainian: 4 (0.2%)
- Arab: 2 (0.09%)
- Lithuanian: 2 (0.09%)
Most common places of birth for foreign-born residents (%):
| Westworth Village: | 65.6% (80) |
| Texas: | 64.8% (1,879,369) |
| Westworth Village: | 4.9% (6) |
| Texas: | 1.2% (36,176) |
| Westworth Village: | 4.9% (6) |
| Texas: | 1.4% (39,249) |
| Westworth Village: | 4.1% (5) |
| Texas: | 0.5% (13,070) |
| Westworth Village: | 3.3% (4) |
| Texas: | 0.0% (322) |
| Westworth Village: | 2.5% (3) |
| Texas: | 2.7% (78,388) |
| Westworth Village: | 2.5% (3) |
| Texas: | 0.5% (15,581) |
| Westworth Village: | 1.6% (2) |
| Texas: | 0.2% (4,774) |
| Westworth Village: | 1.6% (2) |
| Texas: | 1.3% (38,813) |
| Westworth Village: | 1.6% (2) |
| Texas: | 1.2% (35,986) |
| Westworth Village: | 1.6% (2) |
| Texas: | 1.6% (45,907) |
| Westworth Village: | 1.6% (2) |
| Texas: | 0.3% (7,904) |
| Westworth Village: | 1.6% (2) |
| Texas: | 0.1% (3,432) |
| Westworth Village: | 1.6% (2) |
| Texas: | 0.3% (9,583) |
Place of birth for U.S.-born residents:
- This state: 1,189
- Other state: 784
- Northeast: 86
- Midwest: 195
- South: 317
- West: 186
48% of Westworth Village residents lived in the same house 5 years ago.
Out of people who lived in different houses, 58% lived in this county.
Out of people who lived in different counties, 45% lived in Texas.
Education attainment for males 25 years and older:
- No schooling: 2
- Nursery to 4th grade: 0
- 5th and 6th grade: 9
- 7th and 8th grade: 24
- 9th grade: 22
- 10th grade: 4
- 11th grade: 21
- 12th grade, no diploma: 10
- High school graduate (or equivalency): 236
- Less than 1 year of college: 79
- Some college more than 1 year, no degree: 151
- Associate degree: 57
- Bachelor's degree: 50
- Master's degree: 4
- Professional school degree: 5
- Doctorate degree: 0

Education attainment for females 25 years and older:
- No schooling: 2
- Nursery to 4th grade: 2
- 5th and 6th grade: 14
- 7th and 8th grade: 12
- 9th grade: 8
- 10th grade: 27
- 11th grade: 34
- 12th grade, no diploma: 34
- High school graduate (or equivalency): 270
- Less than 1 year of college: 97
- Some college more than 1 year, no degree: 85
- Associate degree: 44
- Bachelor's degree: 55
- Master's degree: 8
- Professional school degree: 7
- Doctorate degree: 0


Housing units in structures:
- One, detached: 832
- One, attached: 14
- Two: 7
- 50 or more: 2

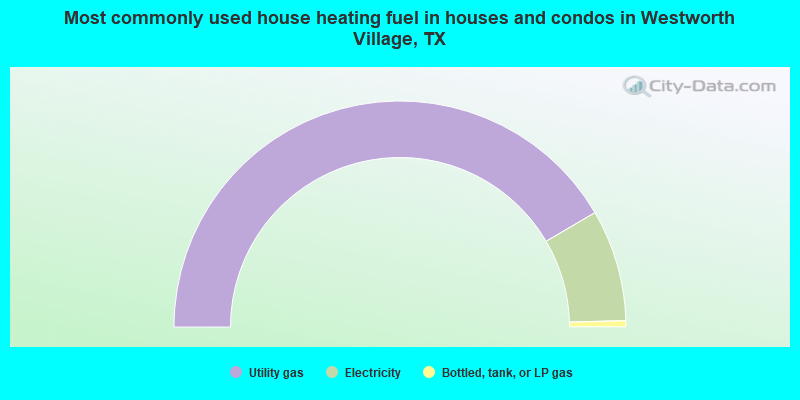
- 83.2%Utility gas
- 16.0%Electricity
- 0.9%Bottled, tank, or LP gas
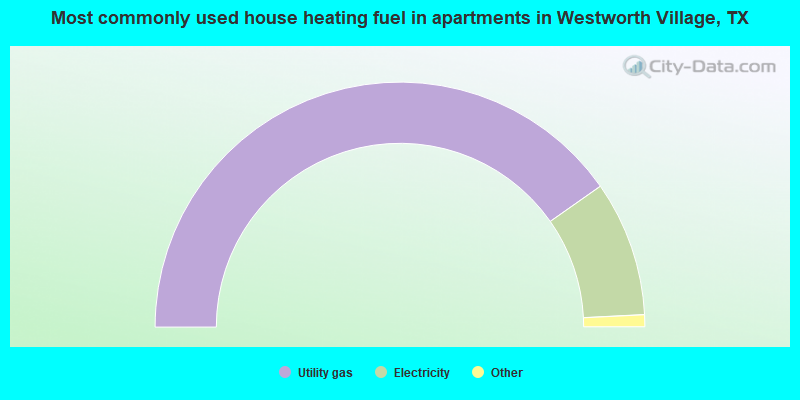
- 80.6%Utility gas
- 17.9%Electricity
- 0.9%Bottled, tank, or LP gas
- 0.6%Wood
Private vs. public school enrollment:
| Here: | 8.8% |
| Texas: | 6.8% |
| Here: | 7.1% |
| Texas: | 6.2% |
| Here: | 21.4% |
| Texas: | 15.4% |


