White Plains, NY (New York) Houses and Residents
Estimated median house or condo value in 2022: $628,442 (it was $273,000 in 2000 )
White Plains:
$628,442New York:
$400,400
Lower value quartile - upper value quartile: $356,738 - $883,140Mean price in 2022: Detached houses: $950,799 Here:
$950,799State:
$476,719
Townhouses or other attached units: $1,065,402 Here:
$1,065,402State:
$699,270
In 2-unit structures: $713,659 Here:
$713,659State:
$713,077
In 3-to-4-unit structures: $384,481 Here:
$384,481State:
$764,568
In 5-or-more-unit structures: $503,851 Here:
$503,851State:
$912,009
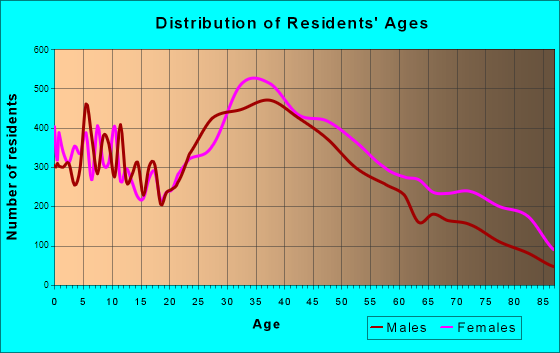
Total population: 58,035 (Urban population: 53,077, Rural population: 0)
Houses: 26,313 (24,379 occupied: 13,002 owner occupied, 11,436 renter occupied )
% of renters here:
47%State:
46%
Housing density: 2,685 houses/condos per square mile
Median price asked for vacant for-sale houses and condos in 2022: $654,885.
Median contract rent in 2022: $1,852 (lower quartile is $1,248, upper quartile is over $2,000)
Median rent asked for vacant for-rent units in 2022: $4,899
Median gross rent in White Plains, NY in 2022: over $2,000
Housing units in White Plains with a mortgage: 7,479 (926 second mortgage, 0 home equity loan, 827 both second mortgage and home equity loan )Houses without a mortgage: 356
Median household income for houses/condos with a mortgage: $156,062
Median household income for apartments without a mortgage: $118,127
Median monthly housing costs: $2,115
Data:
Median house or condo value ($)
Median house or condo value ($ change since 2000)
Median house or condo value ($) - White
Median house or condo value ($) - Black or African American
Median house or condo value ($) - Asian
Median house or condo value ($) - Hispanic or Latino
Median house or condo value ($) - American Indian and Alaska Native
Median house or condo value ($) - Multirace
Median house or condo value ($) - Other Race
Median price asked for mobile homes ($)
Household density (households per square mile)
Mean house or condo value by units in structure - 1, detached ($)
Mean house or condo value by units in structure - 1, attached ($)
Mean house or condo value by units in structure - 2 ($)
Mean house or condo value by units in structure by units in structure - 3 or 4 ($)
Mean house or condo value by units in structure - 5 or more ($)
Mean house or condo value by units in structure - Boat, RV, van, etc. ($)
Mean house or condo value by units in structure - Mobile home ($)
Median contract rent ($)
Median contract rent - Lower quartile ($)
Median contract rent - Upper quartile ($)
Median gross rent ($)
Urban houses (%)
Rural houses (%)
Houses occupied (%)
Houses occupied (% change since 2000)
Houses owner occupied (%)
Houses owner occupied (% change since 2000)
Houses renter occupied (%)
Houses renter occupied (% change since 2000)
Vacant housing units - For rent (%)
Vacant housing units - For rent (% change since 2000)
Vacant housing units - For sale only (%)
Vacant housing units - For sale only (% change since 2000)
Vacant housing units - Rented or sold, not occupied (%)
Vacant housing units - Rented or sold, not occupied (% change since 2000)
Vacant housing units - For seasonal, recreational, or occasional use (%)
Vacant housing units - For seasonal, recreational, or occasional use (% change since 2000)
Vacant housing units - For migrant workers (%)
Vacant housing units - For migrant workers (% change since 2000)
Vacant housing units - Other vacant (%)
Vacant housing units - Other vacant (% change since 2000)
Median monthly housing costs ($)
Median household income for houses/condos with a mortgage ($)
Median household income for houses/condos without a mortgage ($)
Median household income ($)
Median household income ($) - White
Median household income ($) - Black or African American
Median household income ($) - Asian
Median household income ($) - Hispanic or Latino
Median household income ($) - American Indian and Alaska Native
Median household income ($) - Multirace
Median household income ($) - Other Race
Mortgage status - with mortgage (%)
Mortgage status - with second mortgage (%)
Mortgage status - with home equity loan (%)
Mortgage status - with both second mortgage and home equity loan (%)
Mortgage status - without a mortgage (%)
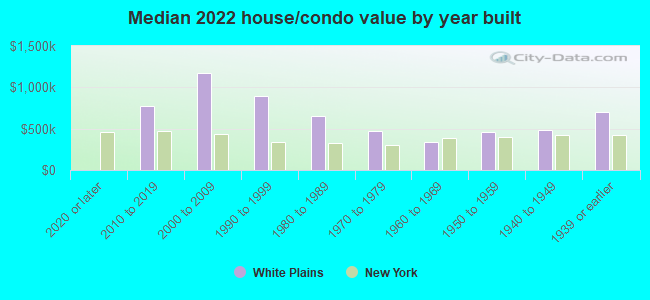
Median year house/condo built
Median year apartment built
Household type by relationship - Male householder living alone (%)
Household type by relationship - Male householder not living alone (%)
Household type by relationship - Female householder living alone (%)
Household type by relationship - Female householder not living alone (%)
Household type by relationship - Opposite-Sex spouse (%)
Household type by relationship - Same-Sex spouse (%)
Household type by relationship - Opposite-Sex unmarried partner (%)
Household type by relationship - Same-Sex unmarried partner (%)
Household type by relationship - In group quarters (%)
Size of family households - 2-person household (%)
Size of family households - 3-person household (%)
Size of family households - 4-person household (%)
Size of family households - 5-person household (%)
Size of family households - 6-person household (%)
Size of family households - 7-or-more-person household (%)
Size of nonfamily households - 1-person household (%)
Size of nonfamily households - 2-person household (%)
Size of nonfamily households - 3-person household (%)
Size of nonfamily households - 4-person household (%)
Size of nonfamily households - 5-person household (%)
Size of nonfamily households - 6-person household (%)
Size of nonfamily households - 7-or-moreperson household (%)
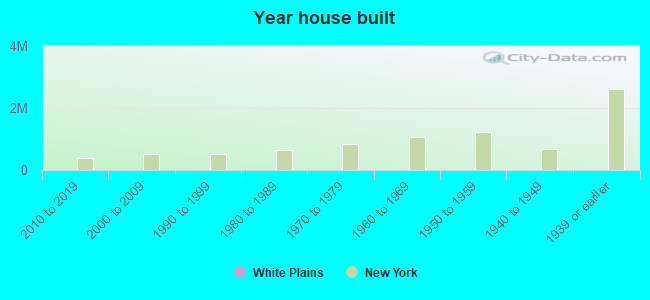
Year house built - Built 2010 or later (%)
Year house built - Built 2000 to 2009 (%)
Year house built - Built 1990 to 1999 (%)
Year house built - Built 1980 to 1989 (%)
Year house built - Built 1970 to 1979 (%)
Year house built - Built 1960 to 1969 (%)
Year house built - Built 1950 to 1959 (%)
Year house built - Built 1940 to 1949 (%)
Year house built - Built 1939 or earlier (%)
Median number of rooms in houses and condos
Median number of rooms in apartments
Median number of bedrooms in owner occupied houses
Mean number of bedrooms in owner occupied houses
Median number of bedrooms in renter occupied houses
Mean number of bedrooms in renter occupied houses
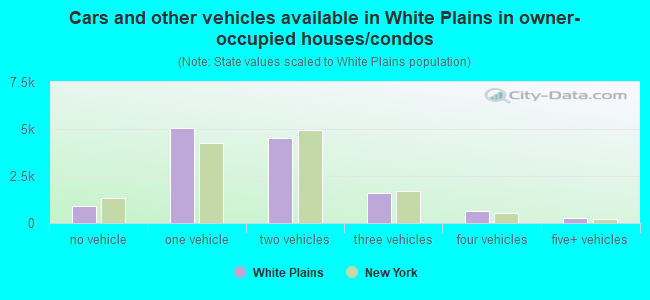
Median number of vehichles in owner occupied houses
Mean number of vehichles in owner occupied houses
Median number of vehichles in renter occupied houses
Mean number of vehichles in renter occupied houses
Rooms in owner-occupied houses - 1 room (%)
Rooms in owner-occupied houses - 2 rooms (%)
Rooms in owner-occupied houses - 3 rooms (%)
Rooms in owner-occupied houses - 4 rooms (%)
Rooms in owner-occupied houses - 5 rooms (%)
Rooms in owner-occupied houses - 6 rooms (%)
Rooms in owner-occupied houses - 7 rooms (%)
Rooms in owner-occupied houses - 8 rooms (%)
Rooms in owner-occupied houses - 9+ rooms (%)
Rooms in renter-occupied houses - 1 room (%)
Rooms in renter-occupied houses - 2 rooms (%)
Rooms in renter-occupied houses - 3 rooms (%)
Rooms in renter-occupied houses - 4 rooms (%)
Rooms in renter-occupied houses - 5 rooms (%)
Rooms in renter-occupied houses - 6 rooms (%)
Rooms in renter-occupied houses - 7 rooms (%)
Rooms in renter-occupied houses - 8 rooms (%)
Rooms in renter-occupied houses - 9+ rooms (%)
Bedrooms in owner-occupied houses - no bedrooms (%)
Bedrooms in owner-occupied houses - 1 bedroom (%)
Bedrooms in owner-occupied houses - 2 bedrooms (%)
Bedrooms in owner-occupied houses - 3 bedrooms (%)
Bedrooms in owner-occupied houses - 4 bedrooms (%)
Bedrooms in owner-occupied houses - 5+ bedrooms (%)
Bedrooms in renter-occupied houses - no bedrooms (%)
Bedrooms in renter-occupied houses - 1 bedroom (%)
Bedrooms in renter-occupied houses - 2 bedrooms (%)
Bedrooms in renter-occupied houses - 3 bedrooms (%)
Bedrooms in renter-occupied houses - 4 bedrooms (%)
Bedrooms in renter-occupied houses - 5+ bedrooms (%)
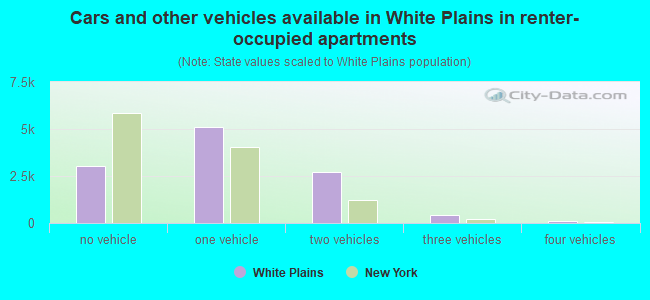
Vehicles available in owner-occupied houses - no vehicle available (%)
Vehicles available in owner-occupied houses - 1 vehicle available(%)
Vehicles available in owner-occupied houses - 2 Vehicles available (%)
Vehicles available in owner-occupied houses - 3 Vehicles available (%)
Vehicles available in owner-occupied houses - 4 Vehicles available (%)
Vehicles available in owner-occupied houses - 5+ Vehicles available (%)
Vehicles available in renter-occupied houses - no vehicle available (%)
Vehicles available in renter-occupied houses - 1 vehicle available (%)
Vehicles available in renter-occupied houses - 2 Vehicles available (%)
Vehicles available in renter-occupied houses - 3 Vehicles available (%)
Vehicles available in renter-occupied houses - 4 Vehicles available (%)
Vehicles available in renter-occupied houses - 5+ Vehicles available (%)
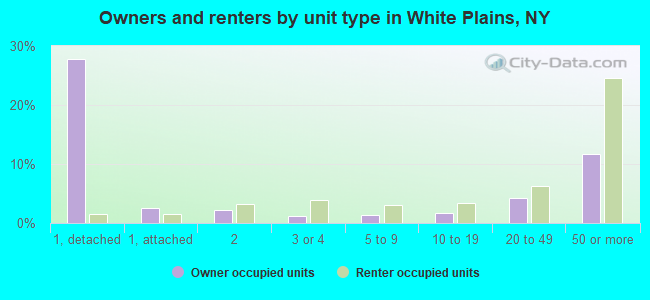
Housing units in structures - 1, detached (%)
Housing units in structures - 1, attached (%)
Housing units in structures - 2 (%)
Housing units in structures - 3 or 4 (%)
Housing units in structures - 5 to 9 (%)
Housing units in structures - 10 to 19 (%)
Housing units in structures - 20 to 49 (%)
Housing units in structures - 50 or more (%)
Housing units in structures - Mobile home (%)
Housing units in structures - Boat, RV, van, etc. (%)
Housing units in structures - Owners - 1, detached (%)
Housing units in structures - Owners - 1, attached (%)
Housing units in structures - Owners - 2 (%)
Housing units in structures - Owners - 3 or 4 (%)
Housing units in structures - Owners - 5 to 9 (%)
Housing units in structures - Owners - 10 to 19 (%)
Housing units in structures - Owners - 20 to 49 (%)
Housing units in structures - Owners - 50 or more (%)
Housing units in structures - Owners - Mobile home (%)
Housing units in structures - Owners - Boat, RV, van, etc. (%)
Housing units in structures - Renters - 1, detached (%)
Housing units in structures - Renters - 1, attached (%)
Housing units in structures - Renters - 2 (%)
Housing units in structures - Renters - 3 or 4 (%)
Housing units in structures - Renters - 5 to 9 (%)
Housing units in structures - Renters - 10 to 19 (%)
Housing units in structures - Renters - 20 to 49 (%)
Housing units in structures - Renters - 50 or more (%)
Housing units in structures - Renters - Mobile home (%)
Housing units in structures - Renters - Boat, RV, van, etc. (%)
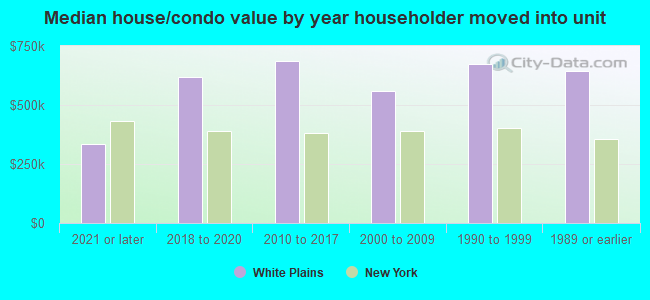
House/condo owner moved in on average (years ago)
Renter moved in on average (years ago)
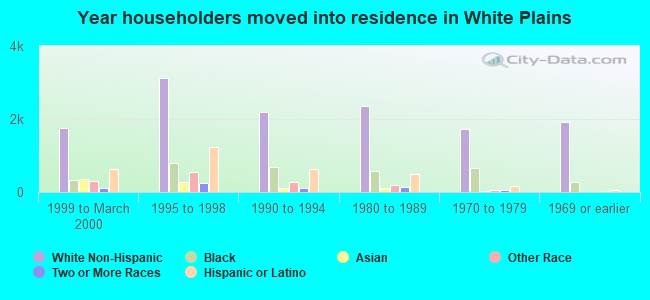
Year householder moved into unit - Moved in 1999 to March 2000 (%)
Year householder moved into unit - Moved in 1999 to March 2000 (%) - White
Year householder moved into unit - Moved in 1999 to March 2000 (%) - Black or African American
Year householder moved into unit - Moved in 1999 to March 2000 (%) - Asian
Year householder moved into unit - Moved in 1999 to March 2000 (%) - Hispanic or Latino
Year householder moved into unit - Moved in 1999 to March 2000 (%) - American Indian and Alaska Native
Year householder moved into unit - Moved in 1999 to March 2000 (%) - Multirace
Year householder moved into unit - Moved in 1999 to March 2000 (%) - Other Race
Year householder moved into unit - Moved in 1995 to 1998 (%)
Year householder moved into unit - Moved in 1995 to 1998 (%) - White
Year householder moved into unit - Moved in 1995 to 1998 (%) - Black or African American
Year householder moved into unit - Moved in 1995 to 1998 (%) - Asian
Year householder moved into unit - Moved in 1995 to 1998 (%) - Hispanic or Latino
Year householder moved into unit - Moved in 1995 to 1998 (%) - American Indian and Alaska Native
Year householder moved into unit - Moved in 1995 to 1998 (%) - Multirace
Year householder moved into unit - Moved in 1995 to 1998 (%) - Other Race
Year householder moved into unit - Moved in 1990 to 1994 (%)
Year householder moved into unit - Moved in 1990 to 1994 (%) - White
Year householder moved into unit - Moved in 1990 to 1994 (%) - Black or African American
Year householder moved into unit - Moved in 1990 to 1994 (%) - Asian
Year householder moved into unit - Moved in 1990 to 1994 (%) - Hispanic or Latino
Year householder moved into unit - Moved in 1990 to 1994 (%) - American Indian and Alaska Native
Year householder moved into unit - Moved in 1990 to 1994 (%) - Multirace
Year householder moved into unit - Moved in 1990 to 1994 (%) - Other Race
Year householder moved into unit - Moved in 1980 to 1989 (%)
Year householder moved into unit - Moved in 1980 to 1989 (%) - White
Year householder moved into unit - Moved in 1980 to 1989 (%) - Black or African American
Year householder moved into unit - Moved in 1980 to 1989 (%) - Asian
Year householder moved into unit - Moved in 1980 to 1989 (%) - Hispanic or Latino
Year householder moved into unit - Moved in 1980 to 1989 (%) - American Indian and Alaska Native
Year householder moved into unit - Moved in 1980 to 1989 (%) - Multirace
Year householder moved into unit - Moved in 1980 to 1989 (%) - Other Race
Year householder moved into unit - Moved in 1970 to 1979 (%)
Year householder moved into unit - Moved in 1970 to 1979 (%) - White
Year householder moved into unit - Moved in 1970 to 1979 (%) - Black or African American
Year householder moved into unit - Moved in 1970 to 1979 (%) - Asian
Year householder moved into unit - Moved in 1970 to 1979 (%) - Hispanic or Latino
Year householder moved into unit - Moved in 1970 to 1979 (%) - American Indian and Alaska Native
Year householder moved into unit - Moved in 1970 to 1979 (%) - Multirace
Year householder moved into unit - Moved in 1970 to 1979 (%) - Other Race
Year householder moved into unit - Moved in 1969 or earlier (%)
Year householder moved into unit - Moved in 1969 or earlier (%) - White
Year householder moved into unit - Moved in 1969 or earlier (%) - Black or African American
Year householder moved into unit - Moved in 1969 or earlier (%) - Asian
Year householder moved into unit - Moved in 1969 or earlier (%) - Hispanic or Latino
Year householder moved into unit - Moved in 1969 or earlier (%) - American Indian and Alaska Native
Year householder moved into unit - Moved in 1969 or earlier (%) - Multirace
Year householder moved into unit - Moved in 1969 or earlier (%) - Other Race
Housing units lacking complete plumbing facilities (%)
Housing units lacking complete kitchen facilities (%)
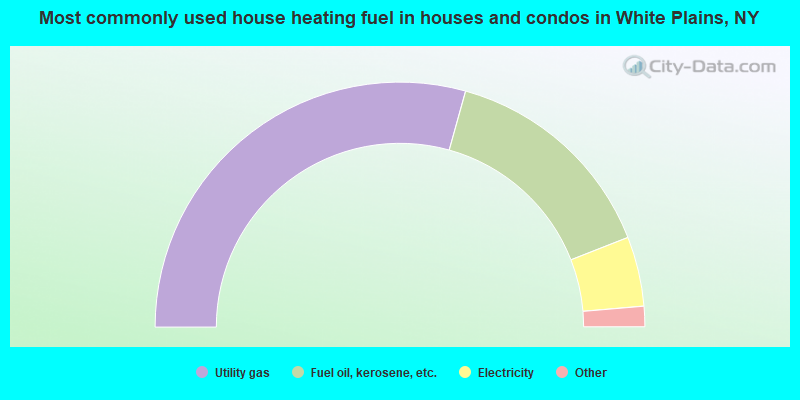
House heating fuel used in houses and condos - Utility gas (%)
House heating fuel used in houses and condos - Bottled, tank, or LP gas (%)
House heating fuel used in houses and condos - Electricity (%)
House heating fuel used in houses and condos - Fuel oil, kerosene, etc. (%)
House heating fuel used in houses and condos - Coal or coke (%)
House heating fuel used in houses and condos - Wood (%)
House heating fuel used in houses and condos - Solar energy (%)
House heating fuel used in houses and condos - Other fuel (%)
House heating fuel used in houses and condos - No fuel used (%)
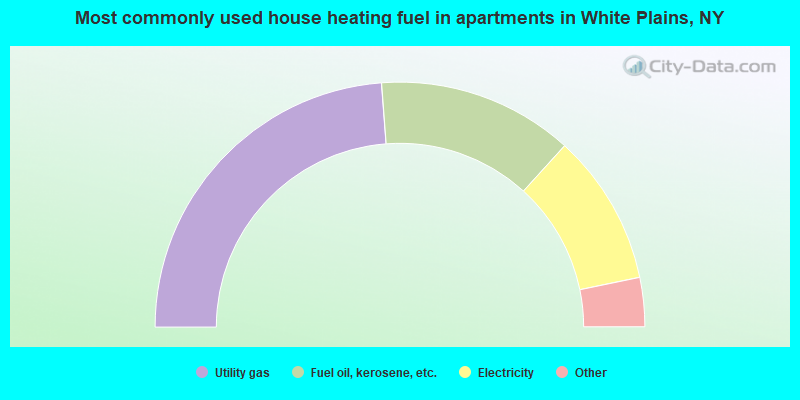
House heating fuel used in apartments - Utility gas (%)
House heating fuel used in apartments - Bottled, tank, or LP gas (%)
House heating fuel used in apartments - Electricity (%)
House heating fuel used in apartments - Fuel oil, kerosene, etc. (%)
House heating fuel used in apartments - Coal or coke (%)
House heating fuel used in apartments - Wood (%)
House heating fuel used in apartments - Solar energy (%)
House heating fuel used in apartments - Other fuel (%)
House heating fuel used in apartments - No fuel used (%)
Median year house/condo built: 1955Median year apartment built: 1968Household type by relationship:
Households: 58,975
Male householders: 11,632 (3,030 living alone ), Female householders: 12,249 (4,984 living alone )10,934 spouses (10,827 opposite-sex spouses ), 1,514 unmarried partners , (1,446 opposite-sex unmarried partners ), 16,258 children (15,498 natural , 315 adopted , 443 stepchildren ), 651 grandchildren , 862 brothers or sisters , 783 parents , 0 foster children , 1,002 other relatives , 1,720 non-relatives In group quarters: 1,367
Size of family households: 6,053 2-persons , 3,001 3-persons , 3,478 4-persons , 1,074 5-persons , 472 6-persons , 192 7-or-more-persons .
Size of nonfamily households: 8,711 1-person , 1,693 2-persons , 37 3-persons .
6,904 married couples with children. single-parent households (838 men , 1,538 women ).
60.4% of residents of White Plains speak English at home. of residents speak Spanish at home (50% speak English very well , 26% speak English well , 18% speak English not well , 6% don't speak English at all ).of residents speak other Indo-European language at home (73% speak English very well , 16% speak English well , 9% speak English not well , 1% don't speak English at all ).of residents speak Asian or Pacific Island language at home (63% speak English very well , 24% speak English well , 8% speak English not well , 5% don't speak English at all ).of residents speak other language at home (83% speak English very well , 12% speak English well , 4% speak English not well ).
Foreign born population: 18,316 (31.1%)of them are naturalized citizens )
Median number of rooms in houses and condos:
Median number of rooms in apartments
Owner-occupied Renter-occupied
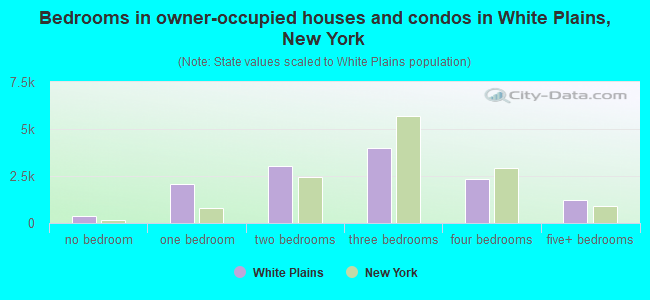
Bedrooms in owner-occupied houses and condos in White Plains, New York
350 no bedroom 2,096 1 bedroom 3,040 2 bedrooms 3,991 3 bedrooms 2,322 4 bedrooms 1,204 5+ bedrooms
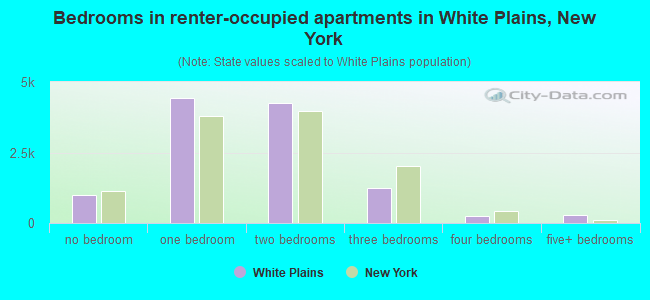
Bedrooms in renter-occupied apartments in White Plains, New York
1,006 no bedroom 4,423 1 bedroom 4,246 2 bedrooms 1,253 3 bedrooms 243 4 bedrooms 266 5+ bedrooms
Owner-occupied Renter-occupied
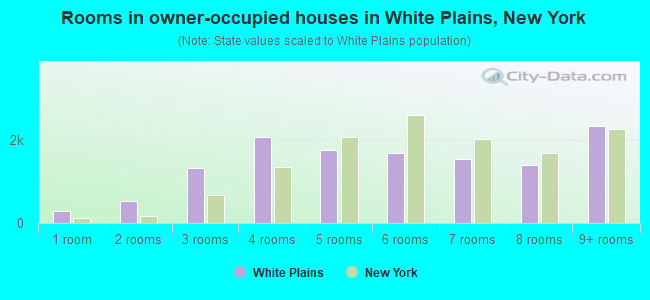
Rooms in owner-occupied houses in White Plains, New York
283 1 room 542 2 rooms 1,325 3 rooms 2,084 4 rooms 1,753 5 rooms 1,704 6 rooms 1,550 7 rooms 1,412 8 rooms 2,348 9+ rooms
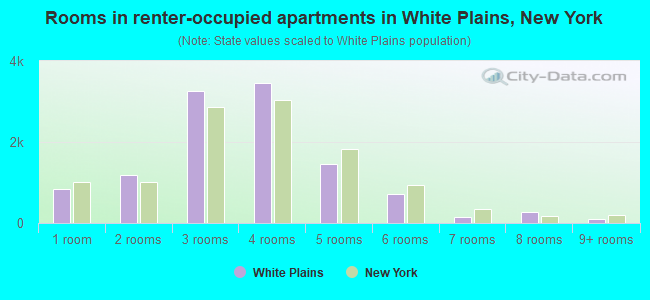
Rooms in renter-occupied apartments in White Plains, New York
840 1 room 1,190 2 rooms 3,263 3 rooms 3,455 4 rooms 1,445 5 rooms 722 6 rooms 157 7 rooms 261 8 rooms 102 9+ rooms
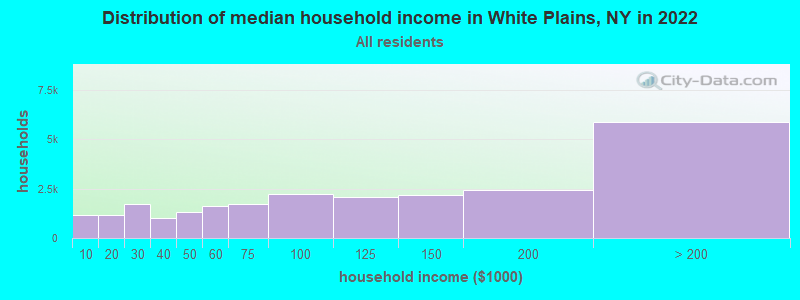
White Plains, NY household income distribution 1,143 Less than $10,0001,167 $10,000 to $19,9991,709 $20,000 to $29,999995 $30,000 to $39,9991,334 $40,000 to $49,9991,611 $50,000 to $59,9991,732 $60,000 to $74,9992,200 $75,000 to $99,9992,069 $100,000 to $124,9992,179 $125,000 to $149,9992,443 $150,000 to $199,9995,862 $200,000 or more
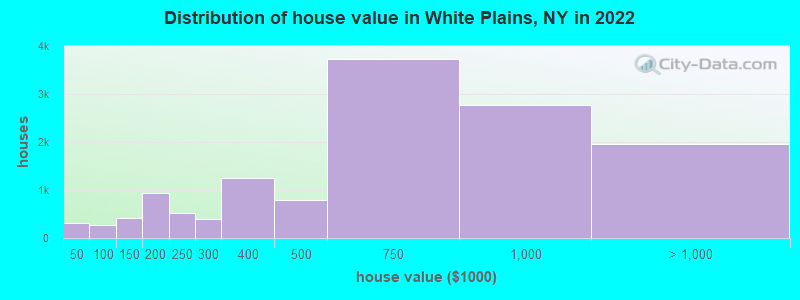
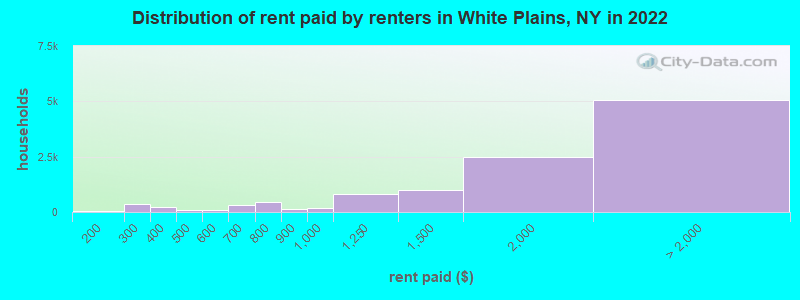
Home value of owner - occupied houses in 2022 in White Plains, NY 134 Less than $10,00013 $10,000 to $14,99912 $15,000 to $19,99936 $20,000 to $24,999117 $40,000 to $49,99910 $50,000 to $59,99945 $60,000 to $69,99976 $70,000 to $79,99914 $80,000 to $89,99915 $90,000 to $99,999217 $100,000 to $124,999190 $125,000 to $149,999602 $150,000 to $174,999334 $175,000 to $199,999510 $200,000 to $249,999400 $250,000 to $299,9991,248 $300,000 to $399,999800 $400,000 to $499,9993,727 $500,000 to $749,9992,768 $750,000 to $999,9991,323 $1,000,000 to $1,499,999454 $1,500,000 to $1,999,999172 $2,000,000 or moreRent paid by renters in 2022 in White Plains, NY 34 Less than $10043 $100 to $1497 $150 to $199242 $200 to $249101 $250 to $299189 $300 to $34955 $350 to $39926 $400 to $44947 $450 to $49946 $500 to $54928 $550 to $59955 $600 to $649242 $650 to $699176 $700 to $749254 $750 to $799134 $800 to $899201 $900 to $999826 $1,000 to $1,249988 $1,250 to $1,4992,494 $1,500 to $1,9991,907 $2,000 to $2,4991,099 $2,500 to $2,999637 $3,000 to $3,499925 $3,500 or more477 No cash rent
Percentage of workers working in this county: 75.4%Number of people working at home: 6,388 (20.8% of all workers )
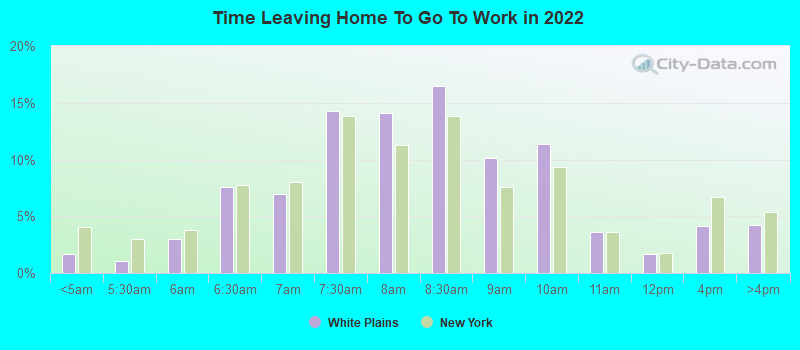
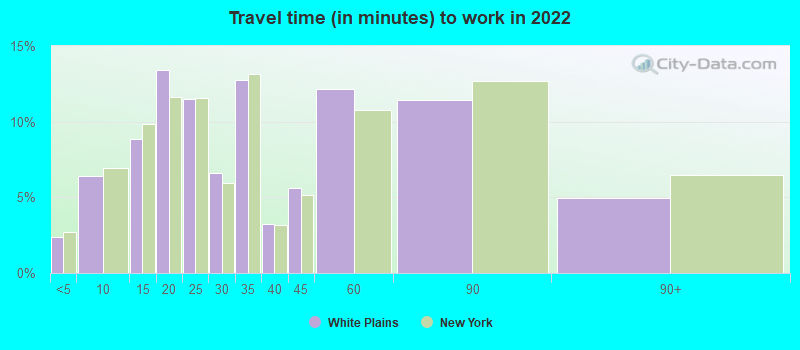
Travel time to work (commute)
Less than 5 minutes: 8455 to 9 minutes: 2,60310 to 14 minutes: 2,83915 to 19 minutes: 4,49120 to 24 minutes: 3,20225 to 29 minutes: 1,48130 to 34 minutes: 2,21235 to 39 minutes: 62140 to 44 minutes: 1,37045 to 59 minutes: 1,64260 to 89 minutes: 2,43990 or more minutes: 843
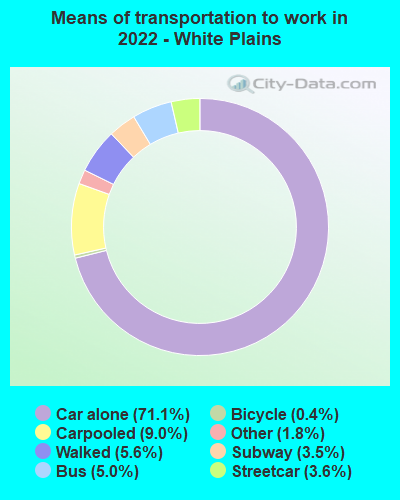
Means of transportation to work:
Drove a car alone: 33,822 (61.1%)Carpooled: 4,343 (7.8%)Bus : 2,047 (3.7%)Subway or elevated rail : 2,268 (4.1%)Long-distance train or commuter rail : 1,238 (2.2%)Light rail, streetcar or trolley : 32 (0.1%)Taxi: 1,475 (2.7%)Bicycle: 218 (0.4%)Walked: 2,649 (4.8%)Worked at home: 6,388 (11.5%)
Unemployment by race in 2022
Unemployment rate for White non-Hispanic residents 3.9% Males3.3% FemalesUnemployment rate for Black residents 4.9% Males3.3% FemalesUnemployment rate for Asian residents 0.4% Males6.5% FemalesUnemployment rate for other race residents 5.2% Males3.0% FemalesUnemployment rate for two or more race residents 4.8% Males3.0% FemalesUnemployment rate for Hispanic or Latino residents 6.8% Males2.4% Females
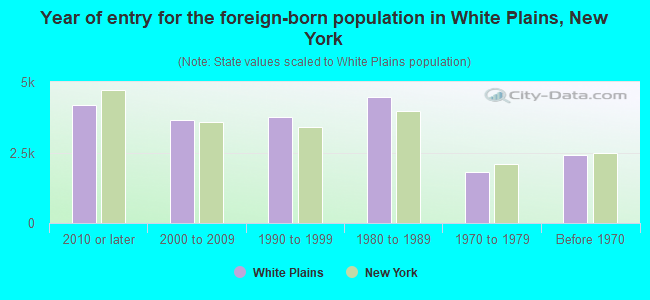
Year of entry for the foreign-born population in White Plains, New York
4,169 2010 or later 3,636 2000 to 2009 3,769 1990 to 1999 4,477 1980 to 1989 1,814 1970 to 1979 2,398 Before 1970
First ancestries reported:
Italian: 3,192 (9.0%)
American: 2,197 (6.2%)
Irish: 1,796 (5.0%)
Albanian: 1,223 (3.4%)
Eastern European: 1,043 (2.9%)
German: 848 (2.4%)
Jamaican: 838 (2.4%)
Haitian: 612 (1.7%)
Polish: 608 (1.7%)
Russian: 553 (1.6%)
African: 395 (1.1%)
European: 360 (1.0%)
English: 334 (0.9%)
Brazilian: 274 (0.8%)
Scottish: 170 (0.5%)
Ukrainian: 162 (0.5%)
Canadian: 92 (0.3%)
Serbian: 90 (0.3%)
Guyanese: 86 (0.2%)
Israeli: 83 (0.2%)
Australian: 71 (0.2%)
Hungarian: 68 (0.2%)
Lithuanian: 66 (0.2%)
Egyptian: 64 (0.2%)
Portuguese: 62 (0.2%)
Greek: 54 (0.2%)
Croatian: 49 (0.1%)
Norwegian: 49 (0.1%)
Swiss: 46 (0.1%)
Romanian: 45 (0.1%)
Armenian: 45 (0.1%)
Cypriot: 44 (0.1%)
Slovak: 42 (0.1%)
Trinidadian and Tobagonian: 41 (0.1%)
Swedish: 36 (0.1%)
British: 31 (0.09%)
Turkish: 30 (0.08%)
Dutch: 30 (0.08%)
French: 30 (0.08%)
French Canadian: 29 (0.08%)
Czech: 28 (0.08%)
Ethiopian: 27 (0.08%)
Danish: 27 (0.08%)
Austrian: 25 (0.07%)
Iranian: 24 (0.07%)
Barbadian: 23 (0.06%)
Kenyan: 20 (0.06%)
Northern European: 19 (0.05%)
British West Indian: 18 (0.05%)
South African: 16 (0.04%)
Bahamian: 14 (0.04%)
Czechoslovakian: 13 (0.04%)
Ghanaian: 12 (0.03%)
Belgian: 11 (0.03%)
Arab: 11 (0.03%)
Lebanese: 11 (0.03%)
Scotch-Irish: 11 (0.03%)
Estonian: 9 (0.03%)
Finnish: 8 (0.02%)
Maltese: 5 (0.01%)
Moroccan: 5 (0.01%)
West Indian: 4 (0.01%)
Syrian: 3 (0.01%)
Most common places of birth for foreign-born residents (%): Mexico White Plains:
12.1% (2,188)New York:
4.8% (214,559)
Colombia White Plains:
10.9% (1,981)New York:
2.5% (111,920)
Peru White Plains:
10.4% (1,889)New York:
1.2% (54,759)
India White Plains:
5.5% (992)New York:
3.5% (158,432)
Dominican Republic White Plains:
5.3% (962)New York:
11.1% (501,040)
Guatemala White Plains:
4.1% (751)New York:
1.4% (61,245)
China, excluding Hong Kong and Taiwan White Plains:
3.8% (695)New York:
9.1% (410,910)
Ecuador White Plains:
3.8% (690)New York:
3.9% (177,448)
Jamaica White Plains:
3.0% (548)New York:
5.0% (227,557)
Chile White Plains:
3.0% (539)New York:
0.3% (11,831)
Haiti White Plains:
2.4% (433)New York:
2.8% (126,936)
Italy White Plains:
2.3% (422)New York:
1.8% (81,374)
Germany White Plains:
2.2% (390)New York:
0.9% (38,713)
Albania White Plains:
2.1% (389)New York:
0.6% (25,362)
Brazil White Plains:
2.0% (366)New York:
0.7% (30,658)
Philippines White Plains:
1.6% (284)New York:
2.0% (91,070)
Place of birth for U.S.-born residents:
This state: 32,422Other state: 6,844Northeast: 3,225Midwest: 1,214South: 1,614West: 796 88.9% of White Plains residents lived in the same house 1 years ago.
Out of people who lived in different houses, 36.3% lived in this county.
Out of people who lived in different counties, 54.0% lived in New York.
White Plains:
88.9%State average:
89.6%
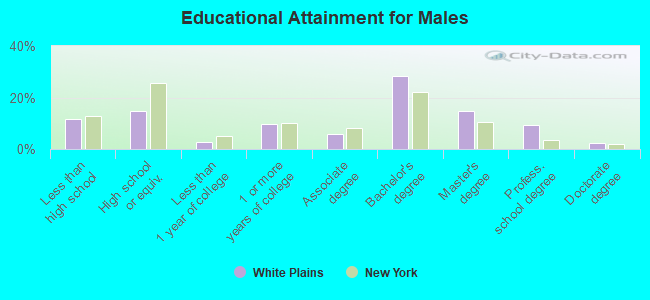
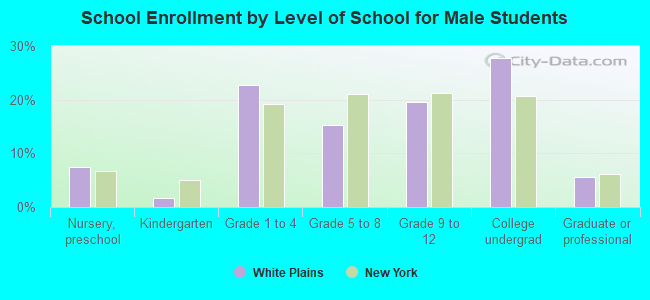
Education attainment for males 25 years and older:
No schooling: 271Nursery to 4th grade: 1495th and 6th grade: 4047th and 8th grade: 3029th grade: 5210th grade: 5611th grade: 25812th grade, no diploma: 950High school graduate (or equivalency): 3,091Less than 1 year of college: 587Some college more than 1 year, no degree: 1,987Associate degree: 1,202Bachelor's degree: 5,840Master's degree: 3,059Professional school degree: 1,959Doctorate degree: 504
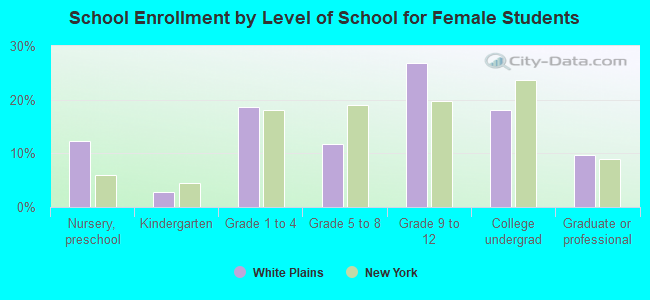
Education attainment for females 25 years and older:
No schooling: 414Nursery to 4th grade: 1615th and 6th grade: 4337th and 8th grade: 2119th grade: 16610th grade: 20611th grade: 17512th grade, no diploma: 432High school graduate (or equivalency): 4,291Less than 1 year of college: 1,051Some college more than 1 year, no degree: 1,479Associate degree: 1,804Bachelor's degree: 5,484Master's degree: 4,773Professional school degree: 1,438Doctorate degree: 456
Housing units in structures:
One, detached: 7,575One, attached: 837Two: 1,2573 or 4: 1,1795 to 9: 1,03810 to 19: 1,35620 to 49: 3,16650 or more: 9,847Mobile homes: 15Boats, RVs, vans, etc.: 39Housing units lacking complete plumbing facilities in 2022: 0.6%Housing units lacking complete kitchen facilities in 2022: 1.8%House/condo owner moved in on average 13 years ago
Renter moved in on average 3 years ago
Private vs. public school enrollment:
Students in private schools in grades 1 to 8 (elementary and middle school): 819 Students in private schools in grades 9 to 12 (high school): 556 Students in private undergraduate colleges: 1,160