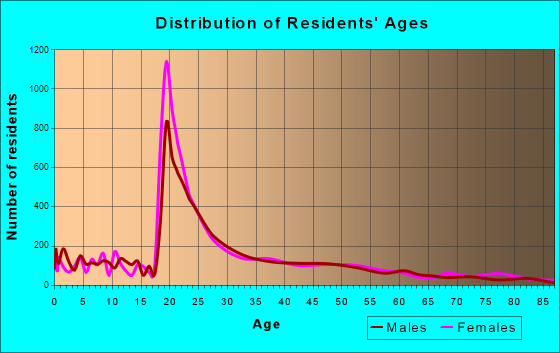
Ypsilanti, MI (Michigan) Houses and Residents
| Ypsilanti: | $222,034 |
| Michigan: | $224,400 |
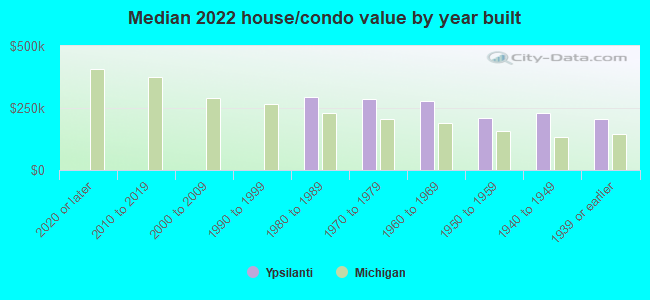
Mean price in 2022:
Detached houses: $216,859
Here: $216,859 State: $280,038 Townhouses or other attached units: $170,387
Here: $170,387 State: $239,520 In 2-unit structures: $205,970
Here: $205,970 State: $219,481 In 3-to-4-unit structures: $367,357
Here: $367,357 State: $207,067 In 5-or-more-unit structures: $112,248
Here: $112,248 State: $192,733
Total population: 20,081 (All urban)
Houses: 9,360 (8,745 occupied: 2,943 owner occupied, 5,811 renter occupied)
| % of renters here: | 66% |
| State: | 27% |
Housing density: 2,127 houses/condos per square mile
Median price asked for vacant for-sale houses and condos in 2022: $172,458.
Median contract rent in 2022: $901 (lower quartile is $675, upper quartile is $1,139)
Median rent asked for vacant for-rent units in 2022: $1,247
Median gross rent in Ypsilanti, MI in 2022: $971
Housing units in Ypsilanti with a mortgage: 1,694 (237 second mortgage, 0 home equity loan, 228 both second mortgage and home equity loan)
Houses without a mortgage: 5
Median household income for houses/condos with a mortgage: $86,286
Median household income for apartments without a mortgage: $46,184
Median monthly housing costs: $988
Compare current foreclosures in Ypsilanti, MI:
| Photo | Address | Area | Beds / Baths | Price | Details |
|---|---|---|---|---|---|

|
#1
Valley Dr
Ypsilanti, MI 48197
|
1,300 sq. feet
|
1 baths 3 beds |
$325,000
|
show details |

|
#2
Crestwood Ave
Ypsilanti, MI 48198
|
967 sq. feet
|
1 baths 3 beds |
show details | |

|
#3
Nottingham Ct
Ypsilanti, MI 48198
|
1,446 sq. feet
|
2 baths 3 beds |
show details | |

|
#4
Rolling Meadow Ln
Ypsilanti, MI 48197
|
2,188 sq. feet
|
2 baths 4 beds |
show details | |

|
#5
Spy Glass Ln
Ypsilanti, MI 48197
|
1,900 sq. feet
|
2 baths 4 beds |
show details | |

|
#6
Warwick Dr
Ypsilanti, MI 48197
|
- sq. feet
|
2 baths 3 beds |
show details | |

|
#7
Studebaker Ave
Ypsilanti, MI 48198
|
1,026 sq. feet
|
1 baths - beds |
show details | |

|
#8
Woodcreek Ct Apt 104
Ypsilanti, MI 48198
|
- sq. feet
|
- baths - beds |
show details | |

|
#9
S Harris Rd
Ypsilanti, MI 48198
|
- sq. feet
|
- baths - beds |
show details | |

|
#10
W Michigan Ave Apt 302
Ypsilanti, MI 48197
|
- sq. feet
|
- baths - beds |
show details |
| Photo | Address | Area | Beds / Baths | Price | Details |
|---|---|---|---|---|---|

|
#11
Cliffs Dr Apt 302
Ypsilanti, MI 48198
|
- sq. feet
|
- baths - beds |
show details | |

|
#12
Nottingham Dr
Ypsilanti, MI 48198
|
- sq. feet
|
- baths - beds |
show details | |

|
#13
Lakeshore Blvd Apt A415
Ypsilanti, MI 48198
|
- sq. feet
|
- baths - beds |
show details | |

|
#14
Lakeview Dr Apt 228
Ypsilanti, MI 48198
|
- sq. feet
|
- baths - beds |
show details | |

|
#15
Barrington Dr
Ypsilanti, MI 48198
|
- sq. feet
|
- baths - beds |
show details | |

|
#16
Ridge Rd Lot 187
Ypsilanti, MI 48198
|
- sq. feet
|
- baths - beds |
show details | |

|
#17
Mckean Rd Lot 55
Ypsilanti, MI 48197
|
- sq. feet
|
- baths - beds |
show details | |

|
#18
Heatherridge St
Ypsilanti, MI 48198
|
- sq. feet
|
- baths - beds |
show details | |

|
#19
Golfside Rd Apt 202
Ypsilanti, MI 48197
|
- sq. feet
|
- baths - beds |
show details | |

|
#20
Plum Hollow Dr Apt 2
Ypsilanti, MI 48197
|
- sq. feet
|
- baths - beds |
show details |
| Photo | Address | Area | Beds / Baths | Price | Details |
|---|---|---|---|---|---|

|
#21
W Michigan Ave
Ypsilanti, MI 48197
|
- sq. feet
|
- baths - beds |
show details | |

|
#22
Green Rd Apt 206
Ypsilanti, MI 48198
|
- sq. feet
|
- baths - beds |
show details | |

|
#23
Chester Dr Apt 211
Ypsilanti, MI 48197
|
- sq. feet
|
- baths - beds |
show details | |

|
#24
Forest Ct
Ypsilanti, MI 48198
|
- sq. feet
|
- baths - beds |
show details | |

|
#25
Carpenter Rd
Ypsilanti, MI 48197
|
- sq. feet
|
- baths - beds |
show details | |

|
#26
S Harris Rd
Ypsilanti, MI 48198
|
- sq. feet
|
- baths - beds |
show details | |

|
#27
Woodview Dr Apt 821
Ypsilanti, MI 48198
|
- sq. feet
|
- baths - beds |
show details | |

|
#28
White Tail Dr
Ypsilanti, MI 48197
|
- sq. feet
|
- baths - beds |
show details | |

|
#29
Mckean Rd Lot 126
Ypsilanti, MI 48197
|
- sq. feet
|
- baths - beds |
show details | |

|
#30
Abigail Dr
Ypsilanti, MI 48198
|
- sq. feet
|
- baths - beds |
show details |
| Photo | Address | Area | Beds / Baths | Price | Details |
|---|---|---|---|---|---|

|
#31
Lake Dr # 104
Ypsilanti, MI 48197
|
- sq. feet
|
- baths - beds |
show details | |

|
#32
Timberlane St
Ypsilanti, MI 48197
|
- sq. feet
|
- baths - beds |
show details | |

|
#33
Ravine Ct
Ypsilanti, MI 48197
|
- sq. feet
|
- baths - beds |
show details | |

|
#34
Washtenaw Rd Apt 1a
Ypsilanti, MI 48197
|
- sq. feet
|
- baths - beds |
show details | |

|
#35
Colchester Ln
Ypsilanti, MI 48197
|
- sq. feet
|
- baths - beds |
show details | |

|
#36
Woodruff Ln
Ypsilanti, MI 48198
|
- sq. feet
|
- baths - beds |
show details | |

|
#37
Davis St
Ypsilanti, MI 48198
|
- sq. feet
|
- baths - beds |
show details | |

|
#38
Golfside Rd Apt 110
Ypsilanti, MI 48197
|
- sq. feet
|
- baths - beds |
show details | |

|
#39
Lakeshore Blvd Apt 681
Ypsilanti, MI 48198
|
- sq. feet
|
- baths - beds |
show details | |

|
#40
Eugene St
Ypsilanti, MI 48198
|
- sq. feet
|
- baths - beds |
show details |
| Photo | Address | Area | Beds / Baths | Price | Details |
|---|---|---|---|---|---|

|
#41
Carpenter Rd # 201
Ypsilanti, MI 48197
|
- sq. feet
|
- baths - beds |
show details | |

|
#42
Forest Ct
Ypsilanti, MI 48198
|
- sq. feet
|
- baths - beds |
show details | |

|
#43
Lakeshore Blvd Apt A314
Ypsilanti, MI 48198
|
- sq. feet
|
- baths - beds |
show details | |

|
#44
Ballard St # A
Ypsilanti, MI 48197
|
- sq. feet
|
- baths - beds |
show details | |

|
#45
W Michigan Ave Apt 203
Ypsilanti, MI 48197
|
- sq. feet
|
- baths - beds |
show details | |

|
#46
Twin Lakes Dr Apt 1a
Ypsilanti, MI 48197
|
- sq. feet
|
- baths - beds |
show details | |

|
#47
Roundtree Blvd Apt C4
Ypsilanti, MI 48197
|
- sq. feet
|
- baths - beds |
show details | |

|
#48
Macarthur Blvd
Ypsilanti, MI 48198
|
- sq. feet
|
- baths - beds |
show details | |

|
#49
N Redwood Ave Apt 4
Ypsilanti, MI 48198
|
- sq. feet
|
- baths - beds |
show details | |

|
Check over 1 million property listings on Foreclosure.com!
|
browse all offers | |||

Latest news about housing in Ypsilanti, MI collected exclusively by city-data.com from local newspapers, TV, and radio stations


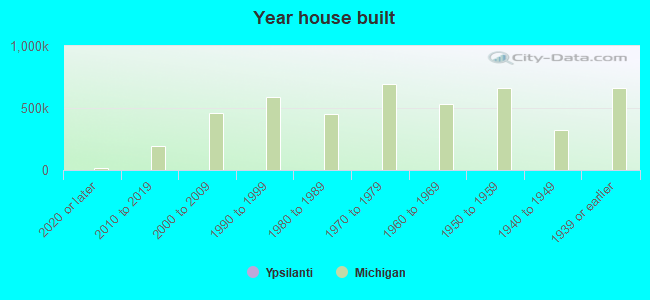
Median year apartment built: 1965
Household type by relationship:
Households: 19,993- Male householders: 4,367 (2,194 living alone), Female householders: 4,168 (1,683 living alone)
1,695 spouses (1,618 opposite-sex spouses), 956 unmarried partners, (897 opposite-sex unmarried partners), 3,437 children (3,200 natural, 84 adopted, 153 stepchildren), 279 grandchildren, 225 brothers or sisters, 58 parents, 23 foster children, 103 other relatives, 1,819 non-relatives
- In group quarters: 2,857
Size of family households: 1,487 2-persons, 719 3-persons, 429 4-persons, 234 5-persons, 54 6-persons, 21 7-or-more-persons.
Size of nonfamily households: 3,876 1-person, 1,392 2-persons, 176 3-persons, 175 4-persons, 71 5-persons, 20 6-persons, 47 7-or-more-persons.
1,256 married couples with children.
1,553 single-parent households (92 men, 1,461 women).
85.2% of residents of Ypsilanti speak English at home.
3.8% of residents speak Spanish at home (79% speak English very well, 3% speak English well, 9% speak English not well, 8% don't speak English at all).
4.1% of residents speak other Indo-European language at home (57% speak English very well, 28% speak English well, 6% speak English not well, 10% don't speak English at all).
2.7% of residents speak Asian or Pacific Island language at home (93% speak English very well, 5% speak English well, 2% speak English not well).
3.4% of residents speak other language at home (64% speak English very well, 23% speak English well, 5% speak English not well, 8% don't speak English at all).
Foreign born population: 1,881 (9.4%)
(51.6% of them are naturalized citizens)
| Here: | 6.3 |
| State: | 6.5 |
| Here: | 3.8 |
| State: | 4.3 |
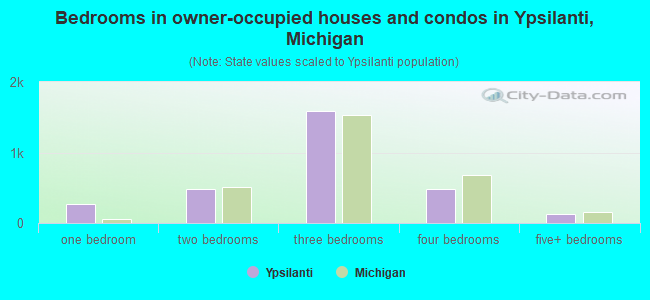
- Bedrooms in owner-occupied houses and condos in Ypsilanti, Michigan
- 3no bedroom
- 2671 bedroom
- 4832 bedrooms
- 1,5853 bedrooms
- 4854 bedrooms
- 1215+ bedrooms
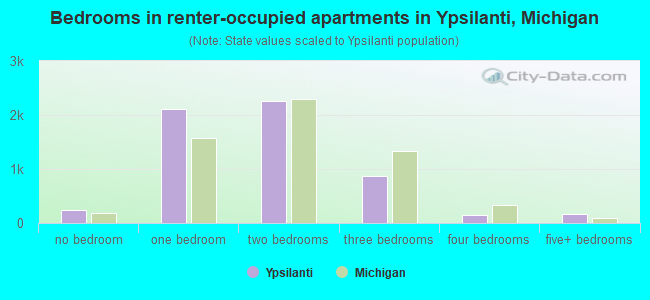
- Bedrooms in renter-occupied apartments in Ypsilanti, Michigan
- 235no bedroom
- 2,1061 bedroom
- 2,2672 bedrooms
- 8723 bedrooms
- 1574 bedrooms
- 1745+ bedrooms
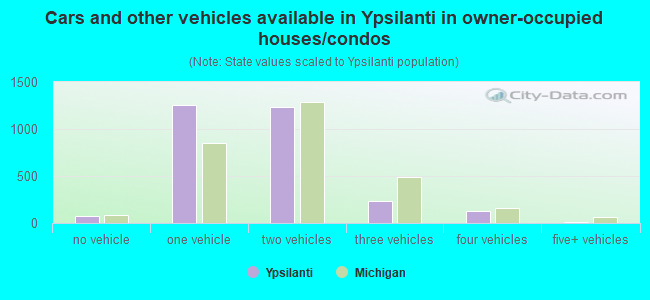
- Cars and other vehicles available in Ypsilanti in owner-occupied houses/condos
- 74no vehicle
- 1,2601 vehicle
- 1,2362 vehicles
- 2393 vehicles
- 1244 vehicles
- 115+ vehicles
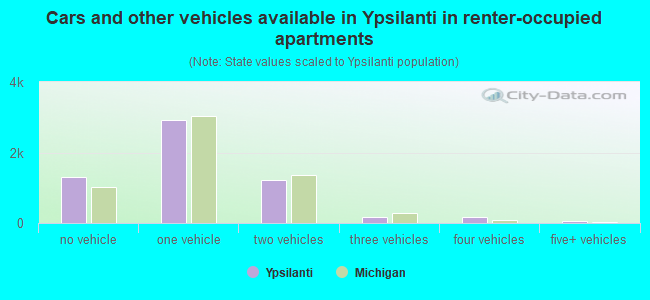
- Cars and other vehicles available in Ypsilanti in renter-occupied apartments
- 1,295no vehicle
- 2,9081 vehicle
- 1,2142 vehicles
- 1713 vehicles
- 1644 vehicles
- 595+ vehicles
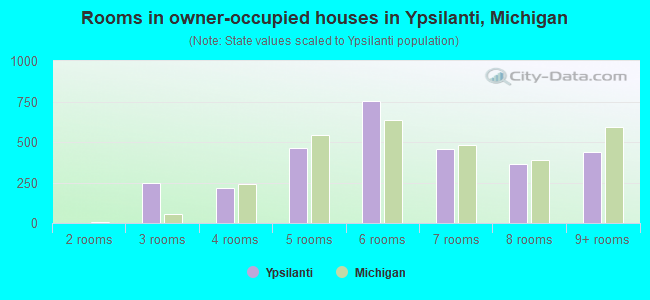
- Rooms in owner-occupied houses in Ypsilanti, Michigan
- 31 room
- 02 rooms
- 2473 rooms
- 2174 rooms
- 4665 rooms
- 7536 rooms
- 4547 rooms
- 3658 rooms
- 4399+ rooms
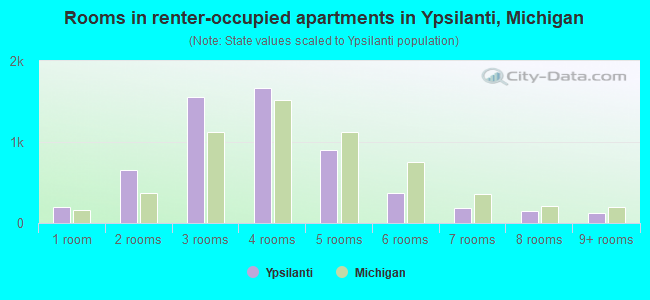
- Rooms in renter-occupied apartments in Ypsilanti, Michigan
- 2011 room
- 6572 rooms
- 1,5503 rooms
- 1,6644 rooms
- 9045 rooms
- 3756 rooms
- 1877 rooms
- 1488 rooms
- 1269+ rooms
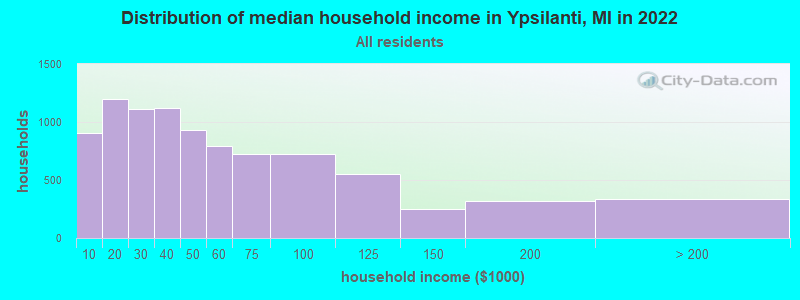
Ypsilanti, MI household income distribution

- 901Less than $10,000
- 1,199$10,000 to $19,999
- 1,108$20,000 to $29,999
- 1,125$30,000 to $39,999
- 931$40,000 to $49,999
- 794$50,000 to $59,999
- 727$60,000 to $74,999
- 724$75,000 to $99,999
- 552$100,000 to $124,999
- 253$125,000 to $149,999
- 323$150,000 to $199,999
- 337$200,000 or more
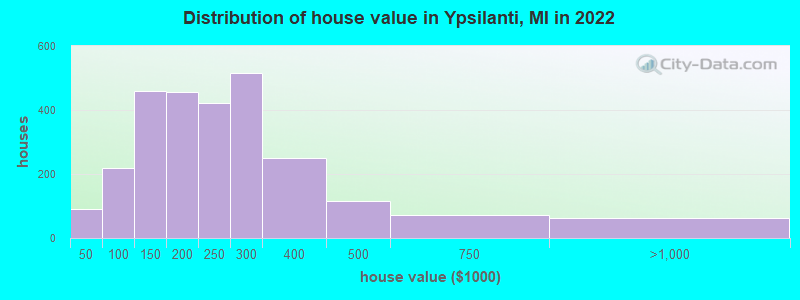
Home value of owner - occupied houses in 2022 in Ypsilanti, MI
-
- 21Less than $10,000
- 5$10,000 to $14,999
- 25$15,000 to $19,999
- 4$20,000 to $24,999
- 15$30,000 to $34,999
- 18$40,000 to $49,999
- 4$50,000 to $59,999
- 42$60,000 to $69,999
- 25$70,000 to $79,999
- 69$80,000 to $89,999
- 57$90,000 to $99,999
- 124$100,000 to $124,999
- 335$125,000 to $149,999
- 342$150,000 to $174,999
- 112$175,000 to $199,999
- 423$200,000 to $249,999
- 515$250,000 to $299,999
- 250$300,000 to $399,999
- 115$400,000 to $499,999
- 73$500,000 to $749,999
- 63$750,000 to $999,999
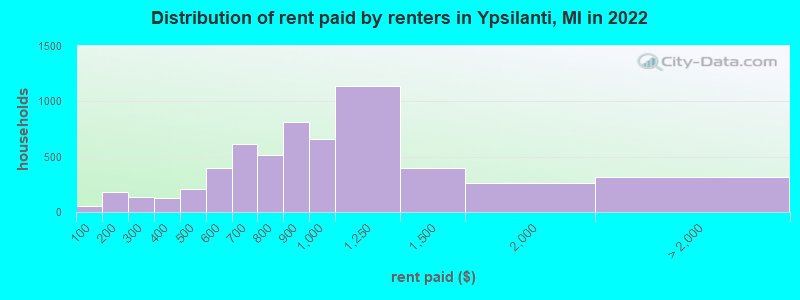
Rent paid by renters in 2022 in Ypsilanti, MI
-
- 58Less than $100
- 96$100 to $149
- 80$150 to $199
- 73$200 to $249
- 60$250 to $299
- 39$300 to $349
- 88$350 to $399
- 101$400 to $449
- 107$450 to $499
- 254$500 to $549
- 145$550 to $599
- 352$600 to $649
- 261$650 to $699
- 311$700 to $749
- 206$750 to $799
- 810$800 to $899
- 663$900 to $999
- 1,136$1,000 to $1,249
- 400$1,250 to $1,499
- 264$1,500 to $1,999
- 60$2,000 to $2,499
- 49$3,000 to $3,499
- 34$3,500 or more
- 168No cash rent
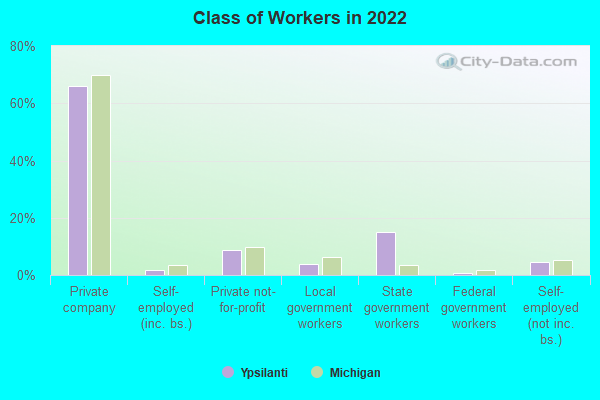
Percentage of workers working in this county: 85.9%
Number of people working at home: 1,736 (17.2% of all workers)
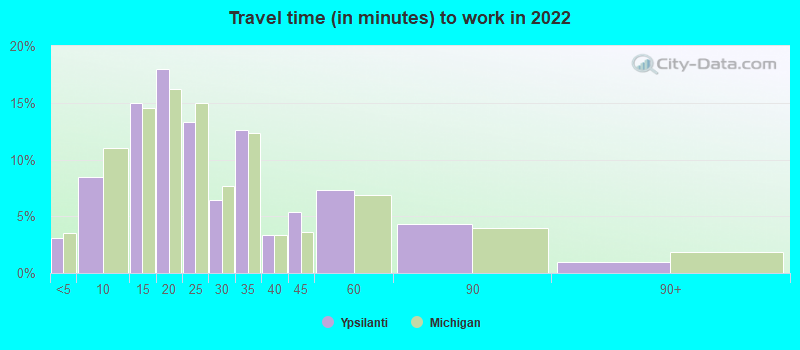
Travel time to work (commute)
- Less than 5 minutes: 149
- 5 to 9 minutes: 802
- 10 to 14 minutes: 954
- 15 to 19 minutes: 1,852
- 20 to 24 minutes: 1,378
- 25 to 29 minutes: 738
- 30 to 34 minutes: 1,060
- 35 to 39 minutes: 232
- 40 to 44 minutes: 199
- 45 to 59 minutes: 440
- 60 to 89 minutes: 258
- 90 or more minutes: 106
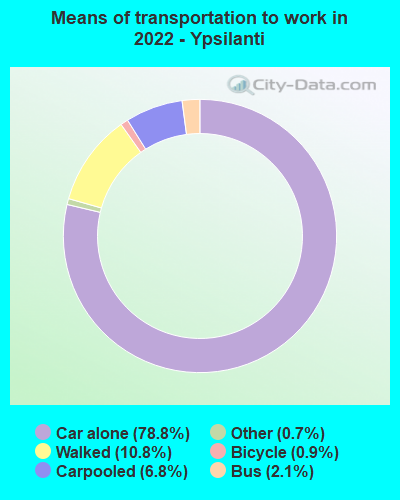
Means of transportation to work:
- Drove a car alone: 6,998 (66.6%)
- Carpooled: 599 (5.7%)
- Bus: 181 (1.7%)
- Taxi: 65 (0.6%)
- Bicycle: 61 (0.6%)
- Walked: 736 (7.0%)
- Worked at home: 1,736 (16.5%)
- Unemployment by race in 2022
- Unemployment rate for White non-Hispanic residents
- 4.6%Males
- 4.9%Females
- Unemployment rate for Black residents
- 9.9%Males
- 9.3%Females
- Unemployment rate for Asian residents
- 5.3%Males
- 2.6%Females
- Unemployment rate for other race residents
- 2.2%Males
- Unemployment rate for two or more race residents
- 3.3%Males
- Unemployment rate for Hispanic or Latino residents
- 1.1%Males
- 20.9%Females
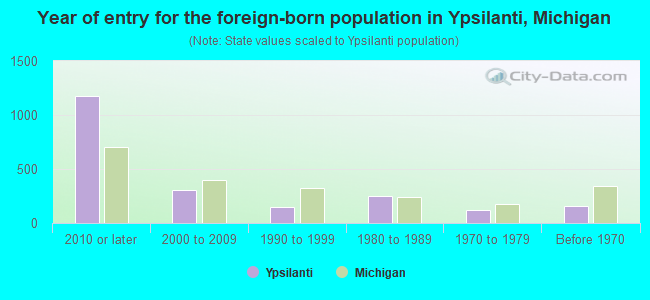
- Year of entry for the foreign-born population in Ypsilanti, Michigan
- 1,1792010 or later
- 3082000 to 2009
- 1511990 to 1999
- 2531980 to 1989
- 1251970 to 1979
- 162Before 1970
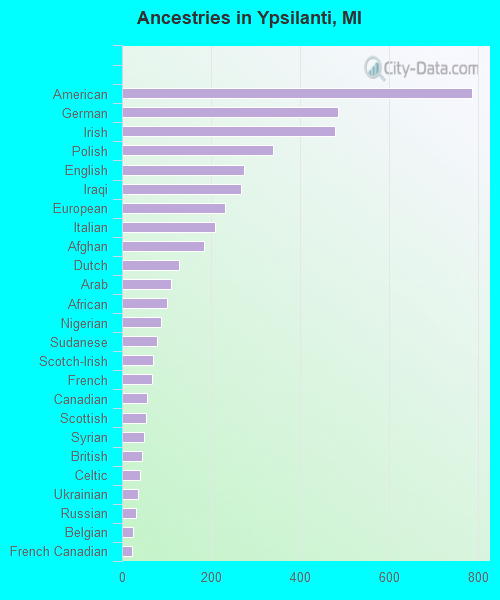
First ancestries reported:
- American: 785 (8.6%)
- German: 484 (5.3%)
- Irish: 478 (5.2%)
- Polish: 340 (3.7%)
- English: 274 (3.0%)
- Iraqi: 267 (2.9%)
- European: 231 (2.5%)
- Italian: 209 (2.3%)
- Afghan: 184 (2.0%)
- Dutch: 129 (1.4%)
- Arab: 109 (1.2%)
- African: 102 (1.1%)
- Nigerian: 88 (1.0%)
- Sudanese: 78 (0.9%)
- Scotch-Irish: 70 (0.8%)
- French: 67 (0.7%)
- Canadian: 56 (0.6%)
- Scottish: 54 (0.6%)
- Syrian: 50 (0.5%)
- British: 44 (0.5%)
- Celtic: 41 (0.4%)
- Ukrainian: 35 (0.4%)
- Russian: 31 (0.3%)
- Belgian: 24 (0.3%)
- French Canadian: 23 (0.3%)
- Norwegian: 18 (0.2%)
- Swedish: 14 (0.2%)
- Lebanese: 13 (0.1%)
- Greek: 13 (0.1%)
- Hungarian: 12 (0.1%)
- Finnish: 12 (0.1%)
- Scandinavian: 10 (0.1%)
- Latvian: 10 (0.1%)
- Moroccan: 9 (0.10%)
- Eastern European: 8 (0.09%)
- Ethiopian: 8 (0.09%)
- Iranian: 7 (0.08%)
- Haitian: 7 (0.08%)
- Danish: 6 (0.07%)
- Serbian: 6 (0.07%)
- Czech: 6 (0.07%)
- West Indian: 6 (0.07%)
- Romanian: 3 (0.03%)
- Slovak: 2 (0.02%)
- Northern European: 2 (0.02%)
- Swiss: 2 (0.02%)
- Austrian: 2 (0.02%)
Most common places of birth for foreign-born residents (%):
| Ypsilanti: | 13.9% (276) |
| Michigan: | 8.1% (55,954) |
| Ypsilanti: | 8.2% (163) |
| Michigan: | 11.1% (77,240) |
| Ypsilanti: | 8.0% (159) |
| Michigan: | 0.2% (1,173) |
| Ypsilanti: | 6.9% (137) |
| Michigan: | 3.1% (21,538) |
| Ypsilanti: | 5.6% (111) |
| Michigan: | 5.0% (35,052) |
| Ypsilanti: | 5.4% (108) |
| Michigan: | 0.5% (3,798) |
| Ypsilanti: | 5.1% (101) |
| Michigan: | 0.9% (5,978) |
| Ypsilanti: | 4.7% (94) |
| Michigan: | 3.0% (20,884) |
| Ypsilanti: | 3.9% (77) |
| Michigan: | 0.3% (2,076) |
| Ypsilanti: | 2.6% (52) |
| Michigan: | 0.1% (867) |
| Ypsilanti: | 2.6% (51) |
| Michigan: | 1.9% (12,910) |
| Ypsilanti: | 2.5% (50) |
| Michigan: | 1.0% (7,097) |
| Ypsilanti: | 2.1% (42) |
| Michigan: | 0.2% (1,613) |
| Ypsilanti: | 2.1% (41) |
| Michigan: | 10.9% (75,965) |
Place of birth for U.S.-born residents:
- This state: 12,389
- Other state: 5,262
- Northeast: 1,151
- Midwest: 1,751
- South: 1,263
- West: 1,052
67.2% of Ypsilanti residents lived in the same house 1 years ago.
Out of people who lived in different houses, 32.7% lived in this county.
Out of people who lived in different counties, 61.3% lived in Michigan.
| Ypsilanti: | 67.2% |
| State average: | 88.4% |
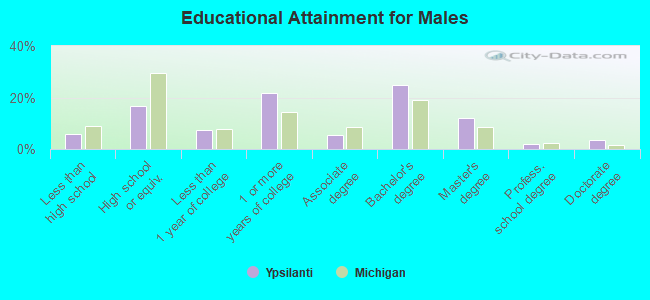
Education attainment for males 25 years and older:
- No schooling: 60
- Nursery to 4th grade: 35
- 5th and 6th grade: 23
- 7th and 8th grade: 40
- 9th grade: 16
- 10th grade: 59
- 11th grade: 27
- 12th grade, no diploma: 69
- High school graduate (or equivalency): 929
- Less than 1 year of college: 409
- Some college more than 1 year, no degree: 1,188
- Associate degree: 309
- Bachelor's degree: 1,369
- Master's degree: 668
- Professional school degree: 108
- Doctorate degree: 193
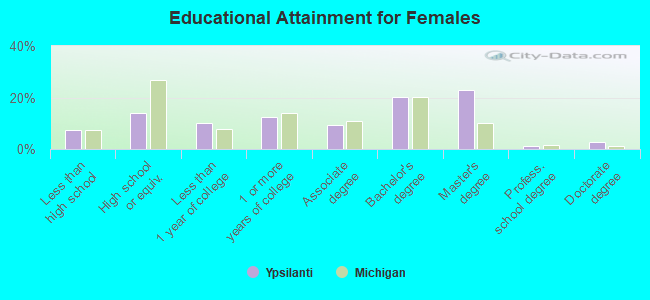
Education attainment for females 25 years and older:
- No schooling: 157
- Nursery to 4th grade: 2
- 5th and 6th grade: 3
- 7th and 8th grade: 13
- 9th grade: 21
- 10th grade: 14
- 11th grade: 122
- 12th grade, no diploma: 55
- High school graduate (or equivalency): 727
- Less than 1 year of college: 533
- Some college more than 1 year, no degree: 658
- Associate degree: 480
- Bachelor's degree: 1,054
- Master's degree: 1,190
- Professional school degree: 56
- Doctorate degree: 145
Housing units in structures:
- One, detached: 3,545
- One, attached: 272
- Two: 536
- 3 or 4: 1,006
- 5 to 9: 1,339
- 10 to 19: 1,086
- 20 to 49: 1,006
- 50 or more: 540
- Mobile homes: 25
Housing units lacking complete kitchen facilities in 2022: 0.9%
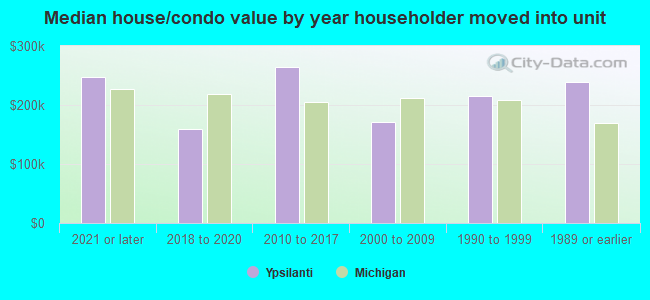
House/condo owner moved in on average 8 years ago
Renter moved in on average 1 years ago
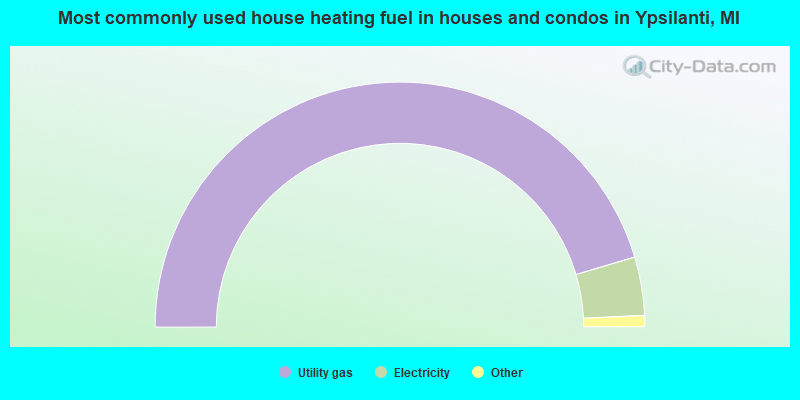
- 90.8%Utility gas
- 7.7%Electricity
- 1.3%Bottled, tank, or LP gas
- 0.1%Other fuel
- 0.1%No fuel used
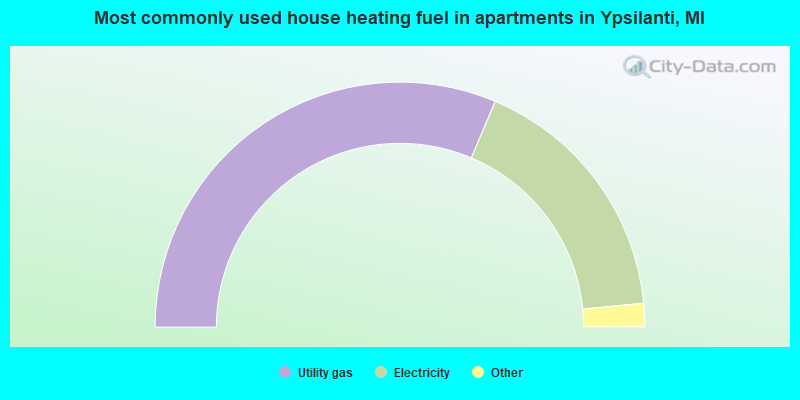
- 62.8%Utility gas
- 34.2%Electricity
- 1.6%Bottled, tank, or LP gas
- 0.8%No fuel used
- 0.5%Other fuel
- 0.2%Fuel oil, kerosene, etc.
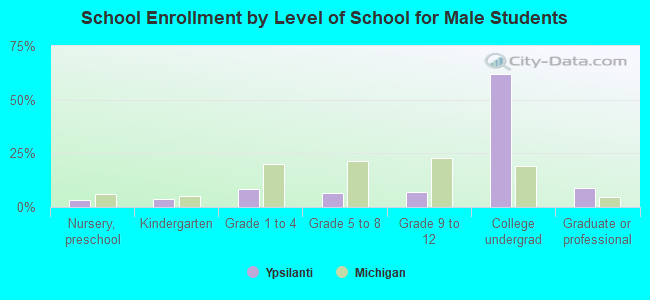
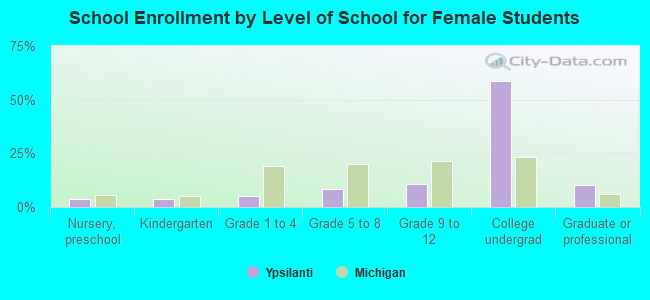
Private vs. public school enrollment:
| Here: | 13.4% |
| Michigan: | 12.4% |
| Here: | 19.6% |
| Michigan: | 9.8% |
| Here: | 1.7% |
| Michigan: | 14.9% |